Guest Post by Bob Tisdale
Many of the visitors here at ClimateObservations and at WattsUpWithThat also spend time arguing with climate alarmists at other websites around the blogosphere. With global sea surface temperatures at record high levels in 2014, the true-blue believers in the hypothesis of human-induced global warming are out in force. This post will present data and other information to counter their claims.
INTRODUCTION
We first discussed the possibility of record high sea surface temperatures back in the June sea surface temperature update. Since then, we discussed the basic reasons for the warm global sea surfaces in many posts and, more recently, confirmed that sea surface temperatures in 2014 will likely be higher than the previous high in 1998. Examples:
- On The Recent Record-High Global Sea Surface Temperatures – The Wheres and Whys
- California Drought – A Novel Statistical Analysis of Unrealistic Climate Models and of a Reanalysis That Should Not Be Equated with Reality
- Axel Timmermann and Kevin Trenberth Highlight the Importance of Natural Variability in Global Warming…
- Meteorological Annual Mean (Dec-Nov) Global Sea Surface Temperatures Set a Record High in 2014 By a Whopping…
As discussed, the record high global sea surface temperatures in 2014 are primarily a response to a prolonged weather event in the North Pacific, like a blocking high.
JUST WHAT AGW PREDICTS
A well-known alarmist chose to leave a comment on my blog here, in which he stated:
Global SSTs at record highs… Just what AGW predicts.
I not only responded to that comment on that thread, I’ve also elected to add a model-data comparison of sea surface temperatures to the start of my monthly sea surface temperature updates, starting with the most recent one for November 2014. It reads:
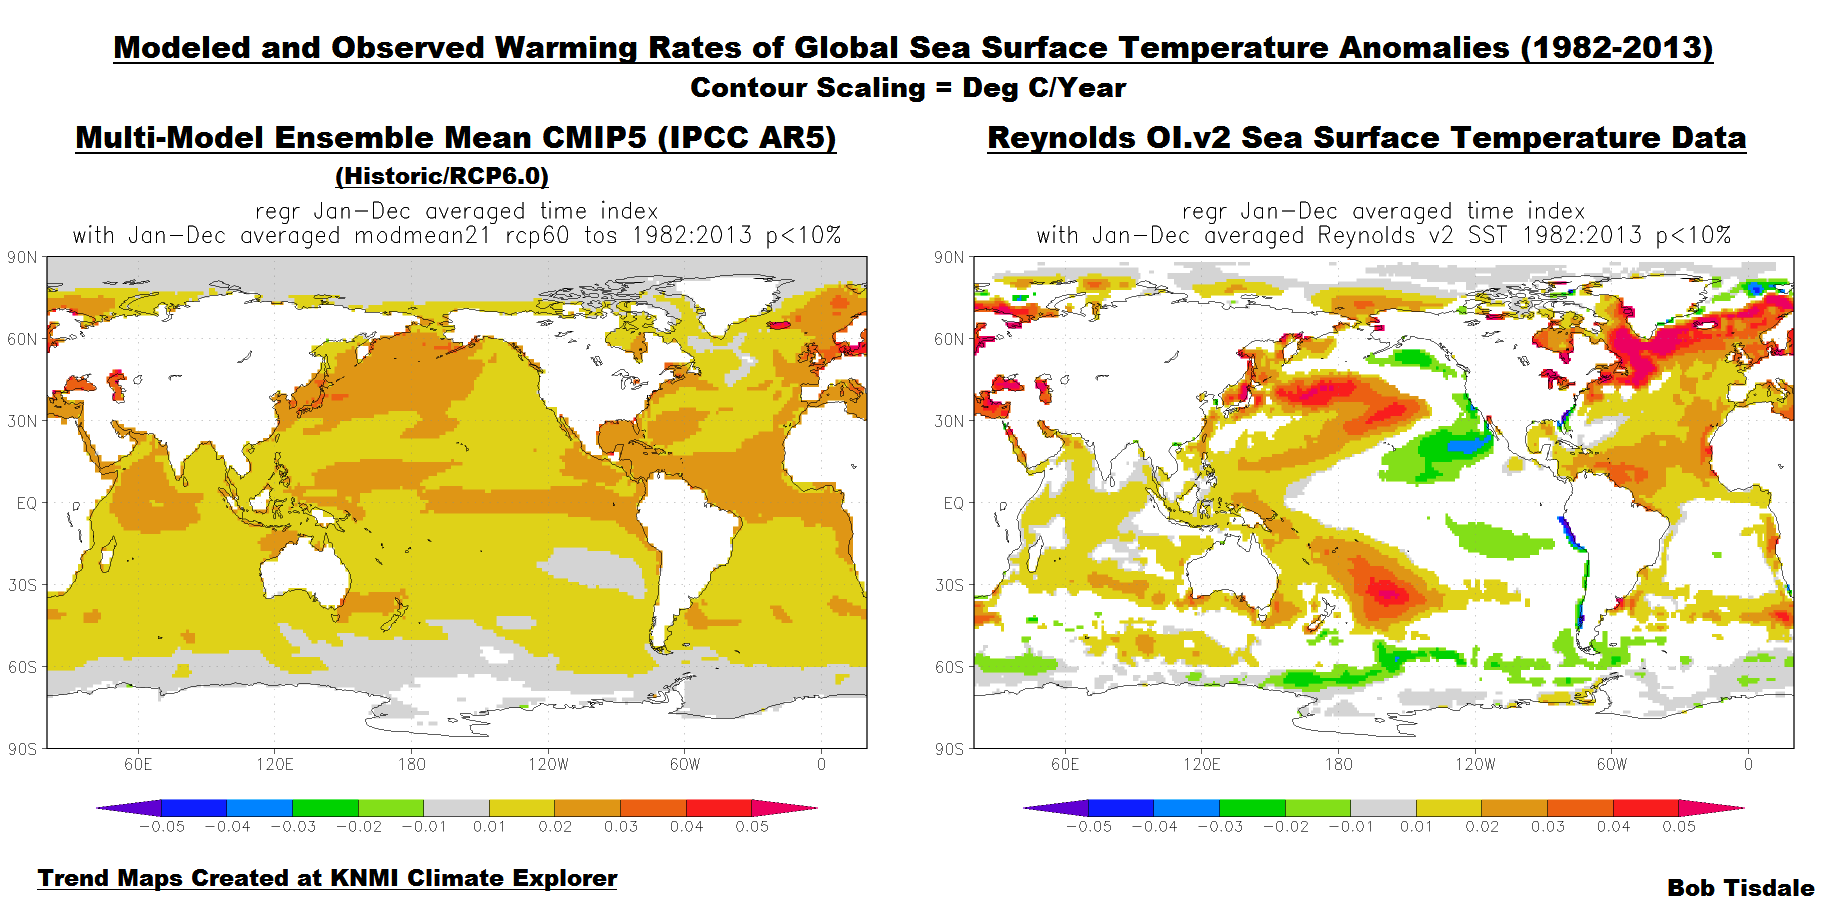
To counter the nonsensical “Just what AGW predicts” rantings of alarmists about the “record-high” global sea surface temperatures in 2014, I’m adding a model-data comparison of satellite-era global sea surface temperatures to the opening of these monthly updates. See the example below. The models are represented the multi-model ensemble-member mean of the climate models stored in the CMIP5 archive, which was used by the IPCC for their 5th Assessment Report. For further information on the use of the model mean, see the post here. For most models, historic forcings run through 2005 (2012 for others) and the middle-of-the-road RCP6.0 forcings are used after those years in this comparison. The data are represented by NOAA’s Optimum Interpolation Sea Surface Temperature data, version 2—a.k.a. Reynolds OI.v2—which is NOAA’s best. The model outputs and data have been shifted so that their trend lines begin at “zero” anomaly for the (November, 1981) start month of this dataset. That “zeroing” helps to highlight how poorly the models simulate the warming of the ocean surfaces…almost doubling the observed warming rate. Both the Reynolds OI.v2 data and the model outputs of their simulations of sea surface temperature (TOS) are available to the public at the KNMI Climate Explorer.
000 – Model-Data Comparison
Linked here is an illustration that compares maps of the simulated and observed warming rates of the global oceans from 1982 to 2013. It is from the post Maybe the IPCC’s Modelers Should Try to Simulate Earth’s Oceans. As soon as the December 2014 data are available, I will update that full-blown model-data comparison post.

[End blog reprint]
The illustration linked in the above paragraph is presented in Figure 1. As shown, the climate models used by the IPCC do not come close to replicating the observed spatial patterns of ocean warming.

Figure 1
Now, every time someone visits my website via a search engine to confirm the record high sea surface temperatures in 2014, they are first going to see that model-data comparison graph, with the pathetic model performance.
THE MODELS FAIL TO SIMULATE THE OBSERVED WARMING SPATIAL PATTERNS – WHY THAT IS IMPORTANT
The spatial patterns of ocean surface warming are one of the primary influences of climate (temperature and precipitation) on land. See the TAMU webpage The Ocean’s Influence on North American Drought.
Also see Ruiz-Barradas, et al. (2013) “The Atlantic Multidecadal Oscillation in Twentieth Century Climate Simulations: Uneven Progress from CMIP3 to CMIP5.” The full paper is here. At the beginning of their “Concluding Remarks” they explain why it’s important for climate models to be able to accurately simulate the Atlantic Multidecadal Oscillation (my boldface):
Decadal variability in the climate system from the AMO is one of the major sources of variability at this temporal scale that climate models must aim to properly incorporate because its surface climate impact on the neighboring continents. This issue has particular relevance for the current effort on decadal climate prediction experiments been analyzed for the IPCC in preparation for the fifth assessment report. The current analysis does not pretend to investigate into the mechanisms behind the generation of the AMO in model simulations, but to provide evidence of improvements, or lack of them, in the portrayal of spatiotemporal features of the AMO from the previous to the current models participating in the IPCC. If climate models do not incorporate the mechanisms associated to the generation of the AMO (or any other source of decadal variability like the PDO) and in turn incorporate or enhance variability at other frequencies, then the models ability to simulate and predict at decadal time scales will be compromised and so the way they transmit this variability to the surface climate affecting human societies.
The only way they could have been clearer would have been to state point blank that climate models will have value only if they are ever able to simulate the decadal and multidecadal characteristics of natural ocean processes. Ruiz-Barradas, et al. (2013) then describe the many problems with climate model simulations of the Atlantic Multidecadal Oscillation. The paper ends with:
The current analysis does not provide evidence on why the models perform in the way they do but suggests that that the spurious increase in high 10–20 year variability from CMIP3 to CMIP5 models may be behind the unsatisfying progress in depicting the spatiotemporal features of the AMO. This problem, coupled with the inability of the models to perturb the regional low-level circulation, the driver of moisture fluxes, seem to be at the center of the poor representation of the hydroclimate impact of the AMO.
In Ruiz-Barradas, et al. (2013), “hydroclimate” appears to mean the variations in precipitation as they relate to drought. They write:
Decadal control of hydroclimate from the AMO over North America and Africa is one of the main reasons to worry about having this phenomenon properly incorporated in climate models. Multi-year, summer and fall droughts over North America and Africa have been observationally linked to decadal SST variability in the Atlantic (e.g., Enfield et al. 2001; Ruiz-Barradas and Nigam 2005; Wang et al. 2006; Zhang and Delworth 2006; McCabe et al. 2008; Shanahan et al. 2009; Kushnir 2010; Nigam et al. 2011).
Some of you may recognize that discussion of Ruiz-Barradas, et al. (2013). It’s from my ebook Climate Models Fail.
Bottom line: Until climate models can simulate the observed warming spatial patterns, and the observed multidecadal variations in sea surface temperatures, they have no hope of being able to simulate climate on continental land masses.
THE WARMING IN THE NORTH PACIFIC IS NOT THE “MISSING HEAT” COMING BACK TO HAUNT US
We’ve already seen comments around the blogosphere to the effect of “high sea surface temperatures in the North Pacific indicate the increase in ocean heat is coming back to haunt us”.
That nonsense is contradicted by data. We only have reasonably complete and reasonably realistic measurements of subsurface ocean temperatures for the past decade or so, all thanks to the ARGO program. The vertically averaged subsurface temperature data from the NODC, Figure 2, for the extratropical North Pacific (20N-65N, 100E-90W), for the depths of 0-700 meters and 0-2000 meters, both show a negative trend, and that means the extratropical North Pacific from the surface to depths of about 1.25 miles have cooled slightly, not warmed, since the ARGO floats have been in place.

Figure 2
Figure 2 is from the “Timmermann and Trenberth” post.
BUT WE HAVE RECORD-HIGH SEA SURFACE TEMPERATURES AND THIS IS NOT AN EL NIÑO YEAR
The recently released El Niño Outlook at JMA contradicts the idea that 2014 is not an El Niño year. The bullet-pointed summary there reads (my boldface):
- El Niño conditions are present in the equatorial Pacific, although the atmospheric conditions does not indicate clear features of El Niño events.
- It is likely that El Niño conditions will continue through winter.
- A weak El Niño event is considered to have persisted since the Northern Hemisphere summer.
Unlike NOAA, JMA uses the NINO3 region (5S-5N, 150W-90W) as their indicator for El Niño conditions this year. They write:
Five-month running mean of the NINO.3 SST deviation was +0.5C or above for four consecutive months from June to September, which means a weak El Niño event has persisted since the Northern Hemisphere summer.
Also, the December 10, 2014 update from JMA comes 6 days after the blog post Did ENSO and the “Monster” Kelvin Wave Contribute to the Record High Global Sea Surface Temperatures in 2014? In that blog post, we illustrated a basic reality this year. While the El Niño conditions barely surfaced until recently in the NOAA-preferred NINO3.4 region (5S-5N, 170W-120W), the sea surface temperatures of the tropical Pacific as a whole indicate a moderate El Niño has been taking place this year.
BUT CLIMATE SCIENTISTS HAVE FOUND THE MISSING HEAT IN THE SOUTHERN HEMISPHERE OCEANS
I added a caption to the model-data comparison that is sure to get responses from some people. It reads:
Climate models almost double the observed warming rate of the global ocean surfaces. Climate scientists are still looking for about 50% of the heat that is supposed to be stored in the oceans. The “missing heat” and the doubling of ocean-surface warming suggest the model sensitivities are at least two-times too high.
I expect that the true-blue believers in human-induced global warming will, in response, cite the recent paper Durack et al (2014) Quantifying Underestimates of Long-Term Upper-Ocean Warming. A preprint copy of the full paper is here, and the supporting online material is here. That paper was discussed at WUWT here. And the lead author’s webpage here includes some pretty graphics.
The abstract of Durack et al (2014) begins (my boldface):
The global ocean stores more than 90% of the heat associated with observed greenhouse‐gas‐attributed global warming (Levitus et al., 2005; Church et al., 2011; Otto et al., 2013; Rhein et al., 2013). Using satellite altimetry observations and a large suite of climate models, we conclude that observed estimates of 0‐700 dbar global ocean warming since 1970 are likely biased low. This underestimation is attributed to poor sampling of the Southern Hemisphere, and limitations of the analysis methods that conservatively estimate temperature changes in data‐sparse regions (Gregory et al., 2004; Gouretski & Koltermann, 2007; Gille, 2008).
The statement “observed greenhouse‐gas‐attributed global warming” is nothing more than a clever regurgitation of climate science fallacy. Warming of the oceans to depth has been observed, but climate models are used to attribute the warming to greenhouse gases. Unfortunately for the climate-science community, it is well known that climate models cannot simulate naturally occurring coupled ocean-atmosphere processes that can cause ocean heat uptake over multiyear and multidecadal periods. We’ve been presenting and discussing that for many years. Most recently, see the discussion under the heading of “There Are Naturally Occurring Processes That Can Cause the Long-Term Warming of the Oceans to Depth” in the recent post Arguments For and Against Human-Induced Ocean Warming.
The next bold-face portion of the abstract is “Using satellite altimetry observations and a large suite of climate models…”. We only have to look at the model-data comparison graph of global sea surface temperatures and the maps of observed and modeled warming rates from 1982 to 2013 presented early in this post to know that climate model simulations of ocean processes are fatally flawed.
The final bold-faced portion reads “This underestimation is attributed to poor sampling of the Southern Hemisphere…”. There should be no doubt the temperatures and salinity of the Southern Hemisphere oceans to depth are poorly sampled. Even the IPCC is very clear about this. (See the post AMAZING: The IPCC May Have Provided Realistic Presentations of Ocean Heat Content Source Data.) But the authors of Durack et al (2014) are conveniently overlooking a few other things.
First, climate models are biased toward the Northern Hemisphere in an attempt to have them better simulate the loss of sea ice in the Arctic (See Swanson (2013) “Emerging Selection Bias in Large-scale Climate Change Simulations.”), but climate models still do a poor job of simulating the loss of Arctic sea ice (See Stroeve, et al. (2012) “Trends in Arctic sea ice extent from CMIP5, CMIP3 and Observations” [paywalled]).
Second, because of the models are biased toward the Northern Hemisphere in an attempt to recreate the higher warming rates there, the climate models almost triple the observed warming rate of the surfaces of the Southern Hemisphere oceans. See Figure 3.

Figure 3
If climate models can’t come close to simulating the observed warming rates and patterns of the ocean surfaces, where the ocean-atmosphere processes are better understood, then climate models lack any credible foundation in their attempts to simulate the ocean heat uptake to ocean depths. In terms that are more basic, if the models cannot properly simulate the processes that cause the warming of ocean surfaces, it is extremely naive to assume the models would then be able to simulate ocean warming to depth.
CLOSING
For nearly six years, we’ve discussed how weather events can lead to long-term warming of the oceans—at the surface and at depth. The unusual warming in the extratropical North Pacific is just another example.
Hopefully, the above will provide you with enough basic support material to help you counter the alarmist nonsense that is sure to come in the near future.
Patrick B, it appears the CMIP archives are updated for the IPCC reports. The criteria for the CMIP6 archive was recently established:
http://www.wcrp-climate.org/wgcm-cmip/wgcm-cmip6
Bob, please riddle me this?
When I see alarmists talk about the warming oceans they always spew forth as if the entirety of the oceans have been measured to have temperatures increasing.
Yet in reality the sea surface temperature data shows ocean warming to be regional at best.
Which raises another alarmist’s purposeful misrepresentation in asserting the MWP was a regional event.
Doesn’t our current and recent sea surface temperature data provide more evidence that our Modern Warm Period is in fact regional?
Isn’t their more overall evidence for a regional MWP than there is for our Modern period?
‘Yet in reality the sea surface temperature data shows ocean warming to be regional at best.’
But you see this is special ‘science’ that cannot be judge by normal standards, so regional is good enough to cover the whole planet when it comes to supporting AGW , but no where there enough when it comes to refuting AGW.
For example Mann’s ‘stick’ is very regional , while the evidenced for a MWP as a far wider geographical spread . But its the ‘stick’ which the alarmist claim is good enough to cover the world.
Steve Oregon, it has always been my view that sea surface temperature warming is regional, a result of coupled ocean-atmosphere processes.
I think Willis’ article on buoy temperature data is a microcosm of what has/is being done to buoy data worldwide.
Call it homogenization or just plain adjustments, how can you trust the government data?
Bob, how much faith do you have in the data you use for your graphs? They got rid of the MWP and the record heat in the 30’s. How can you trust the ocean buoy data as being accurate?
Forgot to link to Willis’ article:
http://wattsupwiththat.com/2014/11/28/buoy-temperatures-first-cut/
The models smear out temperatures, as you would expect a more generalized expectation. However, what I see of importance is that the actual world holds cooling as well as more contrast. The strong regionality is clear. A globally equal forcing somehow is being negated in some areas while being focused in others. This is what I would expect with redistribution, i.e. changes in how the world is taking energy from certain places and putting it elsewhere. If the planet were simply passive, you would expect a strengthening of the existing systems.
Of course, this is the problem with arguing with warmists. For them, today is “special”. All history is irrelevant. Planetary physics in the “anthropocene” is special, also. Everything that happens HAS to be viewed as an exception to experience by definition. Which is why you cannot win by reference to basic knowledge or historical records.
the difference between the MEAN of the models and observations is a wrong headed comparison.
Models need to face the observation Mano v Mano. Lumping models together as the IPCC does just
creates a model of models. That’s wrong headed if what you want to do is evaluate a model.
Further the difference between the mean of the models and the observations DOES NOT mean that the
models are twice as sensitive as they need to be. Models range in sensitivity from about 2.1 to 4.4 ECS
So, its silly for the IPCC to combine models into a model of models. And you cant reject a GIVEN model by looking at the difference between the mean of all models and observations.
Put another way, All you’ve done is reject the model of models.. which we know was silly to begin with.
Yes I know they did it first, but grow up.
Comparing the mean of models to observations, doesnt tell you WHICH models are better and which are worse.. iit just tells you that averaging models give you the wrong answer
Hello Steven I think I understand what you are saying. First by “Lumping the models together” you also average problems with each model. This clouds the issue of determining the most accurate model. I am not one who is against models by temperment. As a machinist I have programed and run CNC machining centers, (mostly I rely on “professional programers) A CNC program is similiar to a model in a simple fashion. I would not toss a CNC program because it needs to be tweaked. You have asked for constructive suggestions. At this point I can only offer encouragement. irreguardless of who is right or who is wrong it really would be nice to have climate models that we can use. I can tell you now if the planet really is cooling (I think it is) we will need them.
michael
Three Loonies in an asylum:
Loony A says, “I’m a hat stand,”.
Loony B says, “I’m a hat stand and so am I,”.
Loony C says, “I’m six hat stands,”
So how many hat stands do we have?
Climatologist answer: 1 + 2 + 6… all divided by 3 = We have 3 hat stands.
Correct answer = Don’t be a loony.
(GIGO)
I have 6 car factories;
1 makes cars without wheels
1 makes cars without motors
1 makes cars without interiors
1 makes cars without gearboxes
1 makes cars without glasswork
1 makes cars without doors, bonnets and boot lids
But on average, they make good cars.
Well said. Also, as the models make projections rather than predictions and as it is predictions that are required for the control of a system, global warming is not controllable on the basis of these models. These models are, however, the basis for governmental attempts at controlling global warming.
Terry, if you step on the brake pedal in your car, is what happens next at all contingent on whether you project or predict the car will slow down?
Mosher said…”Comparing the mean of models to observations, doesnt tell you WHICH models are better and which are worse.. iit just tells you that averaging models give you the wrong answer”
==============================================================
Gads Mosher! It tells you far more then that! The IPCC climate models are VERY informative because they all run wrong in the SAME direction, to warm. And that my friend does indicate that they over estimate the climate sensitivity to CO2.
Taking the modeled mean of a bunch of predictions which all run wrong in the same direction, is a blunder of the highest order if [your] objective is to improve your models to reality. On the other hand, if [your] objective is to write as many papers as possible depicting catastrophic harm from warming, then you will produce an over sensitive modeled mean and expect government funded scientist to attribute terrible harm based on the failed multi model mean.
The energy radiated by the earth to match energy received from the sun is emitted at about 5km altitude and has a blackbody temperature of -18 degrees centigrade. Assuming a lapse rate of 6.4 degrees/km this corresponds to a surface temperature of 15 degrees centigrade.
What is the problem and who needs a greenhouse effect?
You have to watch the pea and the thimble with climate science. Every description of the GHE implies that the black body temperature and the earth surface temperature should be the same. Then the rabbit from the hat is the back radiation which explains why they are different. This back radiation is then the basis of the GH effect and the 33 degrees or whatever becomes the magnitude of the warming ability of the GHE.
When you realise that the black body radiation actually occurs high in the atmosphere, then the two different temperatures are what you would expect. They are a consequence of the lapse rate. The need for back radiation as an explanation disappears and with it the climate controlling nature of the GHG effect.
Rob Painting – ” So it will be interesting to see who is right, the mainstream oceanographic community, or random dudes on the internet.” Ah – the ‘appeal to authority’ get out of jail card. Rob, for this card to work your ‘authorities’ have to actually have a record of getting it right and the ‘Random dudes’ it wrong. Let’s see who the actual authority is on historical form of getting it right. Shall we start at the top with Prof. Peter Wadhams perhaps? Oh. The ice free arctic prediction seems to have failed. He’s trying for a postponement. ;-/. We can go on… for a long time. Jimbo could provide a very long list. Let’s face it, on present form you’re better off with using Paris Hilton as your ‘authority’, let alone ‘random dudes’ like Bob Tisdale who seems to get a lot closer to right. I’d avoid appealing to that set of authorities until they improve their record a lot, to at least the same as the ‘random dudes’.
Dave – focus on the topic at hand. You can chant slogans about Wadhams later. This is about the ocean circulation and the way it affects ocean heat uptake and sea surface temperatures.
Bob doesn’t have any idea why the sea surface is warming so rapidly. Bob had no idea why the deep ocean warmed so much in the period since around 2000 – a period in which the IPO was in a negative phase. The scientific community, on the other hand, has researched the underlying mechanisms of this wind-driven ocean circulation for over a century now – see Ekman (1905) for example. The spatial patterns in sea surface temperature and sea surface height, characteristic of the positive and negative phases of the IPO, are simply the outcome of underlying physical phenomena.
For example; when the trade winds strengthen they drag more water mass westward across the Pacific Ocean because the Coriolis force is zero at the equator and negligible just either side of it. Rather than the net transport of water being deflected at right angles to the wind, as elsewhere on Earth, the friction of the wind on the surface layers drags water parallel to the equator – where it piles up against the ‘maritime continent’. So we get this build-up of warm water in the western tropical Pacific which raises sea level anomalously there. It also results in a stronger flow through the Indonesian Archipelago and along the western boundary currents.
Once the trade winds and midlatitude westerlies undergo weakening heading into the positive phase of the IPO that water mass in the western tropical Pacific will be siphoned away as it falls under the influence of gravity. So what we’d expect to see is a fall in rates of sea level rise in the western tropical pacific, Indonesian Throughflow, and along the western boundary currents. Conversely, the small rates of sea level rise along the eastern Pacific will increase as the weaker trade winds allow the water mass, siphoned away from the west, to build up there. The post by ‘Steve Goddard’ about falling sea level near the Philippines would be consistent with this. It would be worthwhile checking recent sea level trends in adjacent areas of the western Pacific basin, to see how widespread this is.
As for Bob’s theory, well near as I can make out, it doesn’t provide any insight as to why the sea surface temperatures are warming so much, nor all the spatial changes in sea surface temperature and sea surface height. It’s more than a bit problematic. So it’s not an appeal to authority, but an appeal to evidence.
Rob Painting, I didn’t realize you were still hanging around, spreading misinformation and exposing your misunderstandings. .
You wrote: “Bob doesn’t have any idea why the sea surface is warming so rapidly.”
Actually, my post that follows is quite comprehensive, Rob. Most people here understood it. Why can’t you? I’ve also discussed it on numerous threads, Rob.
https://bobtisdale.wordpress.com/2014/08/16/on-the-recent-record-high-global-sea-surface-temperatures-the-wheres-and-whys/
Rob Painting says, “Bob had no idea why the deep ocean warmed so much in the period since around 2000 – a period in which the IPO was in a negative phase…”
Have you seen this graph, Rob? It’s data direct from the NODC website:
According to the studies you’re thinking about, the Pacific should be warming in response to the negative IPO. Guess what? No warming in the Pacific to depths of 2000 meters in the ARGO era.
You have a nice day, now, Rob.
Rob Painting – My bet is on the random dudes. If climate sensitivity terms used in the IPCC models were cut by half, the climate science and mainstream oceanographic communities might be able to compete. The over-estimate of climate sensitivity (effectively lumping all the forcing estimates, known and unknown) is the root cause of the increasing discrepancy between the widely touted model projections/predictions/forecasts and observed reality. Of course, if they do this, the case for the anthropogenic source of global warming vanishes (as does their funding).
Either way, time is making the dissonance between alarmism and reality more obvious, even to laymen. Interestingly, the rhetoric from the CAGW community is becoming more hysterical on a daily basis, suggesting they sense the rapid loss of credibility. Hopefully, this will accelerate the demise of their agenda. The sooner the better, so the world can get back to common sense and economic growth again.
Is climate sensitivity overestimated? I don’t know about that. Climate models are able to simulate hiatus decades and the climate sensitivity emergent in those models is around 3 degrees. I expect the positive phase of the IPO, whenever it arrives, will be a stern test of recent energy balance-type estimates.
Rob says…”I expect the positive phase of the IPO, whenever it arrives, will be a stern test of recent energy balance-type estimates”
========================================
Well Rob, for most of the time since the cool late 1970s time frame, (.post the ice age scare) we were in positive ESNO conditions. Therefore the models are still out of sync with the natural system. By out of sync, I mean the negative phase of the PDO and the AMO have considerable time left to balance out the warm phase.
Natural variability has dominated on the warm side still, with more potential in the next two decades for cooling. All of the time when ocean cycles enhanced warming, you (alarmist in general) igored them for the most part, and ALWAYS in public press releases. Now that warming has at least paused, you run to natural causes.
So along about 2035 we will have one reasonably complete cycle of positive and negative ocean cycles. In the mean time climate sensitivity looks to be far less then the modeled mean indicates, and the benefits of CO2 are ever manifesting in producing more food on less water and land requirements, and the projected harms are failing to materialize, like the predicted warming, like the hot spot. The theory of CAGW is simply wrong according to the observations.
Rob Painting – I am going to cheat and respond with a succinct statement (with which I agree) made in the comments on Bob Irvine’s Guest Post of April 5, 2013 “A Comparison Of The Earth’s Climate Sensitivity To Changes In The Nature Of The Initial Forcing” with all due credit to Bill Illis:
Bill Illis April 6, 2013 at 5:49 am
“The whole 3.0C per doubling proposition is based on the feedbacks (and if fact, how they multiply out and produce feedbacks on the initial feedbacks and then accumulate).
The values that are used for the feedbacks are carefully tuned to arrive at the 3.0C per doubling proposition (and to remain at the 3.0C which was guessed at in the beginning of the science before the feedback values and the forcing calculations for GHGs were finally sorted out – the science was not even sorted out before 3.0C per doubling was decided on).
For example, here are the IPCC feedback values:
Initial Doubled GHGs – +4.2 W/m2 –> +1.12C
Water Vapor Feedback -> +1.75 W/m2/K
Cloud Albedo Feedback -> +0.75 W/m2/K
Other Feedbacks -> -0.05W/m2/K
Total increase from Feedbacks (and feedbacks on feedbacks) -> +7.46 W/m2 –> +1.98C
Total Increase –> +3.05C per doubling
———————————————–
Let’s double the feedback values to:
Water Vapor Feedback -> +3.5 W/m2/K
Cloud Albedo Feedback -> +1.5 W/m2/K
Total increase from Feedbacks (and feedbacks on feedbacks) -> +242.1 W/m2 –> +48.1C
Total Increase –> +49.2C per doubling
———————————————–
Let’s cut the feedback values in half:
Water Vapor Feedback -> +0.875 W/m2/K
Cloud Albedo Feedback -> +0.375 W/m2/K
Total increase from Feedbacks (and feedbacks on feedbacks) -> +1.94 W/m2 –> +0.50C
Total Increase –> +1.6C per doubling
———————————————
Let’s just reverse the sign of the cloud feedback:
Water Vapor Feedback -> +1.75 W/m2/K
Clouds Albedo Feedback -> -0.75 W/m2/K
Total increase from Feedbacks (and feedbacks on feedbacks) -> +1.40 W/m2 –> +0.37C
Total Increase –> +1.48C per doubling
———————————————
The cloud feedback value is a make or break for this theory. We have no idea what it really is or whether it really has a positive sign or a negative sign. And even more so, the water vapor feedback is a make or break. At least it is based on another theory Classius Clapeyron, but so far this value looks to overstated by almost double.
There is room within this theory to examine at least the feedbacks (if not the temperature change from doubled CO2 itself). As this post does, we need to use empiricial data to see what is really correct.”
Luke December 14, 2014 at 10:43 am
I suggest that there is abundant empirical evidence that the cause of the warming is an increase in GHGs from the burning of fossil fuels.
—————————————-
Luke, if there is abundant empirical evidence as you “suggest” for the cause of the warming being an increase in GHGs from the burning of fossil fuels, why don’t you just post it?
Could you please post it – top two or three bullet points, or more detail. Whichever you prefer ?
I just wander why they don’t use the big headlines when it sometimes is a bit colder than the year before.
We are told it should constantly be warmer, so that is in a way “normal”, and then a cold year should really be alarming.
The article’s phrase “AGW PREDICTS” draws a conclusion from an equivocation on the polysemic term “predict.” To draw such a conclusion is an equivocation fallacy (http://wmbriggs.com/blog/?p=7923),
What people like Rob Painting forget is that it was those “random guys” who gave us things like aeroplanes, electricity, computers, submarines, jet engines, etc, etc.
Can someone explain how monthly adjustments that go back many years are justified? Remember how NOAA as recently as September said that 2010 was the record hot year? Well, it no longer is – it has been adjusted down and now equals 2005. Here are the 2014 monthly anomaly series I downloaded from NOAA: in September and November:
Sep – 0.64,0.68,0.79,0.77,0.71,0.68,0.67,0.60,0.52,0.58,0.74,0.44
Nov – 0.60,0.60,0.77,0.76,0.69,0.68,0.66,0.60,0.50,0.54,0.69,0.37
What could have possibly happened during two months of 2014 to make 2010 so much colder than before?
Reblogged this on Centinel2012 and commented:
NASA and NOAA have no creditability when it comes to publishing data and studies the data is compromised and so any results that this data shows has no meaning.
The ONLY reason CAGW alarmists keep high-end model projections (ECS greater than 4C) in the model ensemble is to keep the ECS mean well above 2C.
If business as usual (BAU) ECS model mean projections are even close to 2C, political hacks have a very difficult task convincing taxpayers to waste $10’s of trillions on CO2 sequestration measures to keep global warming below 2C, when no money can be spent, no cuts in CO2 are required, and actual ECS is actually below 2C and perhaps as low as 0.5C…
The logical and scientific response to wildly inaccurate high-end model projections is to delete them entirely from the CAGW model ensemble, but because of the political reasons explained, this cannot currently be accomplished.
The CAGW hypothesis has already become a scientific embarrassment. More and more scientists outside (and even in climatology) realize CAGW is, for all intents and purposes, a disconfirmed hypothesis, however, because of the $billions in CAGW grant funds at stake, skeptical scientists are still reluctant to speak out for fear of reprisals.
Since the CAGW movement is already in its 26th year (from Hansen’s 1988 Congressional testimony), a growing number of retiring scientists are belatedly expressing their CAGW skepticism. This phenomenon will only gain momentum as more and more scientists retire and global temp trends continue to remain flat/falling/static/marginally increasing.
Also, ECS does not exist as a scientific concept in view of the absence of falsifiability of its numerical value.
Exactly which is why Samurai gave the correct POLITICAL reason for the high climate sensitivity.
Bob do you have for the graphics that you have done for RCP 6 for RCP 8.5 Our Parliamentary Commissioner for the Environment has a report out and they use 8.5 and I am trying to respond to it and while I could use 6 it would be better to use 8.5 If you have them could you email to hearlek@eol.co.nz
What a wonderful collection of highly relevant references. It is a treasure trove.
Why do we always see linear projections? A junior assistant trainees mate in signal processing would tell you that you do a best fit curve based on the average several different periods as the likely trend as the simplest acceptable method, assuming no sudden random disruptions.
When considering what AGW predicts, one should also consider Ferenc Miskolczi recent paper on The Greenhouse Effect and the Infrared Radiative Structure of the Earth’s Atmosphere, published in Developments in Earth Science Volume 2, 2014..
I believe that the paper can be downloaded at: http://www.seipub.org/DES/Download.aspx?ID=21810
I guess that we are all waiting to see an increase in DWLWIR as predicted by the AGW theory, and if there is some increase good quality and convincing data that links that increase with a warming of the atmosphere and the oceans.
Further to my last post, perhaps I should have remarked that there are data issues with the data relied upon by Miskolczi. However, that is a common theme throughout all of climate science. All the data has issues, and i guess one has to work with the best of a bad bunch, but make it clear that one is working with crap, and as a consequence attach realistic error bands to what is shown, or claimed to be shown.
The reason cAGW still persists is a consequence of the crappy quality data that we have, much is being overstretched well beyond its design specification, and yet scientists fail to set out out realistic error bands which are an integral consequence of poor quality data.
Good on yer, Bob! Another brilliant post – thanks so much!
Why are people worried about ‘ocean’ warming?