Slides from the Michael Mann lecture at Cabot Institute in Bristol

| UPDATE: The slide originals have been found and posted. See link below. It’s identical to Mike’s AGU trick| As promised earlier this week, I’ve gotten my phone connected and have offloaded all of the photos of Dr. Mann’s slide presentation that I took from my vantage point in the front row. I’ve created a gallery of images with some notes about each. As you can see, it is heavy on politics and light on science. The final slide of his lecture, which depicts his daughter and a polar bear where he talks about “children and our future”, I pixelated out to make it unrecognizable as I don’t think children should be used as props.

I think I got most every slide in his presentation, but there may be one or two missing, as I had issues trying to operate the camera and keeping my hearing assistance device functional (I had to hold it at arms length to get a signal, and put it down to get a photo). Slides go from upper left to right, and are in order. Click the first one and you’ll get a slide show applet in a  new window.

I’ll have some commentary about the Q&A session and why I didn’t ask a question, along with some additional photos, a bit later in a separate post.


UPDATE: A PDF of all the slide originals presented in Mann’s Rutgers presentation was released by Mann on the Penn State web page here: http://www.meteo.psu.edu/holocene/public_html/Misc/HSCW_Rutgers_Sep12.pdf

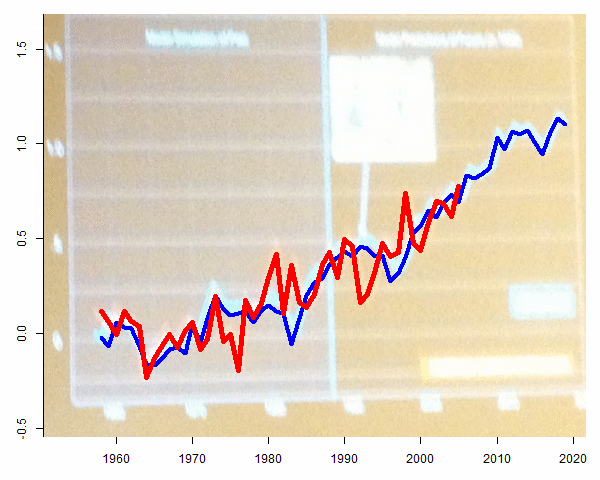
These were the slides used in a September 2012 presentation at Rutgers, which were the subject of Steve McIntyre’s breakdown of the presentation Mann gave to AGU in December 2012 which he called “Mike’s AGU Trick“. At issue was the staleness of temperature data presented which completely eliminates any hint of “the pause”, as seen below.  Mann’s talk in Bristol was the virtually identical set of slides. He hasn’t updated them with anything of significance in 2 years, except for some news headline articles about severe weather events. The data truncated at 2005 has not changed. (h/t to Jean S.)

Excerpt from “Mike’s AGU Trick“:

======================================

There were two components to Mann’s AGU trick. First, as in Mann and Kump, Mann compared model projections for land-and-ocean to observations for land-only. In addition, like Santer et al 2008, Mann failed to incorporate up-to-date data for his comparison. The staleness of Mann’s temperature data in his AGU presentation was really quite remarkable: the temperature data in Mann’s presentation (December 2012) ended in 2005! Obviously, in the past (notably MBH98 and MBH99), Mann used the most recent (even monthly data) when it was to his advantage. So the failure to use up-to-date data in his AGU presentation is really quite conspicuous.

Had Mann shown a comparison of Hansen’s Scenario B to up-to-date Land-and-Ocean observational data, the discrepancy would have been evident to the AGU audience, as shown in the loop below.

mann-agu-loop-loti

Update: As reader DGH observed in a comment below, Mann’s presentation at Rutgers also employed Mann’s AGU Trick to hide the divergence between Hansen Scenario B and observed temperature, not showing data after 2005. As noted above, not using up-to-date data in virtually identical circumstances was characterized by Pierrehumbert as “ugly” and “illegitimate”:

hansen1988-rutgers

Figure ^. Excerpt from Mann’s September 2012 presentation at Rutgers.

As reader ZT pointed out, Mann also used his AGU Trick to hide the divergence in his TEDx talk

here.

======================================

0 0 votes
Article Rating
187 Comments
Oldest
Newest Most Voted
Inline Feedbacks
View all comments
September 27, 2014 11:39 am

Thanks Anthony – no wonder he panicked and escaped 10 minutes early, knowing you had him “bang to rights” !

ConfusedPhoton
September 27, 2014 11:42 am

What else would one expect from someone who pretends to be a Nobel Laureate! Science, wot science!
Mann looking at irrelevance in the face!

September 27, 2014 11:55 am

Amazing actually! Their boat is swamped with irrefutable observational data which contradicts basically all of their predictions and computer models from the past 20 years. But it seems that Captain Mann plans to go down with the ship.

Rud Istvan
September 27, 2014 12:10 pm

It looks like his Hansen 1988 prediction to temp charts ised the same trick he used at Rutgers and at AGU 2012. McIntyre called him on it then. Hard to be certain given image quality, but looks just like the Rutgers slide, even the black background. Land only temps from GISS rather than land plus sea, truncated at 2005 to hide the pause. In fall 2012, Hansen had GISS land plus sea temps available through mid 2012.

Jean S
Reply to  Rud Istvan
September 27, 2014 1:13 pm

Yes, it definitely is mike’s AGU trick.
Is he really getting something like $10k for these reruns? Seems like the talk was pretty much the same as here: https://www.youtube.com/watch?v=9CKNHpVUJKk

September 27, 2014 12:35 pm

I’m surprised you were able to get permission to reproduce the slides.

rabbit
Reply to  Anthony Watts
September 27, 2014 7:08 pm

Generally speaking, you should NOT assume you have the right to reproduce displayed slides, any more than you should assume you can video a movie in a theatre.

Reply to  Anthony Watts
September 27, 2014 7:18 pm

rabbit, this is not a movie theater.
The first question I would ask is: who pays the freight? It seems that Mann has been riding the taxpayer gravy train for a long time. He doesn’t work for a private corporation.
As a taxpayer, I expect to have access to his work product.
Otherwise, I want a refund.

rabbit
Reply to  Anthony Watts
September 27, 2014 8:07 pm

dbstealey:
Just telling you the law. Both a presentation and a film are covered by copyright. Just because someone gives a public showing doesn’t mean they are ceding the right to reproduce.
And your argument about “who pays the freight” doesn’t hold up in law. Both professors and universities are allowed to hold copyright, even when funded on the public dime.

Reply to  Anthony Watts
September 27, 2014 9:03 pm

rabbit,
Are you a lawyer? If so, what’s your opinion on fair use? Where is the line drawn? These slides were just a small part of the presentation. Mann’s presentation was not recorded.
Of course, if you’re not a lawyer…

rabbit
Reply to  Anthony Watts
September 27, 2014 10:27 pm

dbstealey:
Reproducing 80 or more slides likely goes far beyond fair use.
And no, I’m not a lawyer, but that does not stop someone from knowing something of the law, just as you don’t need a degree in climatology to know something about climate. I was an R&D manager for many years, and it was part of my job to understand the basics of intellectual property law. People have been stopped from photographing my presentations due to copyright violation (don’t blame me, I wasn’t the one doing the stopping).
Nor am I claiming I am definitely right in this matter — only a judge can decide that — but I think it would almost certainly raise concerns with lawyers.
I know why you’re putting up these arguments. You don’t like the idea that Watts may have pulled a no-no. Neither do I.

Reply to  Anthony Watts
September 28, 2014 12:32 am

rabbit says:
You don’t like the idea that Watts may have pulled a no-no. Neither do I.
Who said I think it was a ‘no-no’? I don’t. I’m fine with it. If showing slides that were a small part of a presentation isn’t fair use, what is? Mann didn’t complain, and clearly he expected it. He never said not to post anything, he even said he expected pics of his daughter to be used.
You don’t like it. I get that. The tone of your comments is hard to miss.

mrpeteraustin
Reply to  Anthony Watts
September 28, 2014 4:26 am

@rabbit:
Here’s the advice from the UK Intellectual Property Office. This article is non-commercial research, it was necessary to use the amount that was taken, and the work reproduced is supported by a sufficient acknowledgment.
Although the extract seems quite long, a shorter extract would not have achieved the objective of demonstrating the content of this lecture fairly. And the slides are only a small part of Dr Mann’s performance. So I don’t see the problem.
“You are allowed to take short extracts of works when the use is for research that you do not make any money from or for private study, for educational courses or even for use in connection with a hobby. Such use is only permitted when it is ‘fair dealing’ (discussed below).
The purpose of this exception is to provide students and non-commercial researchers more access to copyright works. In assessing whether your use of the work is permitted or not you must assess if there is any financial impact on the copyright owner because of your use. Where the impact is not significant, the use may be acceptable.
If your use is for non-commercial research you must ensure that the work you reproduce is supported by a sufficient acknowledgment.”
http://www.ipo.gov.uk/types/copy/c-other/c-exception/c-exception-research.htm
“Factors that have been identified by the courts as relevant in determining whether a particular dealing with a work is fair include:
* Does using the work affect the market for the original work? If a use of a work acts as a substitute for it, causing the owner to lose revenue, then it is not likely to be fair.
* Is the amount of the work taken reasonable and appropriate? Was it necessary to use the amount that was taken? Usually only part of a work may be used.”
http://www.ipo.gov.uk/types/copy/c-other/c-exception/c-exception-review/c-exception-fairdealing.htm

E.M.Smith
Editor
Reply to  Anthony Watts
September 28, 2014 4:38 am

There is a specific educational exception in copyright. If this blog is anything, it is educational.

beng
Reply to  Anthony Watts
September 28, 2014 5:25 am

Concern troll alert.

rabbit
Reply to  Anthony Watts
September 28, 2014 12:14 pm

Beng:
Screw off, okay? There are very real legal issues here, and one should be able to bring them up with some moron screaming “Concern troll”.

ralfellis
Reply to  Anthony Watts
September 28, 2014 12:53 pm

If the slides and presentation were developed and assembled using government money, it is highly unlikely that the individual could claim copyright. It becomes public property, and public knowledge. If anyone should be interested in charging a fee, it is the US government, not Mann.
Ralph

rabbit
Reply to  Anthony Watts
September 28, 2014 5:18 pm

Ralfellis::
Nice theory, but it doesn’t work that way. Here’s a link…
Statement on Copyright
To quote..
it has been the prevailing academic practice to treat the faculty member as the copyright owner of works that are created independently and at the faculty member’s own initiative for traditional academic purposes. Examples include class notes and syllabi; books and articles; works of fiction and nonfiction; poems and dramatic works; musical and choreographic works; pictorial, graphic, and sculptural works; and educational software, commonly known as “courseware.”

Rob Dawg
September 27, 2014 12:53 pm

Mann’s last slide -picture of his daughter and a polar bear at the zoo. I’ve pixelated it because I don’t think children should be used as props.
If Mann is using his daughter as a prop then the issue is settled no? I too agree with the sentiment but rather than downplay the correct thing is to throw a spotlight on the practice of cute polar bears and “for the children.”
I wish it would not come to this but letting it slide is only going to encourage more.

Colin
Reply to  Rob Dawg
September 27, 2014 1:34 pm

Nicholas Stern pulled the same emotional trick of bringing his wife and baby on stage at the end of his TED talk. But then it was TED….
https://www.ted.com/talks/lord_nicholas_stern_the_state_of_the_climate_and_what_we_might_do_about_it?language=en

Reply to  Colin
September 27, 2014 4:38 pm

I wonder if they get this maudlin with disappointing weather forecasts. Do they bring out the wives and children? Do they say, Look how the lousy forecast affected them? /sarc

PaulH
September 27, 2014 12:55 pm

I think I would have lost my lunch if I had to sit through all of that.
They actually had a slide sequence “Why no action?” ? Seriously? The $100 billion+ spent (wasted) on this nonsense counts as “no action”? These are strange times indeed.

PhilCP
Reply to  PaulH
September 27, 2014 3:22 pm

Actually, it IS nothing compared to the countless trillions they actually WANT us to spend

Data Soong
September 27, 2014 12:55 pm

What a pathetic presentation, especially from someone who is a scientist. That malarkey isn’t going to convince anyone … though alarmists probably lapped it up, like they always do.

Jay Hope
Reply to  Data Soong
September 27, 2014 2:36 pm

Sadly, what you say is probably right!

AnonyMoose
September 27, 2014 1:01 pm

Readers, click on any picture to activate slide show.

Joe Prins
September 27, 2014 1:04 pm

How many carbon credits did Mann buy to offset this incredibly boring, childish presentation? If this passes for a scholarly presentation, then I must be getting old.

knr
September 27, 2014 1:10 pm

Has for the picture of Mann’s daughter , while with him has a dad, can you image having to grow up dealing with that massive ego and a tendency to see conspricy everywhere , she already has enough problems , so no need to show her.

September 27, 2014 1:12 pm

Seems like he may be using an image of “Monks” coffee shop in Seinfeld (Toms in reality). Did he pay a royalty or at least get rights?

mrpeteraustin
Reply to  lemon
September 28, 2014 4:45 am

@lemon: You don’t need permission to take photographs in public in the USA, nor to use a photograph or a trademark in commentary in the UK. Otherwise most TV news would infringe one or the other. There’s an excellent blog about the former: http://photographyisnotacrime.com/

RockyRoad
September 27, 2014 1:20 pm

Mann is a circus barker. He’s no more a scientist than your typical bare-back performer. What a disgrace!

Dr Burns
September 27, 2014 1:31 pm

“You can fool all the people some of the time, and some of the people all the time, but you cannot fool all the people all the time.”
– Abraham Lincoln (Probably fake too)

Reply to  Dr Burns
September 27, 2014 2:29 pm

“You can fool all the people some of the time, and some of the people all the time, and most of the time that’s quiet sufficient. ”
-Dad

BFL
Reply to  Dr Burns
September 27, 2014 2:45 pm

“You can fool some of the people all the time, and those are the ones you want to concentrate on.”
G.W. Bush
“There’s an old saying in Tennessee — I know it’s in Texas, probably in Tennessee — that says, fool me once, shame on — shame on you. Fool me — you can’t get fooled again.”
G.W. Bush

Reply to  BFL
September 27, 2014 7:25 pm

At least you’re not quoting Dan Quayle.

Udar
Reply to  BFL
September 28, 2014 8:08 am

“I’ve now been in 57 states — I think one left to go.” – Barak H. Obama

Jim Francisco
Reply to  Dr Burns
September 27, 2014 8:29 pm

How about… But you can make a fool of yourself anytime.

Man Bearpig
September 27, 2014 1:38 pm

This seems to have been a Mann ‘backslapping’ session. I think he was trying to make himself feel warm inside before getting a good ol SLAPP on the back.

Cream Bourbon
September 27, 2014 2:00 pm

My niece went to that talk and probably has never seen that Mauna Loa curve before. You may be surprised but the talk was not just for you.

u.k.(us)
Reply to  Cream Bourbon
September 27, 2014 3:49 pm

Good snarky point.
Best not to overwhelm the uninitiated.

Cream Bourbon
Reply to  u.k.(us)
September 27, 2014 11:55 pm

Exactly. A talk should be pitched at the audience and this was a public lecture. Most members of the public will not have seen the curve. It is arrogant of Watts to think the talk has been tailored for him.

September 27, 2014 2:02 pm

So basically he hasn’t done any research in almost 10 years.

Admad
September 27, 2014 2:03 pm

bit chilly
September 27, 2014 2:05 pm

it would appear mann is stuck in the last century and is unaware of the observations of the climate in the last 14 years. i have an ongoing debate with an earth scientist that contributes to sks on another forum,he takes umbrage when i bring up mann as he is apparently no longer relevant in the debate , “that was a long time ago” is the phrase used.
all well and good apart from the fact mann and the cabot institute are still promoting last centuries propaganda.

Bill Illis
September 27, 2014 2:21 pm

Hansen maintains his own chart of the 1988 predictions against observations on his personal webpages.
The relevant comparison here is the Blue line (most relevant prediction) against the Black line (GISS land-ocean temps).
http://www.columbia.edu/~mhs119/Temperature/T_moreFigs/PNAS_GTCh_Fig2.gif

FrankK
Reply to  Bill Illis
September 27, 2014 2:50 pm

Yes. And also Scenario C with no increase in CO2 emissions from 2000 onwards that didn’t occur.
http://wattsupwiththat.com/2012/06/15/james-hansens-climate-forecast-of-1988-a-whopping-150-wrong/

Streetcred
Reply to  FrankK
September 27, 2014 6:20 pm

If these Charlies are the be all and end all in climate science … the settled science … then that graph alone rings the BS alarm bells, CO2 does pretty much nothing !

looncraz
Reply to  Bill Illis
September 27, 2014 9:55 pm

I find it interesting that scenario C is actually quite close to observations. I’m assuming that scenario is one in which CO2 emissions cease and there is no additional forcing? If so, it seems we have a model prediction of what would happen if additional CO2 forcing was zero (or very low) that has been started well on its way to being validated by observation.
I tried to find the answer as to what scenario C represents, but his web-site gave me a headache.

KTM
Reply to  looncraz
September 27, 2014 10:37 pm

IIRC, it was a low end projection through the year 2000, after which temperatures became de-coupled from CO2 (its forcing ceased to be factored in).

FrankKarr
Reply to  looncraz
September 28, 2014 1:44 am

No. The model is rubbish, it has no predictive ability.

September 27, 2014 2:24 pm

Bless the Mann.
For no one challenging the credibility of the CAGW meme could have invented such a character.
He and Al Gore have done more to encourage scepticism and serious questioning of This prothesized Doom by Magic Gas, than any number of serious scientists.
They both reek of Bovine Excrement.

FrankK
September 27, 2014 2:42 pm

In an among friends:comment image%3Bhttp%253A%252F%252Fstringthink.wordpress.com%252F%3B1700%3B2200

Christopher Hanley
September 27, 2014 2:50 pm

What a pathetic presentation.
Nostalgia as deception: “… nostalgia … in some forms can become a defense mechanism by which people avoid the historical facts …” (Wiki).
Lewandowsky cura te ipsum.

ShrNfr
September 27, 2014 3:41 pm

Does anyone besides me have a real gripe about “greenhouse effect”? A greenhouse becomes warm and remains warm because convection of heated air is inhibited. Nothing more, nothing less. In the free atmosphere, atmosphere that is heated for whatever reason rises and cools at approximately the adiabatic lapse rate.

Michael Wassil
Reply to  ShrNfr
September 27, 2014 7:51 pm
Richard111
Reply to  Michael Wassil
September 27, 2014 10:09 pm
Michael Wassil
Reply to  Michael Wassil
September 28, 2014 12:00 am

Richard111 September 27, 2014 at 10:09 pm
Thanks for that! It’s quite interesting that you provided a link to physicist. Yesterday I offered a “Tip/Note” for Anthony here:
http://wattsupwiththat.com/tips-and-notes-2/#comment-1747788

Aside from an article by Willis Eschenbach in 2013, in which he discussed Wood’s experiment and found it inconclusive, I can’t find any articles in WUWT that discuss and follow the timeline of Arrhenius’s GHG hypothesis, its rejection and subsequent acceptance by climate scientists. Many scientists, I presume geologists and physicists still consider it refuted.

I found the geologist and you provided the physicist. I think we’re on a roll.

Charles Nelson
September 27, 2014 3:42 pm

Anthony, can you give us a sense of how the audience felt about Mann?
It’s hard to imagine, given the amount of exposure his ‘trickery’ and self aggrandisement has received that very many of them have genuine faith in him as a Scientist.

Reply to  Anthony Watts
September 27, 2014 5:20 pm

Polite applause?
Applause because they were thankful it was over?
Just wondering.

September 27, 2014 3:51 pm

If I believed a grand conspiracy were out to get me, I would not travel the world showing groups of strangers what my family looks like.

Michael Wassil
Reply to  omnologos
September 27, 2014 7:45 pm

That’s just you. Not Michael Mann apparently.

September 27, 2014 3:56 pm

The “Why Didn’t Watts Ask Any Question” brouhaha confirms Anthony star status among the warmist crowd.
It’s as if Mann himself weren’t enough, and his lectures incomplete when King Skeptic attends but remains quiet…

Michael Wassil
Reply to  omnologos
September 27, 2014 7:48 pm

I guessed you missed it. The ‘q and a’ was a theatrical performance, Lewandowski directing.

Mike McMillan
September 27, 2014 4:18 pm

Anthony,
Next time you go to a Mann lecture, ask to sit up closer so you can get better shots of his slides.
Better yet, ask for a thumbdrive of his slides.
But check it for malware.

Pamela Gray
September 27, 2014 4:24 pm

Not impressed. Very amateurish presentation by Mann.

AnotherQlder
Reply to  Pamela Gray
September 28, 2014 5:36 am

I completely agree – hard to believe the guy is employed by an university. Outdated graphs, images, reports – if he had any credentials – why would you have half of all slides badmouthing other people rather than show evidence and facts? and allow people to make up their own mind?

September 27, 2014 4:24 pm

Summary perceived:
1 Old Jokes including Hockey Stick
2. List of Dooms
3. List of Enemies
4 Family Picture with Polar Bear
…and he got paid for that!!?

September 27, 2014 4:28 pm

My comment to slide 17!

September 27, 2014 4:52 pm

In reviewing books, Mark Twain was known to reject books without reading the entire content. When asked why he doesn’t read the entire book, he replied you don’t need to eat the whole apple pie to know it’s rotten. Without looking at Mann’s slides, I know they’re rotten. The cook is filthy, the apple pie is also filthy

AndrewS
September 27, 2014 4:53 pm

Why is everyone so far back? You would need a pair of binoculars to read his presentation.

FrankKarr
Reply to  Anthony Watts
September 27, 2014 5:43 pm

Designed no doubt to allow heavies to tackle anybody attempting to disassemble the speaker (lol).

Streetcred
Reply to  Anthony Watts
September 27, 2014 6:23 pm

Should be able to throw a beer bottle 20′ … next they’ll have chainwire fencing between the audience and speakers.

mrpeteraustin
Reply to  Anthony Watts
September 28, 2014 5:02 am

A longer distance makes the presentation more “formal” and increases the authority of the presenter. Whereas a shorter distance increases engagement and audience interaction.

ralfellis
Reply to  Anthony Watts
September 28, 2014 1:02 pm

>> Should be able to throw a beer bottle 20′ … next they’ll
>>have chainwire fencing between the audience and speakers.
Haa. So M. Mann becomes the new Blues Brothers Band. I would pay to see that one….

David in Michigan
Reply to  AndrewS
September 27, 2014 5:29 pm

I had the same question….. why so far back. Did they think the attendees would rush the stage in protest??

lee
Reply to  David in Michigan
September 27, 2014 9:26 pm

He wanted to avoid the thrown underwear.

manicbeancounter
Reply to  AndrewS
September 28, 2014 5:24 am

It was the nature of the building. It was opened in 1842, originally for music recitals, at a time when appearance was more important than function. The stage is big enough for a full orchestra. However, it has been used for talks before. Charles Dickens spoke there in the 1850s.
http://www.bristol.ac.uk/music/facilities/vicrooms/

Reply to  manicbeancounter
September 28, 2014 2:22 pm

Only great authors of fiction are permitted?

Marnof
September 27, 2014 5:03 pm

Thanks very much for enduring that presentation and making it available. I’d be very interested to read about the debunked moose deaths covered in Doom Slide #5 if anyone has a link.
Now where did I put the Pepto-Bismal?

garymount
Reply to  Marnof
September 27, 2014 11:55 pm

This year, roughly 300 New Brunswickers will collide with a moose. Most of these crashes will happen between dusk and dawn when visibility is reduced and moose are hardest to see.

http://www2.gnb.ca/content/gnb/en/departments/dti/promos/think_moose.html

Mike McMillan
Reply to  garymount
September 28, 2014 2:55 am

That poor moose.

AnotherQlder
Reply to  Marnof
September 28, 2014 5:47 am

There was a CBC 1 Canada radio show a few weeks ago and they talked about a group of poeple putting together a lawsuit against the government of NB because of all the people lost on highways due to moose traffic. the articles below are just a few examples
http://atlantic.ctvnews.ca/two-killed-after-van-swerves-to-avoid-moose-collides-with-truck-1.1992657
http://www.thetelegram.com/Opinion/Letter-to-the-editor/2013-08-10/article-3344846/Moose-cull-makes-sense-for-road-safety/1
http://www.wildlifecollisions.ca/thefacts.htm

marnof
Reply to  AnotherQlder
September 28, 2014 7:24 am

Thank you all for those links. I’m not getting the connection between moose collisions and hockey sticks, though. I expected it to be something along the lines of this agit prop piece put forth by the NWF. They blame every conceivable outdoor annoyance on global warming, including moose die off due to winter tick infestation. The biggest howler is tying increased poison ivy exposure to increased atmospheric CO2! Wow.
http://www.nwf.org/~/media/PDFs/Global-Warming/Reports/2014/Ticked-Off-LOW-RES-FINAL-081814.pdf
Moose die off has been a fairly hot topic of discussion in New England, in some circles anyway, so if that has been debunked it would be great news.

LogosWrench
September 27, 2014 5:53 pm

Of course it was heavy on politics and light on science because the science negates the alarmist politics.

Streetcred
September 27, 2014 6:26 pm

These cranks should not be allowed a soft ride like Mann received here or Cook for that matter. Sceptics in attendance owe it to the millions of us worldwide to get to their feet and say something. Silence is used by these low-lifes as an indication of agreement … “my arguments are so strong that the sceptics are unable or unwilling to refute what I say!” Mann has already made statements to that effect.

Skiphil
September 27, 2014 8:19 pm

It is disgusting to see how much AlGorean hysteria is still presented in place of analysis. I used to call this kind of sloppy drive-by garbage “journalistic” (churnalism as a pejorative) — polar bears, moosies, and eels, really??? Now we can call climate hysteria “Mannian”….

rogerknights
September 27, 2014 9:14 pm

From the Mann one-minute video a few comments upthread: “The greatest disinformation campaign in history … Hundreds of millions of dollars”
Ridiculous. Who has ever seen a contrarian billboard or TV or radio spot, or print ad? How many contrarian articles can be found in the Reader’s Guide to Periodical Literature?
For a list of 20-plus things that would be happening (but aren’t) if climate contrarians were actually well-organized and well-funded, see my WUWT guest-thread, “Notes from Skull Island” at
http://wattsupwiththat.com/2012/12/16/notes-from-skull-island-why-skeptics-arent-well-funded-and-well-organized/

Randy
Reply to  rogerknights
September 27, 2014 10:07 pm

thanks for linking that. you might consider updating it with a list of what it would look like if the other side of the debate was well organized and well funded with set talking points and the like. Whatever we find is true in climate science in the end, the bias is extreme and obvious to anyone paying attention.

JB Goode
September 27, 2014 9:25 pm

Excuse my ignorance,I am not a scientist,but what was a psychologist doing on the podium at a science presentation?

Zeke
Reply to  JB Goode
September 27, 2014 9:35 pm

It’s an interdisciplinary paradigm, involving all of the arts, sciences, soft sciences, and laffy taffy in its scope. (:

Michael Wassil
Reply to  JB Goode
September 28, 2014 12:11 am

JB Goode September 27, 2014 at 9:25 pm
Counting heads for his next paper: The 99% Consensus.

September 28, 2014 12:17 am

Strange that he would give a lecture in England with so much US-focused material in it. Does he not tailor his material for the audience?

September 28, 2014 12:24 am

Peter Ward,
Didn’t you know? It’s all about him!

Andrewmharding
Editor
September 28, 2014 1:26 am

Thank you for sharing that with us Anthony. Reading between the slides, it appears Mann is pulling the same old tricks with graphs and charts that charlatans use. For instance the CO2ppm graph, we all know CO2 concentration has gone up and down in the past, so why not start the time axis from a few thousand years ago and the CO2 axis at zero? Because it would not look so dramatically misleading! It does not say a lot for his research if he is showing copies of the Washington Post. Why did he not show his research data that proves AGW?
To me it looks same,same,same; cherry picked data, cherry picked newspaper articles (unbelievable!), graphs and charts to exaggerate and mislead and a finale of nauseating sentimentality.

Cream Bourbon
Reply to  Andrewmharding
September 28, 2014 3:37 am

If Mann started his CO2ppm graph from a few thousand years ago it would look more dramatic, not less. It would highlight how unusual the CO2 rise has been since the start of the industrial revolution.

September 28, 2014 3:43 am
Cream Bourbon
Reply to  dbstealey
September 28, 2014 3:51 am

The poster said a few thousand years ago, not millions of years. In that timescale CO2 levels were remarkably stable. That is what would make the graph look more dramatic if it had been extended back in time just a few thousand years.

Reply to  Cream Bourbon
September 28, 2014 4:34 am

My mistake, I did mean a few million years ago. According to the AGW crowd, our planet should be un-inhabitable with the positive feedback of runaway global warming producing more and more CO2 as the temperatures rose. Of course it hasn’t, the worse case current scenario is doubling of current CO2 levels by the end of the next century which means CO2 concentration in the atmosphere is 0.079% as opposed to the current 0.04% and the 0.8% 570 million years ago. I will not be losing any sleep over this!

Cream Bourbon
Reply to  Cream Bourbon
September 28, 2014 5:28 am

andrewmharding
So, you sort of implicitly agree that just extending back a few thousand years would make the CO2ppm graph more dramatic? Perhaps you might agree that the intention of extending back millions of years would be to make the graph less dramatic? If so the same charge you made against Mann could be levelled at you – that you are trying to make the graph reflect a different picture that is more in the direction of your “view”. Further I could argue that Mann pitched the dramatic level of his graph in the middle – that is he was not trying to give any false impression at all. Just a plain statement of what CO2 levels are doing.
Perhaps you will not lose any sleep over these figures but perhaps for the wrong reasons. It is not the absolute value that should concern you but the relative increase that is significant and the effect it will have. I know this is a dramatic parallel but that is the point of it. If you had ingested 1 microgram of polonium you would not say “Oh, that is such a small percentage of my bodyweight it does not matter”. Though you would not lose much sleep because you would be dead!

Pamela Gray
Reply to  Cream Bourbon
September 28, 2014 7:51 am

Cream, I am interested in your take on the oceanic carbon cycle. How long do you think it is, and given what we know about vast swings in CO2-rich flora and fauna warm periods undergoing devastation and diminution due to cold cycles, when do you think the vast oceanic stores from the last period would resurface from the abyssal areas to be outgassed?

Cream Bourbon
Reply to  Cream Bourbon
September 28, 2014 8:23 am

@Pamela Gray
Why are you interested in my take on the oceanic carbon cycle? A bit random isn’t it? Especially as you have never interacted with me before. FYI I have no particular take on the oceanic carbon cycle. I guess this is some sort of gish gallop to derail the perfectly good discussion in progress. #notbornyesterday
I was discussing with Andremharding why he criticised a perfectly ordinary CO2ppm graph as somehow being underhand.

Pamela Gray
Reply to  Cream Bourbon
September 28, 2014 10:38 am

Cream, the CO2 oceanic water cycle (many centuries long) is an important driver of atmospheric CO2 outgassing. Do you have any comments as to whether or not current CO2 sensors are actually detecting this outgassing of CO2 absorbed many centuries ago (note: current sensors are blind to isotope)? I assumed you had at least a basic understanding of this multi-centuries long process that includes large and small oscillations? Maybe not?

Cream Bourbon
Reply to  Cream Bourbon
September 28, 2014 3:52 pm

@Pamela Gray
No, I do not know what you are referring to. It sounds like some sort of stadium wave/cycle idea. Perhaps if you gave some references and context I could understand where you are coming from.
Does it have any relevance to Andrew Harding’s criticism of the CO2ppm graph? Or are you just asking me more random questions?

Reply to  Cream Bourbon
September 29, 2014 12:19 am

Cream B says:
If you had ingested 1 microgram of polonium…
Don’t you guys ever get tired of that bogus old argument? Sure, if you fill the room with CO2 it would be fatal. But exactly the same argument can be made for H2O — water.
Both H2O and CO2 are neccessary for life on Earth. Plants evolved over hundreds of millions of years in a CO2-rich atmosphere. Now they are starved of CO2. They have adapted, but they much prefer more CO2, as greenhouse farmers know. Injecting up to ≈1500 ppm of CO2 in greenhouses greatly improves growth. That is why the planet has been greening lately: more CO2.
You just don’t like the graph because it debunks your demonization of CO2; a very beneficial trace gas. Life could not exist without it. More CO2 is better, at both current and projected concentrations..

Cream Bourbon
Reply to  dbstealey
September 29, 2014 6:35 am


Bogus? You guys? Tired of the argument? Is that supposed to add to the discussion?
Are you suggesting that saying there is only 0.04% Co2 in the atmosphere means it is not important? Don’t you get tired of having to defend such a bogus idea?
I have not expressed any opinion about your graph. That was not what the discussion was about. So stop projecting.
Can anyone on this forum follow a discussion point at all? Apparently not.

Reply to  Cream Bourbon
September 29, 2014 12:05 pm

Yes, bogus. You are detracting from the discussion by bringing that nonsense up again. You do it because you are losing the argument. More CO2, at both current and projected concentrations, is a net benefit to the biosphere. It causes no global harm, thewrfore it is ‘harmless’. QED
The alarmist argument typically ends up with someone saying that CO2 will be fatal if there is enough of it. Well, so will water. Six inches deep is probably enough. Now do you see the bogosity? If not, everyone else does.
I’m not only saying that .04% of CO2 is importanbt, I am saying that more is better. Your lame attempt to re-frame the debate is why tha alarmist contingenty is always on the losing end. Do you really think you’re smart enough to paint me into a corner like that?
Sorry I supposed you were referring to the graph I posted. But you only said, …the CO2ppm graph…, and …The poster said…. You did not identify which graph. Then you say:
Can anyone on this forum follow a discussion point at all? Apparently not.
Next time, be more clear.

Reply to  dbstealey
September 29, 2014 8:07 am

Well it was the source of its own starvation since the drop in CO2 over 400 million years ago coincided with the emergence of terrestrial plants and more recently the evolution of C4 plants.

Cream Bourbon
September 28, 2014 5:15 am

test

manicbeancounter
September 28, 2014 6:10 am

Mann then states

The recent warming does appear to be unprecedented as far back as we can go

The unprecedented bit comes from splicing the instrumental record onto the proxy record. The proxy data does not show the same magnitude of twentieth century warming, which could mean that past temperature variations are also understated. This is much clearer in the more recent reconstructions used at the SkS website, which I looked at here.

manicbeancounter
Reply to  manicbeancounter
September 28, 2014 6:15 am

My copy and paste failed! Please see #comment-1748678 below for full comment,

manicbeancounter
September 28, 2014 6:12 am

Considering that hockey sticks are Mann’s specialism, they are under-represented. Slide 47 is of a “Hockey League” of 12 reconstructions, with no legend. A few weeks Mann made the claim the following statement for John Cook’s Consensus Project.

There are now dozens of hockey sticks and they all come to the same basic conclusion

Twelve is one dozen. So where are the others?
Mann then states

The recent warming does appear to be unprecedented as far back as we can go

The unprecedented bit comes from splicing the instrumental record onto the proxy record. The proxy data does not show the same magnitude of twentieth century warming, which could mean that past temperature variations are also understated. This is much clearer in the more recent reconstructions used at the SkS website, which I looked at here.

gregladen
September 28, 2014 6:59 am

Why didn’t you just ask Dr. Mann for a copy of his slide show?

Reply to  gregladen
September 29, 2014 12:25 am

If Anthony had your lack of ethics, he could have just fabricated the slides.

Pamela Gray
September 28, 2014 8:04 am

An interesting take on CO2 proxies from scientists answering a question about origins of paleo-carbondioxide data sets.
http://newton.dep.anl.gov/askasci/env99/env99408.htm

Pamela Gray
September 28, 2014 8:34 am

Can we stand another bristle cone pinetree paleo proxy? This one may be worth something. Scroll to the last graph which proposes a new temperature reconstruction for the Northern Hemisphere. Decidedly non-hockey stick in appearance. Note the missing data early in the record. It is proposed that temperatures, treelines, and ring width plummeted so greatly that tree data cannot be utilized for centuries after what appears to be a profound drop in temperatures. Leading authors to suggest that today’s recovery rate may be similar to this past recovery, based on their statement that “…initial evidence of twentieth century treeline advances [are] greater than in approximately 4,000 years.”
http://link.springer.com/article/10.1007/s00382-013-1911-9/fulltext.html
Mann’s hockey stick is so yesterday’s snake oil attempt.

Editor
September 28, 2014 9:49 am

Cream Bourbon.
I do not have any preconceived ideas, on the contrary, initially, when the AGW surfaced, I was very concerned and thought something needed to be done. The one thing that changed my mind was when wild preposterous claims were made, such as the Earth could become like the planet Venus, because as I accept, if temperatures rise then basic CO2 containing compounds, eg calcium carbonate, calcium bicarbonate and as temperatures rise so does insolubility of CO2 in the oceans and seas (this is despite the fact that we are being told that ocean acidification due to carbonic acid is increasing).
Venus has a surface temperature of 860 F, an atmosphere which weighs 93 times our atmosphere, there is nowhere near enough CO2 on Earth, trapped or otherwise to be able to produce an atmospheric density of this nature.
Being told sea levels will rise when the Arctic ice melts, of course it won’t, ice is 90% of the density of water, therefore if it all melts, there is no nett rise of sea level. I accept that ice on land will raise sea level, but the Antarctic ice extent is actually increasing.
After these very basic scientific errors, I considered the following:
E-mails, the contents of which will not be divulged, raw data, the same.
Calling us d*ni*rs to compare us with N*zis, who should be imprisoned.
The science is settled (no global temperature rise in almost 18 years).
Said heat disappearing into the ocean depths, which is magical as opposed to the LAWS of Thermodynamics (not computer models).
Electric cars which are clean, not when the electricity that charges them is mainly from fossil fuels.
Building windmills which we are told will provide us with all the clean power we need, not when the wind doesn’t blow they don’t! Most provide us with 25% of quoted output, no mention is made of the roads that need to be built to build and service them together with the copper for the cables and the 800 cubic metres of concrete needed to prevent them from toppling over. How much CO2 does building the things produce?
Reducing CO2 here in UK by switching one of our biggest power stations to burning renewable wood instead of coal. The wood absorbs CO2 and the emits it again when burned, so is “Carbon Neutral” . Fantastic! Except what about the CO2 produced to cut the trees down, pulverise them into a powder, dry the powder, turn into pellets and then ship across the Atlantic in cargo ships? It does not add up.
I was told in the early nineties, snow in winter in the UK would be a thing of the past, it isn’t. I would be able to grow vines and produce my own wine, I can’t and Southern Spain (from where I returned yesterday), would be an un-inhabitable desert, with climate refugees heading up here to NE England (it isn’t and they haven’t)
Finally the graph kindly supplied by dbstealey, shows that CO2 concentrations in the past 20 times higher than now have not led to Armageddon for the planet.
These reasons, together with the measures that will decimate our economies are why I am a disbeli*ver in AGW being a threat to the planet.
Your analogy of Polonium is an interesting one, if I was to follow the logic of your argument, I would point out that I have many grams of CO2 in my body, this regulates my breathing. Too much, my breathing rate goes up, too little and my breathing rate falls. The actual mechanism you are talking about is LD50. All drugs and toxins have a calculation of LD50, this means that at a given dose, 50% of those exposed to it will die. The idea of this scale is to be able to judge the relative toxicity of substances. Polonium 210 is one of the most toxic substances known to man at LD50 = 0.00000001g/kg of body weight.

Cream Bourbon
Reply to  Andrew Harding
September 28, 2014 10:04 am

Andrew Harding
Thanks for the long reply. There are many points there that could all be the basis for a discussion all on their own. However I do not see anything addressing why you criticised the CO2ppm graph when it was so run of the mill and ordinary.
On the polonium analogy – despite the fact I said it might be over dramatic – you appear to have chosen to miss the point. Which is that “small” amounts of a substance can be significant. It is not the absolute amount that is of relevance.
Anyway – best wishes.
CB

Pamela Gray
Reply to  Cream Bourbon
September 28, 2014 10:49 am

Then I would recommend using something similar, like water, in your toxic analogy. Changes in small amounts of water do not necessarily lead to harm, since the kidneys function to adjust to changes, keeping the body in a general equilibrium range. I would propose Earth does the same with CO2. So you cannot simply argue that a bit more would be harmful while not considering changes in feedbacks. Similar temperature change from other sources causes adjustments in the hydrological cycle that do not send us over the cliff in a panic. What is so special about CO2 possibly resulting in these types of slight changes in the hydrological cycle? And why even bother discussing it since we cannot currently detect such an adjustment in the day to day hydrological cycle (using indices such as tornadoes, hurricanes, snow, drought, floods, etc)?

Cream Bourbon
Reply to  Cream Bourbon
September 28, 2014 11:07 am

@Pamela Gray
Yes, you can make a more complex analogy but that rather ruins the point of an analogy which is to make is to make a point in an illuminating and simple way. If you do not want to accept the analogy then fine. I suppose that avoids having to think about the point being made. Which is just because the level of CO2 in the air is small that does not mean it can be discounted as not important.

Pamela Gray
Reply to  Cream Bourbon
September 28, 2014 11:52 am

Ok. Following your lead, then just how powerful is the % of increasing CO2 that is just emitted from burning fossil fuel? Do we know how many ppm of the CO2 increase each year can be identified as being from fossil fuel? Only then can we mathematically calculate its ability to raise global temperatures, and from there make a statement as to how much of the recent warming can be attributed, energy wise, to the anthropogenic portion of increasing CO2. Otherwise the discussion is baseless conjecture.
The null hypothesis would be that of the increasing portion of atmospheric CO2, the part of that increase that is anthropogenic does not have sufficient re-radiating power to result in a measurable stable temperature increase. Either because there is no increase, the increase is too small to measure by any means, or current sensor technology is unable to detect it.

Cream Bourbon
Reply to  Cream Bourbon
September 28, 2014 12:09 pm

@Pamela Gray
What lead? You are the one taking over and leading the discussion into other not very related areas. I was just curious why Andrew saw problems with a vanilla graph of CO2ppm.
The only other simple point made in the discussion is that you cannot look at an amount of anything and say that has no significance without knowing more about its properties. Perhaps that point is made in your posting somewhere.

Pamela Gray
Reply to  Cream Bourbon
September 28, 2014 12:43 pm

Cream, I am far more interested in your background scientific knowledge of these matters. Once again, what do you know of the drivers of atmospheric CO2 ups and downs? And what do you know of the ability of just the anthropogenic portion of increasing atmospheric CO2 that would have the chops to drive a measurable global temperature trend? You seem to be in the anthropogenic global warming camp. On what personal basis? Scientific knowledge? Or do you just “believe the person in control of the narrative?”

Cream Bourbon
Reply to  Cream Bourbon
September 28, 2014 1:41 pm

@Pamela Gray
I am not sure why you are interested in me as I have only asked a couple of straightforward if testing questions of Andrew. But as you show an interest …
So, yes I have some scientific knowledge of these matters. Do I “believe the person in control of the narrative”? No, I do not think so as I do not think anyone is in control of the narrative. Though many try to influence it.
What do I know of CO2 ups and downs? Or the anthropogenetic component? Just what you can read in the popular literature, text books and the not too obscure scientific literature. Hope that helps.

Reply to  Cream Bourbon
September 29, 2014 12:34 am

C. Bourbon says:
On the polonium analogy… It is not the absolute amount that is of relevance.
The polonium analogy is no different from an H2O analogy. Any substance can be fatal with the proper dose.
Demonizing CO2 as if it is 100% of the atmosphere is dishonest. At current and projected concentrations, CO2 is beneficial to the biosphere. More is better.
You are trying to make CO2 a bad thing, when it is good. We exhale 40,000 ppm of CO2 with no problem, and you can be resuscitated with that concentration.
The “too much CO2” argument always fails. Plants do better with more CO2. The entire biosphere does better. Only the climate alarmist crowd does worse.

Cream Bourbon
Reply to  Cream Bourbon
September 29, 2014 7:42 am


More projection from you. Nothing you say has any connection with anything I have posted.

Reply to  Cream Bourbon
September 29, 2014 12:16 pm

@”Cream Bourbon”:
Projection?? You have reading comprehension difficulties, me boi. My comment above responded to, and specifically refuted your claims. That’s easy to do when alarmists try to argue. In this case, you are in over your head.
The fact is that CO2 is harmless, and it is beneficial to the biosphere at both current and projected concentrations. More CO2 is better. The biosphere is starved of CO2. Plants evolved under much higher concentrations. They have adapted, but they do much better with more CO2 in the air. This has been proven empirically so many times that it is not worth arguing about.
Furthermore, the OISM co-signers — all 31,000+ of them — have stated what I just wrote here. Each one of them has a degree in the hard sciences, including more than 9,000 PhD’s. When they state explicitly that CO2 is harmless and beneficial, you need to understand that I tend to accept their expertise over an anonymous screen name.

Editor
September 28, 2014 12:06 pm

Cream Bourbon.
One more point I would like to add. Yes, I have a problem with the graph, it ignores the medieval warm period, it ignores the fact that Greenland was once green and at the time of the Romans conquering Britain, the climate was also warmer.
If Michael Mann had shown DBStealey’s graph at this lecture, or, if it was widely publicised, do you think that AGW is demonstrably a viable theory?. That is what the debate is about, if this graph is genuine then that is the end of AGW theory, since the planet would have suffered from GW 1/2 a billion years ago and the industrial revolution and burning of fossil fuels is a total irrelevance.

Cream Bourbon
Reply to  Andrew Harding
September 28, 2014 12:19 pm

Harding
How does a graph of CO2 ppm ignore the MWP or show Greenland was once green? Or show temperature? Or show AGW is a demonstrable theory? You seem to have wandered off topic.Or I am beginning to wonder if we are looking at different graphs. 🙂
Your last paragraph – how does that graph show the end of AGW theory? Perhaps the planet did have global warming 1/2 a billion years ago? Perhaps the sun output was not as strong then? How does that make the burning of fossil fuels an irrelevance? You are not quite linking your thought processes together so I can understand what you are trying to say.

September 28, 2014 2:37 pm

If atmospheric CO2 rises and temperature does not also rise, than either there is no causation OR there exists negative feedbacks which effectively undo any causation.
This is what the Mauna Loa CO2 graph and RSS temperature since 1998 graph tells me.

September 28, 2014 3:13 pm

Wow!
A talk about the man from the man himself!
What torture!

Toto
September 28, 2014 3:44 pm

Mann will never get it, but at least 97% of everybody else knows that Mann’s Number One enemy is Mann.

Pamela Gray
September 28, 2014 4:35 pm

I continue to look into the oceanic carbon cycle as a possible source of the changing carbon isotope signature. What most people are not aware of is that there is essentially no difference between plant CO2 and fossil fuel CO2. Since fossil fuels are ultimately derived from ancient plants, plants and fossil fuels all have roughly the same 13C/12C ratio – about 2% lower than that of the atmosphere. As CO2 from these materials is released into, and mixes with, the atmosphere, the average 13C/12C ratio of the atmosphere decreases. An outgassing ocean that has coughed up an ancient and rich store of carbon and carbon dioxide (from a warm land period that once ended sent it all into the oceans) could explain the changing ratio in captured atmospheric samples. Such a large source such as the oceans would have a decidedly regular nature to its signature as well. Remember, in the past CO2 has been both lower and higher. It would make sense to see echoes of this kind of oscillation. Are we in such a period? Maybe.

MrX
September 28, 2014 6:36 pm

Doom and Enemies. Good band name.

Editor
September 28, 2014 11:01 pm

CB. What I am trying to say is this:
We have been told that there is a “tipping point”, this is when the proportion of CO2 in the atmosphere is so high, that GW will increase and become exponential and unstoppable. My point is that this did not happen 570 million years ago when there was 20 times the CO2 in the atmosphere as there is now. As Pamela has pointed out there is no difference between CO2 produced by natural means or CO2 produced by fossil fuels.
Why should the world return to a medieval economy to counter a non-existent threat?

Cream Bourbon
Reply to  andrewmharding
September 29, 2014 12:34 am

@AndrewHarding
It looks like you do not want to justify your comments about the CO2ppm graph so I will give up on that. You want to talk about something else? OK, for your latest post.
There is an example of GW becoming unstoppable on the planet Venus. I do not think anybody seriously thinks that will happen here and not for a long long time. Venus is an interesting case study.
No, unstoppable GW did not happen 570 million years ago. There was global warming then though. 570 million years ago is a long time and not directly relevant to us in the here and now.
Whether there is a difference in plant CO2 and fossil fuels CO2 is irrelevant. It is how much that is ending up in the atmosphere that is the issue. Wherever it comes from.
You are saying that unstoppable GW is a non-existent threat. What about the existent threat of a very uncomfortable temperature rise? Should that threat be ignored as well?

Reply to  Cream Bourbon
September 29, 2014 12:41 am

Cream B says:
It looks like you do not want to justify your comments about the CO2ppm graph so I will give up on that.
Since I posted that graph, if there is anything I can help you with, just ask.
You also say:
There is an example of GW becoming unstoppable on the planet Venus.
You are conflating unrelated things. Mars also has an atmosphere of 95%+ CO2. But Mars is very cold and it has never had a problem with runaway global warming. Proximity to the sun explains the difference in the two plantets’ temperatures. Venus is much closer to the sun than Mars. Think: inverse square law.

richardscourtney
Reply to  Cream Bourbon
September 29, 2014 8:21 am

Cream Bourbon
I have followed this discussion with interest.
It began when andrewmharding wrote saying in full

Thank you for sharing that with us Anthony. Reading between the slides, it appears Mann is pulling the same old tricks with graphs and charts that charlatans use. For instance the CO2ppm graph, we all know CO2 concentration has gone up and down in the past, so why not start the time axis from a few thousand years ago and the CO2 axis at zero? Because it would not look so dramatically misleading! It does not say a lot for his research if he is showing copies of the Washington Post. Why did he not show his research data that proves AGW?
To me it looks same,same,same; cherry picked data, cherry picked newspaper articles (unbelievable!), graphs and charts to exaggerate and mislead and a finale of nauseating sentimentality.

That is a clear exposition of the “CO2 ppm graph” Mann presented, what Mann did not present, and the opinion of Andrewmharding concerning those points.
You replied to that saying in full

If Mann started his CO2ppm graph from a few thousand years ago it would look more dramatic, not less. It would highlight how unusual the CO2 rise has been since the start of the industrial revolution.

Your assertion of “how unusual the CO2 rise has been since the start of the industrial revolution” was not justified and it cannot be justified. But your assertion did deflect from Andrew Harding’s overall point that Mann’s presentation was “To me it looks same,same,same; cherry picked data, cherry picked newspaper articles (unbelievable!), graphs and charts to exaggerate and mislead and a finale of nauseating sentimentality.”
dbstealey pointed out the error of your assertion here where he wrote

Cream Bourbon,
Don’t be silly. The biosphere is starved of CO2:

And he provided a graph of atmospheric CO2 going back millions of years as a method to substantiate his point.
There then followed discussion concerning whether the appropriate time scale should be thousands of years or millions of years. And Pamela Gray entered the discussion to request your understanding of carbon cycle dynamics but you refused to provide that.
The discussion then wandered around considering pointless analogies and arguments about dosages.
And then you wrote a post that included this in response to andrewmharding

Thanks for the long reply. There are many points there that could all be the basis for a discussion all on their own. However I do not see anything addressing why you criticised the CO2ppm graph when it was so run of the mill and ordinary.

The graph was NOT “run of the mill and ordinary”: andrewmharding presented it as an example from a set that – as I quote at the start of this review – he said were “graphs and charts that charlatans use”.
Clearly, you have forgotten what the discussion is about.
More debate ensued before Andrew Harding attempted to bring the discussion back to its subject writing to you and saying in full

Cream Bourbon.
One more point I would like to add. Yes, I have a problem with the graph, it ignores the medieval warm period, it ignores the fact that Greenland was once green and at the time of the Romans conquering Britain, the climate was also warmer.
If Michael Mann had shown DBStealey’s graph at this lecture, or, if it was widely publicised, do you think that AGW is demonstrably a viable theory?. That is what the debate is about, if this graph is genuine then that is the end of AGW theory, since the planet would have suffered from GW 1/2 a billion years ago and the industrial revolution and burning of fossil fuels is a total irrelevance.

Your response says in full

Harding
How does a graph of CO2 ppm ignore the MWP or show Greenland was once green? Or show temperature? Or show AGW is a demonstrable theory? You seem to have wandered off topic.Or I am beginning to wonder if we are looking at different graphs. 🙂
Your last paragraph – how does that graph show the end of AGW theory? Perhaps the planet did have global warming 1/2 a billion years ago? Perhaps the sun output was not as strong then? How does that make the burning of fossil fuels an irrelevance? You are not quite linking your thought processes together so I can understand what you are trying to say.

Cream Bourbon, that response takes the biscuit.
You had “wandered off topic”, not him. And his comment was an attempt to return you to it.
And you have followed that with more waffle including asserting to Andrew Harding

It looks like you do not want to justify your comments about the CO2ppm graph so I will give up on that. You want to talk about something else?

From the start he was talking about “something else” which was that Mann’s presentation seemed to consist of “cherry picked data, cherry picked newspaper articles (unbelievable!), graphs and charts to exaggerate and mislead and a finale of nauseating sentimentality”.
YOU deflected it onto his illustration as being a substantive point which it never was.
As an observer, it seems to me that Andrew Harding made a strong but correct comment on Mann’s chartmanship, and the entire subsequent discussion has been because you have been attempting to deflect from the truth of that comment.
Richard

Cream Bourbon
Reply to  Cream Bourbon
September 29, 2014 9:08 am

@richardscourtney
Thank you for showing an interest in my discussion and your long post to illustrate. However I think you fell at the first hurdle which made the rest rather redundant. You appear to be following the same mistake as others of trying to widen what I said into something you could argue with.
I was just making the simple point that Mann’s graph was not dramatic and if it was extended to the last few thousand years it would look more dramatic. Nobody has addressed that simple point except for you, peripherally, who tried to dismiss it with “Your assertion of “how unusual the CO2 rise has been since the start of the industrial revolution” was not justified and it cannot be justified.”.if you had joined the discussion earlier we could perhaps have discussed that. (I do not think it is particularly controversial to say that CO2 levels have gone up since the industrial revolution.)
The rest of your points seem irrelevant because you seem to be telling me what I should have been discussing. A bit like everyone else who joined the discussion.
I just contend that a graph of Mauna Loa CO2 rise is not dramatic or controversial. And I would have thought even you would accept that.

richardscourtney
Reply to  Cream Bourbon
September 29, 2014 9:36 am

Cream Bourbon
You say to me

I was just making the simple point that Mann’s graph was not dramatic and if it was extended to the last few thousand years it would look more dramatic. Nobody has addressed that simple point except for you, peripherally, who tried to dismiss it with “Your assertion of “how unusual the CO2 rise has been since the start of the industrial revolution” was not justified and it cannot be justified.”.if you had joined the discussion earlier we could perhaps have discussed that. (I do not think it is particularly controversial to say that CO2 levels have gone up since the industrial revolution.)
The rest of your points seem irrelevant because you seem to be telling me what I should have been discussing. A bit like everyone else who joined the discussion.

NO! Dear me, NO!
I and others point out that you attempted – with some success – to deflect from the critique by Andrew Harding of Mann’s presentation. Your deflection used the red herring of discussing the CO2 graph Harding mentioned as illustration.
And your “simple point that Mann’s graph was not dramatic and if it was extended to the last few thousand years it would look more dramatic” may – or may not – be true, but so what? Mann’s graph was – as Harding said – a misleading cherry pick, and dbstealey proved that it was a misleading cherry pick by posting a graph with longer time scale.
Nobody disputes that “CO2 levels have gone up since the industrial revolution”. At issue is why, how and to what effect. Pamela Gray and Andrew Harding each attempted to get you to address those matters but you refused.
In summation, your reply to me supports my conclusion; viz.

From the start [Andrew Harding] was talking about “something else” which was that Mann’s presentation seemed to consist of “cherry picked data, cherry picked newspaper articles (unbelievable!), graphs and charts to exaggerate and mislead and a finale of nauseating sentimentality”.
YOU deflected it onto his illustration as being a substantive point which it never was.
As an observer, it seems to me that Andrew Harding made a strong but correct comment on Mann’s chartmanship, and the entire subsequent discussion has been because you have been attempting to deflect from the truth of that comment.

Richard

Cream Bourbon
Reply to  andrewmharding
September 29, 2014 7:48 am


No, you misunderstand. I am talking about the Mann graph which is the primary point of the discussion.
Sigh.

Cream Bourbon
Reply to  Cream Bourbon
September 29, 2014 7:54 am


And how does that mean I conflated unrelated things? (Hint: It doesn’t.)
Do you always take what people say and project them into what you wanted them to say? Try following what I am saying; not what you imagine I am saying.
Re-sigh.

richardscourtney
Reply to  Cream Bourbon
September 29, 2014 8:26 am

Cream Bourbon
I have a post stuck in moderation which concludes saying to you of this discussion

YOU deflected it onto his illustration as being a substantive point which it never was.
As an observer, it seems to me that Andrew Harding made a strong but correct comment on Mann’s chartmanship, and the entire subsequent discussion has been because you have been attempting to deflect from the truth of that comment.

Richard

Reply to  Cream Bourbon
September 29, 2014 12:22 pm

@Cream Bourbon:
Now you’re talking to yourself. But keep sighing, and re-sighing; it adds beneficial, harmless CO2 to the atmosphere. That is entirely a good thing.
But it doesn’t do anything else. Except show that you have no credible argument to make.

Cream Bourbon
Reply to  andrewmharding
September 29, 2014 10:24 am

@richardscourtney
Just saying it all again does not make your points any more valid. You are still falling into the error of trying to widen what I said to something of your making that you would like to dispute. To wit, there is absolutely no justification for you saying I tried to “deflect” from Andrew’s critique. I picked a point he made and commented on it. No more, no less.
So, thank you for your interest but I think I will draw a line under this discussion.

richardscourtney
Reply to  Cream Bourbon
September 29, 2014 10:37 am

Cream Bourbon
You having twice failed to answer my point concerning your use of a red herring you say to me

So, thank you for your interest but I think I will draw a line under this discussion.

I suspect there will be no expressions of surprise.
Richard

Cream Bourbon
September 29, 2014 10:59 am

@richardscourtney
Perhaps you could count up how many times my point was not answered or addressed? And how many times people tried to deflect from what I was saying into other areas?
Though you obviously still do not accept what I said I will say it one more time. The red herring and the “deflection” are your creation. You are making a sort of strawman argument I think. I initially made one clear point. No more, no less. No tricks. No conspiratorial deflection. No-one appeared to be able to handle it.
So thank you for your interest. I will draw a meta-line under this discussion.

richardscourtney
Reply to  Cream Bourbon
September 29, 2014 11:39 am

Cream Bourbon
You are trolling.
I take exception to your saying to me

Though you obviously still do not accept what I said I will say it one more time. The red herring and the “deflection” are your creation. You are making a sort of strawman argument I think. I initially made one clear point. No more, no less. No tricks. No conspiratorial deflection. No-one appeared to be able to handle it.

NO! How dare you!
I took the trouble to summarise the entire discussion.
I quoted the original post of Andrew Harding in full.
And I explained with specific quotes how you had used a ‘red herring’ to deflect from his argument.
When Andrew Harding attempted to bring you back to his point you claimed he was off-topic!
He has again returned and iterated his point WHICH YOU ARE TRYING TO OBFUSCATE.
You presented nothing that people appeared unable to handle. You did not make a “clear point” and when Pamela Gray tried to get you to detail your argument YOU refused.
And now you accuse me of creating YOUR red herring and deflection. That is trolling.
Richard

Cream Bourbon
Reply to  richardscourtney
September 29, 2014 12:20 pm

@richardscourtney
Oh, tone down the faux outrage.
To make my point once again in a slightly different way. You said “I quoted the original post of Andrew Harding in full.”
Exactly. You widened the scope of what I was saying so you could drag in other strawman points. I made a point about one detail of Andrew’s post and that was all.
You did take the trouble to summarise the entire discussion and potentially that was a good idea. You spoilt it with a partisan analysis and adding many extras to support your rather biased conclusions.

richardscourtney