Rebuttal to Chen and Tung (2014) highlighted in “Cause for ‘The Pause’ #38 – Cause of global warming hiatus found deep in the Atlantic Ocean”
Numerous scientific papers have reported the hiatus in global surface warming will end with the next El Niño event. But according to a new paper by Chen and Tung published today online in ScienceMag (link to paper follows), that’s not going to happen because the multidecadal variations in ocean heat sequestration at depth in the Atlantic and Southern Oceans will suppress surface warming for a decade or two more. Additionally, unlike many other papers of its kind, Chen and Tung (2014) indicate a lessening in ocean heat sequestration to depth (the reverse of what we’re seeing now) was responsible for the accelerated warming during the latter part of the 20th Century.
Looking at Chen and Tung (2014) in a different light, they went looking for Trenberth’s missing heat, and, not surprisingly, they found it in the same ocean heat content reanalysis (ECMWF ORAS-4) used in Balmaseda et al. (2013), which Trenberth co-authored.
The paper is Chen and Tung (2014) Varying planetary heat sink led to global-warming slowdown and acceleration. The abstract reads (my boldface):
A vacillating global heat sink at intermediate ocean depths is associated with different climate regimes of surface warming under anthropogenic forcing: The latter part of the 20th century saw rapid global warming as more heat stayed near the surface. In the 21st century, surface warming slowed as more heat moved into deeper oceans. In situ and reanalyzed data are used to trace the pathways of ocean heat uptake. In addition to the shallow La Niña–like patterns in the Pacific that were the previous focus, we found that the slowdown is mainly caused by heat transported to deeper layers in the Atlantic and the Southern oceans, initiated by a recurrent salinity anomaly in the subpolar North Atlantic. Cooling periods associated with the latter deeper heat-sequestration mechanism historically lasted 20 to 35 years.
Basically, Chen and Tung (2014) are saying that the vast majority of the human-induced global warming signal can be found in the ocean temperature and salinity data (and reanalysis) for the oceans to depths of 1500 meters. (There’s nothing new about that.) They are also clarifying that naturally occurring variations (that last for multiple decades) in where that ocean heat is sequestered (shallow or deeper layers of the oceans) impacts the rate of global warming at the surface. (There’s nothing new there, either.) During the “latter part of the 20th century” there was “rapid global warming as more heat stayed near the surface” and “[i]n the 21st century, surface warming slowed as more heat moved into deeper oceans.” While this proposal is not new, Chen and Tung (2014) are arguing against El Niño and La Niña as the primary cause and saying the variations in sequestration are occurring in the Atlantic and Southern Oceans…the result, primarily, of Atlantic meridional overturning circulation, with which the Atlantic Multidecadal Oscillation (AMO) is associated. The last little tidbit of value is the time periods of similar past cooling periods, 20 to 35 years, and that’s important because the current hiatus has not lasted that long yet.
Unfortunately, the Southern Ocean is one of the key regions in Chen and Tung (2014). There is so little long-term subsurface temperature and salinity data that far south that any reanalysis of the Southern Ocean before the ARGO floats were deployed (around 2003) has to be viewed as fantasy.
DATA AND REANALYSIS
Chen and Tung (2014) relied on the JMA ocean heat content data (Ishii and Kimoto) along with the COBE sea surface temperature data and on the ORAS-4 Reanalysis from ECMWF. As you’ll recall, a reanalysis is the output of a computer model that uses data as one of its inputs, so it’s not data. We discussed the curious behavior of the ECMWF reanalysis in the post Trenberth Still Searching for Missing Heat. The ECMWF ORAS-4 is forced by volcanic aerosols and ENSO to give it features that do not exist in data. Also see Willis Eschenbach’s post Why Reanalysis Data Isn’t…
Would the results of Chen and Tung (2014) be different if they had used another reanalysis of subsurface temperatures and salinity?
CHEN AND TUNG COMMENT ON OTHER PROPOSED REASONS FOR HIATUS
Chen and Tung (2014) discussed a number of the proposed explanations for the slowdown in surface warming. To these, they stated (my boldface):
Response to solar cycle changes was found to be small (40, 41). The aerosol cooling should have a signature in subsurface ocean (42), and yet it is not seen, perhaps suggesting that the proposed radiative effects may be too small. The second involves ocean heat sequestration: The present work follows the original proposal of Meehl et al. (5, 24) regarding global deep-ocean heat sequestration. However, our observational result does not support their Pacific-centric view. The duration of the cooling periods in the CCSM4 model they used is typically 10 years, with one rare 15-year hiatus in 375 years and none over 15 years. The current hiatus already lasted over 15 years using their definition of hiatus as periods with zero trend. Comparing that model with observation, we found that model’s Atlantic has too little variability with too high frequency (fig.S7 versus Fig. 6). This artifact appears to be attributable to a new overflow parameterization scheme in CCSM4 in the Denmark Strait and Faroe Bank Channel (31).
CHEN AND TUNG CONCLUSIONS
They write:
The fact that the global-mean temperature, along with that of every major ocean basin, has not increased for the past 15 years, as they should in the presence of continuing radiative forcing, requires a planetary sink for the excess heat. Although the tropical Pacific is the source of large interannual fluctuations caused by the exchange of heat in its shallow tropical layer (3), the current slowdown is in addition associated with larger decadal changes in the deeper layers of the Atlantic and the Southern oceans. The next El Niño, when it occurs in a year or so, may temporarily interrupt the hiatus, but, because the planetary heat sinks in the Atlantic and the Southern Oceans remain intact, the hiatus should continue on a decadal time scale. When the internal variability that is responsible for the current hiatus switches sign, as it inevitably will, another episode of accelerated global warming should ensue.
So according to Chen and Tung (2014), an El Niño will only cause a temporary surge in global warming but not impact the multidecadal hiatus. But data contradict them. We know that strong El Niño events are a primary cause of global surface warming. Sunlight-produced warm waters released from below the surface of the western tropical Pacific during strong El Niño events (like ones in 1986/87/88, and 1997/98 and 2009/10) are then distributed to adjoining ocean basins in the wakes of those El Niños, and those El Niño residuals cause blatantly obvious upward steps in the sea surface temperatures of the South Atlantic, Indian and West Pacific Oceans. For more information on how strong El Niños cause those upward shifts, see the illustrated essay The Manmade Global Warming Challenge (42mb pdf).
However, in some respects, the sea surface temperature data for the North Atlantic do agree with Chen and Tung (2014). That is, the surface of the North Atlantic had been warming at a much higher rate than the rest of the global oceans during the satellite era (about 3 times faster)…until about 11 years ago. Since January 2003, the surface of the North Atlantic has been cooling, while the warming has slowed drastically for rest of the global ocean surfaces. (See the graph here.) So the North Atlantic has suppressed global warming for the past 11 years.
And, of course, the sea surfaces of the Southern Ocean show cooling for the entire satellite era, with a big step down in 2006-08.
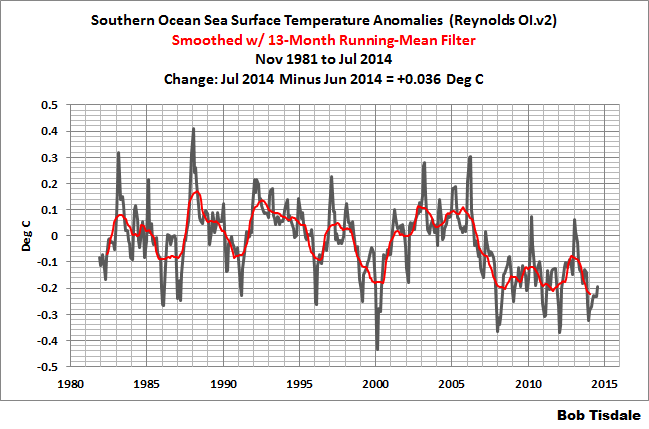
Last, according to Chen and Tung (2014), hiatus periods due to the sequestration of ocean heat to depth in the Atlantic and Southern Oceans can last 20 to 35 years. And they note the current hiatus period has already lasted 15 years. That indicates we’ve got another 5 to 20 years more to go with the current hiatus.
CLOSING
Over the past few years, we’ve seen more and more papers that admit natural variability contributed to the warming from the mid-1970s to the turn of the century and suppressed the warming in the 21st Century. When will the climate science community admit they’d tuned their models to a naturally occurring upswing in the warming of global surfaces from the mid-1970s to the turn of the Century, and as a result their projections of future global warming are way too high? (Answer: Probably not in my lifetime.)
So according to Chen and Tung (2014), an El Niño will only cause a temporary surge in global warming but not impact the multidecadal hiatus. But data contradict them. We know that strong El Niño events are a primary cause of global surface warming.
Data do not yet contradict a claim about the effects of the next El Niño, and I think you actually agree with them that an El Niño now will cause only a “temporary” surge in global warming, and not impact the multidecadal hiatus. You are not expecting a “strong” El Niño, are you?
Steven Mosher says: “err no we dont.”
I’ve been presenting the same story here for more than 5 years, Steven. ENSO acts as a chaotic, naturally occurring, sunlight-fueled, recharge-discharge oscillator. It’s an easy concept to grasp if you ponder it for a moment.
Jim S: Hmmmm seems to me that they have discovered some of the reasons behind the 60-year warming and cooling cycle.
……………..
Not exactly, many others were there years ago, just to mention few: Treguier et al, Levermann et al, Born et al Bachmann etc
60sh years cycles exist in number of other N/ Atlantic events including the Arctic atmospheric pressure, which precedes the N. Atlantic SST by number of years.
“Sunlight-produced warm waters released from below the surface of the western tropical Pacific during strong El Niño events (like ones in 1986/87/88, and 1997/98 and 2009/10) are then distributed to adjoining ocean basins in the wakes of those El Niños, and those El Niño residuals cause blatantly obvious upward steps in the sea surface temperatures of the South Atlantic, Indian and West Pacific Oceans.”
_________________________
If it is the case that ocean water previously heated by sunlight is the cause of the observed warming over the period mentioned (1986-2010), then there should have been a concurrent reduction in ocean heat content over the same period. Charts 1 – 3 here suggest that wasn’t the case: http://www.nodc.noaa.gov/OC5/3M_HEAT_CONTENT/
The release to the surface of heat from “sunlight-produced warm waters” between 1986 and 2010 apparently occurred during a period when ocean heat content at both 0-700 and 0-2000m also increased. How does that work?
Steven Mosher says:
August 21, 2014 at 12:36 pm
settled skeptical science
“We know that strong El Niño events are a primary cause of global surface warming.”
err no we dont.
—————————-
Then why did the Team’s cheerleaders hold out so much hope for a Super El Niño this year finally to end the living nightmare of the “Pause”?
Paul Homewood says: “The AMO won’t go negative for probably another decade. What happens to global temps then?”
The AMO being positive or negative does not reflect the impact of the North Atlantic on global surface temperature. If the North Atlantic is warming faster than the rest of the global oceans, it’s contributing to global warming. If it’s warming slower than the rest of the oceans, then it’s suppressing the warming. If it’s cooling faster than the rest of the global oceans, then it’s contributing to cooling.
The problem with analysis of deep ocean heat is that the ARGO buoys only started being deployed around the year 2000, so its very easy for poor scientific conclusions to be reached by splicing together pre and post ARGO data, such a splicing is almost guaranteed to give the appearance of a change around 2000, exactly when the Pause started.
Been saying pretty much that for the last 5 years.
Question for Bob T (or anyone):
I’ve noticed in your plots of sea-surface temperature data that there is very little evidence for any increase in temperatures. Is that a valid general conclusion? If so it must “prove” that CO2 has had little effect to date, because it can only have had a significant effect via the water vapour evaporation feedback, which must be tiny if the sea-surface temperatures have not changed.
Salvatore Del Prete says: “Is the Atlantic Meridional Over Turning Circulation (AMOC) the same as the Atlantic Multidecadal Oscillation? (AMO) Thanks”
What a coincidence. I recently finished a chapter in my new book about AMO and AMOC.
The Atlantic Multidecadal Oscillation (AMO) is typically defined as the multidecadal variations in the sea surface temperature anomalies of the North Atlantic. It’s normally presented by detrending the North Atlantic sea surface temperature anomalies (ESRL method) or by subtracting global sea surface temperature anomalies from North Atlantic data (Trenberth method).
On the other hand, Atlantic Meridional Overturning Circulation (AMOC) generally refers to the impacts of thermohaline circulation in the North Atlantic, where cool and salty (dense) waters sink at high latitudes and reemerge from the deep at low latitudes. See the NSIDC Environment: climate webpage here:
http://nsidc.org/cryosphere/seaice/environment/global_climate.html
It has a nice description of this process under the heading of Atmosphere and Ocean Circulation. There they write:
“Ocean currents transport heat from the equator to the poles through a heat- and saline-driven process called thermohaline circulation. Warm water moves from the equator northward along the ocean surface and eventually cools. As it cools, it becomes dense and heavy and sinks. This cold water then moves south along the lower part of the ocean and rises near the equator to complete the cycle.”
Is the current speeding up or slowing down?
Nature 2014 Atlantic current strength declines
“But since 2004, ocean sensors have detected a significant decline in the strength of the currents”
“From mid-2009 to mid-2010, for example, the circulation slowed to two-thirds of its usual strength ”
“RAPID measurements previously revealed1 that the circulation weakened by 3% per year on average between 2004 and 2008, with a mean strength of 17.5 million cubic metres per second. Most of the past decade’s observed decline occurred between April 2008 and March 2012, when the AMOC was around 15% weaker on average than in the previous four years. The measurements also showed that the strength of the currents varied by up to 70% from year to year, depending on wind and seawater temperature “
MikeUK says: “I’ve noticed in your plots of sea-surface temperature data that there is very little evidence for any increase in temperatures.”
You’ll need to be a little more specific, MikeUK. What time period and which ocean basin?
http://bobtisdale.wordpress.com/2014/08/11/july-2014-sea-surface-temperature-sst-anomaly-update/
One thing is certain, the global sea surface temperatures during the satellite era warmed at half the rate predicted by the IPCC’s climate models.
Basically, Chen and Tung (2014) are saying that the vast majority of the human-induced global warming signal can be found in the ocean temperature and salinity data (and reanalysis) for the oceans to depths of 1500 meters.
——————————————————–
Temperature of ocean waters below a few hundred meters is already too low to heat any but the polar regions of the earth surface. Any heat that got deposited at greater depths won’t be back to bother us unless the second law of thermodynamics is repealed. Poor Trenberth. His heat is gone.
Paul Homewood says:
August 21, 2014 at 12:48 pm
The AMO won’t go negative for probably another decade.
……………………
Last positive section was about 35, and negative about 30 years long, matched exactly by the Arctic atmospheric pressure (which leads the AMO by a number of years (see last graph in my link above), and the Arctic atm pressure is on the verge of going ‘negative’.
If history is about to repeat itself, the AMO has at the most 4-5 years, although its next 9 year cycle is likely to break for 2-3 years in the positive sector. The October to March section might go over even sooner.
It is reasonable to look at a big heat source- the pacific oscillations, as a source for global temperature. Not certain why that is controversial, expecially since the paper this post is based on posits the pacific oscillation as a big influence on temps.
Correction : The answer is: Not in their lifetime. [from Max Planck]
DavidR says: “If it is the case that ocean water previously heated by sunlight is the cause of the observed warming over the period mentioned (1986-2010), then there should have been a concurrent reduction in ocean heat content over the same period. Charts 1 – 3 here suggest that wasn’t the case: http://www.nodc.noaa.gov/OC5/3M_HEAT_CONTENT/ ”
You can never look at an ocean temperature-related dataset on a global basis and hope to determine why the oceans warmed, DavidR. To do that, you need to divide the data into logical subsets.
The tropical Pacific is where El Niño and La Niña events take place. The TAO project buoys have only had complete coverage of a good portion of that subset since the mid-1990s, so consider that when looking at the next graph. It’s the NODC ocean heat content for the tropical Pacific (red curve) compared to the sea surface temperatures there (brown curve).
http://bobtisdale.files.wordpress.com/2013/03/15a-trop-pac-comparison-sst-ohc-nodc.png
Tropical Pacific OHC cooled (not warmed) from the late 1950s to the early 1970s, and then warmed in response to the 1973-76 La Niña. The tropical Pacific OHC then cooled (not warmed) again (with dips and rebounds caused by El Niños and La Niñas) until the mid-1990s. (Now is when the OHC data there becomes more reliable.) The ocean heat content for the tropical Pacific surged upwards in response to the 1995/96 La Niña, in effect creating an upward step in the ocean heat content there. All of that newly created warm water (it only took about one year) provided the fuel for the 1997/98 super El Niño, which caused a significant drop. The 1998-01 La Niña then recharged that warm water. And basically, after that, the ocean heat content of the tropical Pacific has been declining (not warming).
There’s no reason to look at the OHC data south of the tropics before the ARGO floats were deployed, because there’s so little source data. So let’s look at the OHC data for extratropical North Pacific.
http://bobtisdale.files.wordpress.com/2013/03/24-n-pac-ohc-w-climate-shift.png
I’ve highlighted a two-year period on the graph. Before the late 1980, the ocean heat content of the extratropical Pacific cooled, and it cooled so much that if you remove that two-year period from the data, the ocean heat content of the extratropical North Pacific would still show a long-term cooling:
http://bobtisdale.files.wordpress.com/2013/03/25-n-pac-ohc-w-o-shift.png
So what caused the sudden surge? There’s a similar upward step in the sea surface temperatures of the extratropical North Pacific, and according to Trenberth and Hurrell (1995)…
http://www.cgd.ucar.edu/cas/jhurrell/Docs/trenberth.decadal_variations.climdyn94.pdf
…there were two culprits: a shift in sea level pressure (which alters wind patterns) and the 1986/87/88 El Niño.
Now, here’s the best part. The ocean heat content for the tropical Pacific and extratropical North Pacific both show multidecadal periods of cooling, interrupted by sudden warming surges caused by natural factors. In other words, there is no evidence of a manmade global warming component in either subset. But if we combine those two subsets, we see a magical transformation. The global ocean heat content (which everyone assumes shows a gradual rise) mimics the combined ocean heat content of the tropical Pacific and extratropical North Pacific.
http://bobtisdale.files.wordpress.com/2013/03/26-pacific-v-global-ohc.png
Those graphs are from this post:
http://bobtisdale.wordpress.com/2013/03/11/is-ocean-heat-content-data-all-its-stacked-up-to-be/
And that discussion is also presented in the essay linked to the post. Here’s a link again:
http://bobtisdale.files.wordpress.com/2013/01/the-manmade-global-warming-challenge.pdf
Matthew R Marler says: “You are not expecting a ‘strong’ El Niño, are you?”
I wasn’t necessarily talking about the one this year, which we haven’t seen yet.
Cheers.
Steve Mosher says “err no we dont.” you should have said “err I don’t”
Read: http://bobtisdale.files.wordpress.com/2013/01/the-manmade-global-warming-challenge.pdf
Does anybody remember this paper http://depts.washington.edu/amath/old_website/research/articles/Tung/journals/Tung_and_Zhou_2013_PNAS.pdf ?
There was also a follow-up published this year: http://www.earth-syst-dynam-discuss.net/5/529/2014/esdd-5-529-2014-print.pdf.
It’s gonna get a lot more interesting when scientists like Carl Wunsch cannot be ignored any longer.
The statistically steady ocean circulation appears to be a mechanically forced phenomenon; despite its transport of enormous amounts of heat energy, it is not buoyancy-driven. Its essential energetics are the conversion of kinetic energy of the wind and tides into oceanic potential and kinetic energy through the generation of the large-scale circulation. Heating/cooling/evaporation/precipitation directly affect the ability of the wind to create potential energy, but they are only slightly involved in the energy cycle, possibly even reducing the potential energy.
The energy contained in the large-scale circulation (mainly, but not solely, potential) is converted into kinetic energy in the interior through baroclinic and barotropic instabilities. (Spin-up of the ocean from rest is a completely different process.)
http://ocean.mit.edu/~cwunsch/papersonline/wunschferrari2004.pdf
But do GHG cause el Ninos?
There have been four el nino events since “pause” began. The steps are an optical illusion. El ninos don’t cause steps, they’re temporary noise. Increases caused by AMO/tilt in axis.
All you need to do is adjust the hiatus up and the uncertainty down and you’ll get to ‘unabated’, an approach seemingly favoured by one or two over in the quite amusing comments section of the Guardian’s article on this
Bob,
Thank you for the comprehensive reply.
Maybe it’s just me, but I still don’t see how stored ocean heat can cause net warming of global atmosphere without a corresponding net loss in global ocean heat content. If I hold an ice cube in my hand I can see that it melts; but I also feel, very acutely, that the energy causing the melting comes at a cost to me (a cold hand!).
Even if the heat was transferred from the ocean to the atmosphere only in a specific region, as you suggest, this still doesn’t explain the observed concurrent increase in both global ocean and global atmospheric heat content globally since 1986. One should come at a cost to the other, unless there is an outside influence on the entire system.
Claiming that the observed warming arose from a source that is itself observed to be still warming smacks of ‘free energy’, as far as I can see. We require an explanation that accounts for *both* increased ocean and atmospheric heat content since 1986.