Sun said to be “bi-modal”
While many, including the IPCC, suggest the modern Grand Maximum of solar activity from 1950-2009 has nothing to do with the 0.4C global warming measured over that time frame, it does seem to be unique in the last three millennia.
from CO2 Science: A 3,000-Year Record of Solar Activity
What was done
According to Usoskin et al. (2014), the Sun “shows strong variability in its magnetic activity, from Grand minima to Grand maxima, but the nature of the variability is not fully understood, mostly because of the insufficient length of the directly observed solar activity records and of uncertainties related to long-term reconstructions.” Now, however, in an attempt to overcome such uncertainties, in a Letter to the Editor published in the journal Astronomy and Astrophysics, Usoskin et al. “present the first fully adjustment-free physical reconstruction of solar activity” covering the past 3,000 years, which record allowed them “to study different modes of solar activity at an unprecedented level of detail.”
What was learned
As illustrated in the figure below, the authors report there is “remarkable agreement” among the overlapping years of their reconstruction (solid black line) and the number of sunspots recorded from direct observations since 1610 (red line). Their reconstruction of solar activity also displays several “distinct features,” including several “well-defined Grand minima of solar activity, ca. 770 BC, 350 BC, 680 AD, 1050 AD, 1310 AD, 1470 AD, and 1680 AD,” as well as “the modern Grand maximum (which occurred during solar cycles 19-23, i.e., 1950-2009),” which they describe as “a rare or even unique event, in both magnitude and duration, in the past three millennia.”
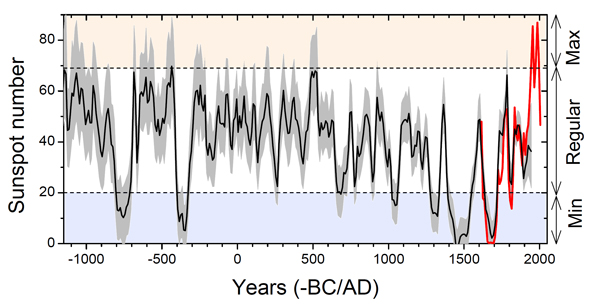
Further statistical analysis of their reconstruction revealed the Sun operates in three distinct modes of activity – (1) a regular mode that “corresponds to moderate activity that varies in a relatively narrow band between sunspot numbers 20 and 67,” (2) a Grand minimum mode of reduced solar activity that “cannot be explained by random fluctuations of the regular mode” and which “is confirmed at a high confidence level,” and (3), a possible Grand maximum mode, but they say that “the low statistic does not allow us to firmly conclude on this, yet.”
What it means
Usoskin et al. (2014) write their results “provide important constraints for both dynamo models of Sun-like stars and investigations of possible solar influence on Earth’s climate.” They also illustrate the importance of improving the quality of such reconstructions, in light of the fact that previous reconstructions of this nature “did not reveal any clear signature of distinct modes” in solar activity.
Unfortunately, it was beyond the scope of this paper to address the potential impact of solar activity on climate. Yet the reconstruction leaves a very big question unanswered — What effect did the Grand maximum of solar activity that occurred between 1950 and 2009 have on Earth’s climate? As a “unique” and “rare” event in terms of both magnitude and duration, one would think a lot more time and effort would be spent by the IPCC and others in answering that question. Instead, IPCC scientists have conducted relatively few studies of the Sun’s influence on modern warming, assuming that the temperature influence of this rare and unique Grand maximum of solar activity, which has occurred only once in the past 3,000 years, is far inferior to the radiative power provided by the rising CO2 concentration of the Earth’s atmosphere.
Reference
Usoskin, I.G., Hulot, G., Gallet, Y., Roth, R., Licht, A., Joos, F., Kovaltsov, G.A., Thebault, E. and Khokhlov, A. 2014. Evidence for distinct modes of solar activity. Astronomy and Astrophysics 562: L10, doi: 10.1051/0004-6361/201423391.
Abstract
Aims. The Sun shows strong variability in its magnetic activity, from Grand minima to Grand maxima, but the nature of the variability is not fully understood, mostly because of the insufficient length of the directly observed solar activity records and of uncertainties related to long-term reconstructions. Here we present a new adjustment-free reconstruction of solar activity over three millennia and study its different modes.
Methods. We present a new adjustment-free, physical reconstruction of solar activity over the past three millennia, using the latest verified carbon cycle, 14C production, and archeomagnetic field models. This great improvement allowed us to study different modes of solar activity at an unprecedented level of details.
Results. The distribution of solar activity is clearly bi-modal, implying the existence of distinct modes of activity. The main regular activity mode corresponds to moderate activity that varies in a relatively narrow band between sunspot numbers 20 and 67. The existence of a separate Grand minimum mode with reduced solar activity, which cannot be explained by random fluctuations of the regular mode, is confirmed at a high confidence level. The possible existence of a separate Grand maximum mode is also suggested, but the statistics is too low to reach a confident conclusion.
Conclusions. The Sun is shown to operate in distinct modes – a main general mode, a Grand minimum mode corresponding to an inactive Sun, and a possible Grand maximum mode corresponding to an unusually active Sun. These results provide important constraints for both dynamo models of Sun-like stars and investigations of possible solar influence on Earth’s climate.
Ren and this is what is happening as we speak. Look at the atmospheric circulation changes post 2005.
According to Usoskin et al. (2014), the Sun “shows strong variability in its magnetic activity, from Grand minima to Grand maxima, but the nature of the variability is not fully understood, mostly because of the insufficient length of the directly observed solar activity records and of uncertainties
related to long-term reconstructions.” Now, however, in an attempt to overcome such uncertainties, in a Letter to the Editor published in the journal Astronomy and Astrophysics, Usoskin et al. “present the first fully adjustment-free physical reconstruction of solar activity” covering the past 3,000 years, which record allowed them “to study different modes of solar activity at an unprecedented level of detail.”
MY COMMNETARY
Exactly and this is from the article just posted today.
What effect did the Grand maximum of solar activity that occurred between 1950 and 2009 have on Earth’s climate? As a “unique” and “rare” event in terms of both magnitude and duration, one would think a lot more time and effort would be spent by the IPCC and others in answering that question. Instead, IPCC scientists have conducted relatively few studies of the Sun’s influence on modern warming, assuming that the temperature influence of this rare and unique Grand maximum of solar activity, which has occurred only once in the past 3,000 years, is far inferior to the radiative power provided by the rising CO2 concentration of the Earth’s atmosphere.
So maximum solar activity and maximum CO2 concentration approximately coincide, and neither one of them seems to be associated with past epochs of warming: does anyone see the Minoan warm period, Roman warm period or Medieval warm period in that graph? How about the post RWP, “Wasteland” epoch?
Dr. Brown
Thanks for the comments and a new perspective.
Prompted by your comment referring inconsistency of obvious internal organisation I had another look at the sunspots polarity diagram (my earlier comment related to sunspot polarity considerations), it looks as some internal organisation does exist but only in the odd numbered cycles, as shown in the
modified illustration
while no such pattern is obvious among even cycles.
‘Organisation’ of groups of 4 rising cycles persisted since 1700 all the way to 1960, but appears to reverse after cycle19 into group of falling cycles.
If above is taken as valid then:
– SC19 was a pivotal cycle if ‘bi-modal’ activity existed
– The odd cycles are (possibly, very speculative this) result of an external, say astronomic synchronisation, while the even cycles are under influence of the internal ‘more chaotic’ solar cycling process.
The above ‘internal organisation’ would also imply:
– SC25 (odd cycle, with presumed max around yr 2025), would be indeed low
– SC26 (even cycle, max ~ yr 2035), uncertain
– SC27 (odd cycle, max mid 2040s) with high Rmax ~150.
How drastic Ren? I’m sitting here waiting out the rain again. It just rains and rains and rains and rains. And the mobi-ticks just get bigger and bigger and bigger…
Ever once in a while you hear a crack, creak and thump as a 2012 drought killed tree falls onto the ground.
rgb says “We don’t need to assert that this will definitely affect climate because we have no modern, trustworthy, observational evidence to prove the argument one way or the other. We lack working models for the climate even when we use enormous computers to try to build them.”
Just this once I have to differ with rgb: we do have the evidence for solar influence over climate.
Here’s a clue: http://stevengoddard.wordpress.com/2013/08/17/1957-extreme-heat-drought-melt-thunderstorms-at-the-north-pole/ when, during the highest solar cycle ever recorded, the sun’s energy roasted the northern polar region.
The secret to understanding the sun’s influence on climate and it’s cause of global warming is hidden in this graph: http://climate4you.com/images/SunspotsMonthlySIDC%20and%20HadSST3%20GlobalMonthlyTempSince1960%20WithSunspotPeriodNumber.gif
The answer to this mystery is being written up and will be posted as soon as I can finish writing it, and the sunspot reconstruction isn’t involved, and whether there was or wasn’t a “grand” solar maximum isn’t involved either, as the word “grand” adds nothing to ‘just the facts’.
I do agree with rgb in that there really is nothing to worry about. He’s right, it is what it is. It has just not been properly understood in the context of solar energy accumulation in the world ocean.
What was done
Without the whole paper, this is impossible to evaluate.
Matthew R Marler says:
August 7, 2014 at 8:47 am
I do. Nothing in the SSN chart is against those warm & cold phases. SSN isn’t the only parameter. The UV component of TSI also counts, as do a variety of modulating factors.
The cold periods show up more starkly as Minima & Grand Minima in the SSN graph than the warm periods, which aren’t necessarily associated with Grand Maxima, just Maxima & prolonged intervals of elevated numbers.
Dr Norman Page says:
August 7, 2014 at 8:12 am
Lockwood et al 2014 in press say in their abstract: http://www.eiscat.rl.ac.uk/Members/mike/publications/pdfs/2009/Lockwood_ApJ_openflux_F1.pdf
From 2009 and not 2014…
And your post is a good example of confirmation bias.
Leif Svalgaard: In addition, it seems to me that the notion of a bimodal sun is not supported by the data. There is a continuum of cycle sizes from small to large. What Usoskin et al. probably mean is simply that Grand Minima are special, somehow. And we slide smoothly into and crawl smoothly out of a Grand Minimum, not abruptly [Vaquero et al.].
Yes.
Sometimes the solar activity is way above average, sometimes its below average, and mostly it’s within a standard deviation of average. You can’t tell anything from the graph, but perhaps the random variation has heavier tails than a Gaussian distribution.
Another possibly fruitful field of climate studies derailed by the CO2 Express is the question of tides on the sun raised by the planets & the possible effect thereof on SSN:
http://adsabs.harvard.edu/full/1927PASP…39..228L
http://onlinelibrary.wiley.com/doi/10.1111/j.2153-3490.1968.tb00381.x/pdf
http://link.springer.com/article/10.1007%2Fs11207-013-0288-6#page-1
Leif Svalgaard: http://www.leif.org/research/What-Geomagnetism-can-Tell-Us-about-the-Solar-Cycle.pdf
Thank you for the link.
vukcevic says:
August 7, 2014 at 8:48 am
Prompted by your comment referring inconsistency of obvious internal organisation I had another look at the sunspots polarity diagram (my earlier comment related to sunspot polarity considerations), it looks as some internal organisation does exist but only in the odd numbered cycles
There is no evidence or reason for this. As usual, you are peddling pseudo-science.
Ilya responds to Leif on Finnish neutron monitor on WUWT:
http://tallbloke.wordpress.com/2012/11/21/ilya-usoskin-vs-leif-svalgaard-oulu-neutron-monitor-data-quality/
Milo, solar tides have been discussed on this blog in the past. Its magnitude is known as well as its affects on Earth.
Went looking for a graph showing the large annual TSI variance that was mentioned somewhat recently, searched for “leif annual TSI variability” and found:
http://climateaudit.org/2007/11/30/svalgaard-solar-theory/
Last two paragraphs (some odd non-displaying characters showed up and were replaced with hopefully-correct punctuation, I’m sure the author will correct me):
Nearly seven years later, still true and still on track. Thus doing much better than the climate models.
Pamela Gray says:
August 7, 2014 at 9:32 am
I know they have, but my point is that it offers an explanation for the observed minima & maxima. No doubt internal solar fluctuations are also important.
On whatever climatic time scale you chose, from tens to billions of years, solar system & galactic factors influence change here on earth & the other planets, which in turn affect the sun.
milodonharlani says:
August 7, 2014 at 9:30 am
Ilya responds to Leif on Finnish neutron monitor on WUWT:
Yes, he is very sensitive about that. The fact is that at some stations [e.g. his at Oulu] the cosmic ray flux has been increasing, at some [e.g. at Thule, Greenland] there has been no long-term trend, and at some [e.g. South Pole] the flux has been decreasing. This IMHO means that we cannot simply blame the sun for all of these contradictory results. Some instrumental, atmospheric, or otherwise not-understood effect is at play.
Leif Svalgaard says: August 7, 2014 at 9:27 am
vukcevic says:
http://wattsupwiththat.com/2014/08/06/recent-paper-finds-recent-solar-grand-maximum-was-a-rare-or-even-unique-event-in-3000-years/#comment-1703735
(it looks as some internal organisation does exist but only in the odd numbered cycles)
There is no evidence or reason for this. As usual, you are peddling pseudo-science.
……….
Evidence of ‘internal organisation’ (using term introduced by Dr. Brown) plainly does exist within odd numbered cycle as shown in the link (my comment above)
A correct and more informative statement would have been:
There is no reason for this, that I (i.e. Dr. Svalgaard solar scientist) know of, therefore until such reason is found it can’t be accepted as a valid science.
Milo, you are walking way out into unsupported random speculation. So what is your point? How does Earth and other planets affect the sun? And does this speculation have anything at all to do with Earth’s temperature trends?
Dr Norman Page: http://onlinelibrary.wiley.com/doi/10.1002/2014JA019973/pdf )
There does not seem to be any association with Earth climate: the state estimates for the Early 20th and early 21st centuries are similar.
“Steven Mosher says:
“there is no modern maximum.”
Sounds like denial to me. So just what should we call it? A hockey stick?
###################################
1. I have read everything that Leif has posted on his research
2. he went back to the ‘raw’ observer reports.
3. He reworked the sunspot series using a clear open methodology.
4. He TESTED his approach by doing a blind study.
5. He validated his reconstruction by comparing other measures.
6. He is working openly with others in the field.
So I am faced with this choice.
A) DO HIS WORK OVER and find his error
B) Accept his conclusions as the best explanation.
I choose B.
Now, I could attack him personally. I could accuse him of “changing the past”. I could refuse to look at his work because it destroys my cherished notions. I dont do those things.
I read his work. I asked the question? do I see any place where he might have made a mistake?
No. Am I willing to REDO the work in the hopes that I might find something? no.
I look at the work of those he challenges. His work is more open, more comprehensive.
I think I am justified in accepting his work as the best. Could it be wrong? sure.
But as it stands its the best work on the problem I have seen.
kadaka (KD Knoebel) :
http://climateaudit.org/2007/11/30/svalgaard-solar-theory/
good find.
Pamela Gray says:
August 7, 2014 at 9:48 am
It’s not speculation. It’s scientific investigation, dating back at least to the 1920s, as shown by my links from three decades in two centuries.
To answer your other question, yes, solar & cosmic influences are strongly correlated with climatic change & well supported explanatory mechanisms have been proposed & are being investigated further by real scientists, not CACA spewing charlatans.
vukcevic says:
August 7, 2014 at 9:46 am
A correct and more informative statement would have been:
There is no reason for this, that I (i.e. Dr. Svalgaard solar scientist) know of,
More importantly, there is no evidence for it.