There’s an information war on the recent Antarctic sea ice records
Guest essay by Frank Lansner
Today Cryosphere reports 2,112 million km2 more sea ice around Antarctica than normal.

Fig 1
Reality is that we right now have an area matching the size of Greenland of extra sea ice floating around Antarctica. The nightmare for the global warming believers is if the growing ice around Antarctica should be linked to cooling, and so:
1) Some Re-analysis papers and more have been made showing that the ocean around Antarctica is not cooling (as original data suggests) but is in stead warming fast.
2) Several mechanisms have been suggested to argue how come ice can grow so much faster when in fact the water is supposed to have warmed up.
Therefore in the following I will first (part 1) go through some data sources to evaluate if it’s cooling or not in the area of ice-formation around Antarctica, and then (part 2) I will go through the most frequent attempts to explain faster ice formation in supposedly warmer waters.
PART 1: ARE THE OCEANS AROUND ANTARCTICA WARMING OR COOLING?

Fig 2
The red box: I have inserted the red box 73S-63S 220W-50E because this area will be used in the following to evaluate the situation in the ice forming waters around Antarctica.
NOAA use a base period approx. 1983-1995 and they report that the waters around Antarctica today are colder than normal. In fact this is the case most of the time in the last decade in NOAAs graphics, especially in the zone where extra winter ice is being formed.

Fig 3
CMC Canada use base period 1995-2009, but still we see temperatures of the ice forming waters near Antarctica are lower than normal.
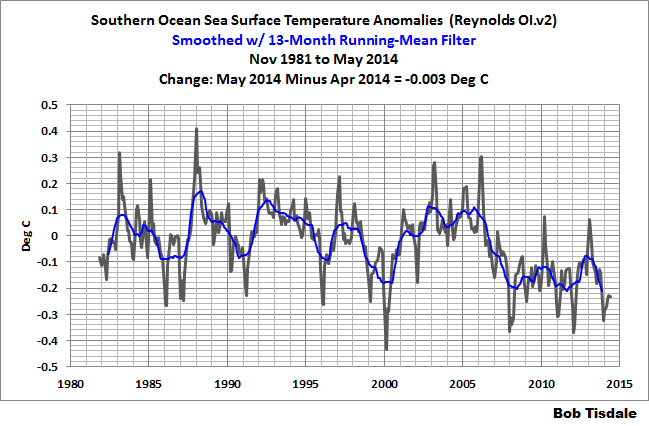
SST
NCDC ERSST v3b2

Fig 4
I use the KNMI online climate explorer to get data from the “red box” area 73S-63S 220W-50E, see fig 2.
HadISST1:

Fig 5
Fine agreement with NSDC.
TAO buoys surface air temperature:
[figure 6 was in error, and the error originated at KNMI, as you can see below and also in comments (h/t to Bob Tisdale for his interaction with KNMI to get to the root of the problem):

Bob Tisdale writes in email to me:
The problem was that Frank uncovered a problem with the KNMI Climate Explorer when he tried (and was successful) to extract what he thought was “TAO Air Temp” data for the Southern Ocean, from a dataset that only includes data for the tropical Pacific.
The data in Frank’s Figure 6 wasn’t data for the Southern Ocean, it was tropical Pacific data. That was the glitch at KNMI. I notified KNMI. They corrected the problem and we can only get data from that dataset at KNMI when the correct tropical Pacific coordinates are used…thus the error message you just got.
We hope to add a corrected graph from KNMI soon – Anthony]
Fig 6
Again, Cooling.
The SST´s and to some degree surface air suggest a drop in temperatures especially around 2008
TLT, Air temperature lower troposphere from RSS:

Fig 7
Data suggest some cooling, certainly not warming.
Thus it seems that recent years for the area of ice formation around Antarctica show:
A: Decrease in Sea surface temperatures
B: Decrease in Air temperatures
C: Growth in Sea ice
These observations are in compliance, I´d say generally in science you can hardly demand more solid evidence to support any conclusion.
* * * It’s getting colder around Antarctica and so the ice is growing * * *
PART 2: MORE ICE CREATION IN STILL WARMER WATERS?
None the less alarmist sites like “Skeptical science” in stead seem to disregard the above conventional data sources and use exclusively projects that somehow ends up showing warming around Antarctica.

Fig 8
Left: Zhangs Re-analysis ending in 2004. Right: NASA´s Earth Obs, ending in 2007.
Zhang achieves a stunning 4-5 K/century warm trend around Antarctica, and NASA perhaps a little less. Notice the “Horse shoe” shape on Zhangs illustration, left. This is the area that I have used for all graphs above. Right: NASA is using infared measurement of the very surface meaning that their data represents the extremely thin top layer ( 1 mm ? ) of the land or ocean surface. The so called “skin layer”.
Such an extremely thin skin layer is much more vulnarable to changes in precipitation or winds than any of the more conventional datasets I have shown in this writing, and the skin layer represents much less mass. More wind in an area of below freezing air temperature is likely to yield warmer skin layer due to mix with warmer water. Here are some attempts to explain matters as I have seen them in debates and on alarmist sites like “Skeptical Science”.
“More precipitation”
Since rain is ice- enemy number one, we will have to assume that this increased precipitation comes as (cold) snow?
In the Antarctic winter air temperatures are low. Snow landing on sea ice will opbviously insulate the ice from cold air temperatures. So how come more snow (precipitation) should increase sea ice areas?
The addition of fresh water should lower salinity and increase the freezing temperature of the water and thus create more ice. But can precipitation really change salinity notably in the deep ocean hundreds or thousands kilometers from the shore?
“Salinity”
The thing is, I don’t see many actual graphs of the salinity that is supposed to be decreasing fast in order to increase freezing temperatures notably.
If Salinity is really the key argument in explaining more ice growth combined with more heat, then why don’t we see several climate institutions focus on Salinity graphs?

Fig 9
From the KNMI online service it is actually possible to retrieve a salinity graph, “EN3”.
SSS = Sea Surface Salinity
The freezing point of water increase approx. 0,7 K per 1% fall in salinity.
From the Salinity data we learn that:
1) Variation is small: From 3,385 % to 3,399 %, that is 0,014 mass % over the years.
Not too surprising since we are in the middle of the deep ocean. Varitaion corresponds to a 0,01 K change in freezing point.
2) To explain MORE ice formation over the years we needed to see LESS salinity.
Problem is, the waters around Antarctica show increased salinity.
In other words:
Variations in salinity are TOO SMALL to even be considered in the first place.
And on top of this, waters are actually getting slightly more salty, thus lowering the freeze point a tiny bit. This would explain a tiny reduction in ice formation, not the opposite.
“The Ozone concentraion has declined”
Ozone concentrations has stagnated since the early 1990´ies.
But in recent years something changed.
KNMI MSR Ozone:

Fig 10
Since 2011 the ozone concentration has increased fast. The extra ice formations are sometimes explained with the drop in ozone concentration, but in recent years the development has reversed.
So in order to maintain ozone as an explanation for more ice around Antarctica you will have to claim that this effect of Ozone works whenever ozone concentrations make any change at all.
“The winds did it”
The supposed role of ozone is to trigger winds and the winds are supposed to be much stronger now when the ice area is growing faster.
So the explanation goes that even though we have a strong warming, and thus supposedly warmer waters around the Antarctic, then winds blow out ice from the Antarctic main land so that this ice will end up in waters that are quite warm. And then this ice is not melting fast as one might expect? I’m not sure if I got that explanation right…
Anyway if this was true we would see that and the ice was pushed out into warmer waters, and there would be no ice formation near the edge of the ice. In fact there should be at least some melting.

Fig 11
The illustration from NRL show actual temperatures and the question is: Are huge ice masses pushed out from the mainland Antarctica to be surrounded by warmer waters?

This color is zero degrees Celsius, so the ice is today clearly surrounded by waters well below zero degrees.
So at least at first glance the suggestion that ice is not formed on the edge but in stead being pushed out from land to warmer waters appears not supported, but what really we need is an investiagation that actually proofs or disproofs this idea and show a well supported estimate of how much ice is being formed this way.
Conclusion:
The conventional data sources like SST, MAT suggest that the bulk of the ocean surface mass is cooling in recent years accompanied by faster ice growth. Arguments based on Ozone or Salinity or precipitation appears not to be linked to the record levels of sea ice formation around Antarctica.
It is therefore fair to say the obvious:
* * * It’s getting colder around Antarctica and so the ice is growing * * *
Discover more from Watts Up With That?
Subscribe to get the latest posts sent to your email.
At any temperature below freezing, with the relative humidity below 100%, ice will sublime directly to vapor and skip the liquid phase all together. That’s why ice cubes disappear from the ice tray in your freezer, even though the temperature is around 10F (or so).
Walter Allensworth says:
July 2, 2014 at 2:19 pm
“Excellent post that addresses all of the unicorn dung that I’ve been reading and hearing about why the world is getting warmer which should result in the Antarctic growing more ice. Nice to see the salinity argument debunked.”
Im very happy that you find this writing helpfull , and your point is exactly my motivation.
Antarctica is so terribly cold that a warming world should make it grow even if it stays the same temperature, just like a freezer ices up more in humid summers than in dry winters. This is well known in climate “science” departments but it’s not good for the public to know, you see.
It’s always nice to read one of Frank’s posts. We don’t hear from him often enough.
Soooo if the oceans around Antarctica cool then the sea ice will be reduced? Or will it increase and reduce at the same time? Hey, this is Climastrology for ya. But what about the air temperature?
CAGW has moved from the scientific & the political into the financial realm at BBC & most MSM:
AUDIO 18 MINS: 2 July: BBC Business Daily: Ed Butler: Future of Coal
There are dire warnings about the heating of the planet. Coal is a significant contributor to global warming. So what is the future of this increasingly controversial fuel?
BUTLER: IEA tells us it is time for a carbon tax.
***BUTLER quotes American writer, Upton Sinclair: “It is difficult to get a man to understand something, when his salary depends upon his not understanding it!”)
(BUSINESS ADVISOR- potential for 300 foot ocean rise, extenction of everything on the planet, this is based in history; so catastrophic, people say “i might as well live it up”)
BUTLER: what is the sensible, sane reaction to that?
(BUSINESS ADVISOR): first reaction is let’s have a drink til it’s over, but the sane reaction is to aggressively get off coal, natural gas, oil…go to nuclear, solar, wind & hydro, but we have to stop using fossil fuels. must avoid Easter Island’s fate.
BUTLER: 3 heavyweights from both sides of US political divide – Paulson, Bloomberg & Steyer, issued a major report last week…
11.35 Lord Nicholas Stern:
BUTLER: Stern says biggest cause for optimism over coal comes from China, which alone was responsible for burning 50 percent of coal through its power stations. he (Stern) told me things were changing there…should reach peak coal use in 10 years.
STERN climate fatigue is more in Europe than in US, must accelerate investment in renewables…
risks are bigger than we recognised in 2006 & some effects of CAGW are happening faster e.g. THE MELTING OF THE POLAR ICE…
http://www.bbc.co.uk/podcasts/series/bizdaily
But all the world’s best Climastrologists disagree with this illogical statement.
On the salinity issue, shouldn’t Greenland’s peripheral ice be growing too? Or is that warmcold salty lessmore?
>The problem with that is that water coming off the land were is fresh water. Which it is. Fresh water has a higher freezing temperature than salt water. In and Antarctic when fresh water flows into the salt water it freezes almost instantly.
This sounds absurd? Isn’t that sea ice shelf at least dozens of miles wide? How is the glacier ice melting during their winter when it’s well below freezing?
By the way the IPCC says that most of the models it uses project a decrease in extent. So those that provide excuses are at loggerheads with the IPCC. Even if the salinity argument is correct imagine what all that extra albedo is doing in the SH spring and early summer. They talk about Arctic amplification, so is this the reverse?
strawbale23 says:
July 2, 2014 at 1:11 pm
Isn’t total antarctic volume/m3 more important as an indicator than ice area?? Or at least as important, when looking at antarctic ice shouldn’t area and volume be looked at together to get a coherent picture?
Correct me if I’m wrong, but if extent and/or area is increasing, wouldn’t it’s volume also increase?
“…. 2,112 million km2 more sea ice around Antarctica than normal.”
WTF? Why is the 1979-2008 mean “normal” ?
Does that just happen to be the perfect ice area of SH when the earth is in equilibrium with nature and the universe?
This site has, for at least the last 5 years, been decrying the warmists saying the Arctic X million km^2 “below normal” . Now you are adopting the same nonsensical terminology.
“At any temperature below freezing, with the relative humidity below 100%, ice will sublime directly to vapor and skip the liquid phase all together. That’s why ice cubes disappear from the ice tray in your freezer, even though the temperature is around 10F (or so).”
And I thought they disappeared because I took them out and put them into drinks.
“It’s getting colder around Antarctica and so the ice is growing.”
Further evidence is given in the study below, showing that increases locally happened exactly where it got colder.
http://notalotofpeopleknowthat.wordpress.com/2013/08/17/study-finds-antarctic-sea-ice-increases-when-it-gets-colder/
Frank ´Lansner says: “The data shown have some similarity to SST´s in the area, so please ask which data it is then that they have used.”
Frank, you apparently did not comprehend my comment. The TAO project data you are looking at is for the tropical Pacific, not the Southern Ocean. The graph you presented includes data for the tropical Pacific only. If you had bothered to scroll down to anomalies when you created your Figure 6, this is the graph you would have seen:
It bears a striking similarity to an ENSO index, because it’s from the equatorial Pacific. But it bears no similarity–no similarity whatsoever–with the sea surface temperature anomalies for the Southern Ocean:
Goodbye, Frank. Please correct your error in your post.
they hinge their position on antarctic ice mass loss and GRACE, anything else is just explained away with hand waving. since GRACEs data is based on models of the southern oceans, they can produce whatever they want and claim it to be due to warming.. which isnt actually there in the real sst data.
“Greg Goodman says:
July 2, 2014 at 5:14 pm
“…. 2,112 million km2 more sea ice around Antarctica than normal.”
WTF? Why is the 1979-2008 mean “normal” ?
Does that just happen to be the perfect ice area of SH when the earth is in equilibrium with nature and the universe?”
The 1979 and onward for polar ice is because that was the year picked as having ‘complete satellite coverage’…so that’s the start of the data.
Actually there’s pretty complete coverage before that (especially for the north pole), but that was the year some international body decided to use.
The real problem Frank you did create the proper Mann statistic model, if you had no mater what numbers you put in the would now be less ice than before. The proper statistic model is all you need, I suggest you get right on if you don’t there no Nobel Prize for you. /sarc off
Green Sand :
I would like, very much, to be able to reproduce the plot shown by your link. Can you provide a detailed explanation of the web tool(s) and steps to do so :
http://nomad1.ncep.noaa.gov/cgi-bin/pdisp_sst.sh?ctlfile=monoiv2.ctl&ptype=ts&var=ssta&level=1&op1=none&op2=none&month=nov&year=2004&fmonth=jun&fyear=2014&lat0=-73&lat1=-63&lon0=-180&lon1=180&plotsize=800×600&title=&dir=
Thanks !
Our ball of rock called the Earth will either turn into a ball of flame or a ball of ice if we consider the two extremes. Right now, and for the past 40 years, it has been heading toward being a ball of ice. There is more ice on the surface now than in the past and is continuously growing. Yet we’re told the planet is warming.
What really gets me is that the middle of this interglacial was much warmer than today. The past 100 years are just a tiny blip compared to the temperature changes of the past 10K years. Temperatures are going down over the long run. No amount of CO2 is going to change that. This interglacial is on its way out. Ice age is coming back. If other interglacials are anything to go by, we’re in the last 2K to 5K years where temperatures will drop another 4 to 6 degrees C.
Please excuse my stupidity or lack of sleep (up at 3AM today) but since when has a circle had more than 360 degrees?
i thought that longitude went to 180 degrees either way, then changes from E to W or vice versa and reduces in value back to 0.
In the last 10 years, ARGO has shown at addtional .02 deg C of heat added to the deep ocean. This is a clear peer reviewed sign that total heat of the planet is increasing at an even faster rate than before.
GRACE data show Antarctica ice mass dropping rather dramatically.
The mainstream clearly disagrees with this article
” John in Oz says:
July 2, 2014 at 9:01 pm
Please excuse my stupidity or lack of sleep (up at 3AM today) but since when has a circle had more than 360 degrees?
I have inserted the red box 73S-63S 220W-50E
i thought that longitude went to 180 degrees either way, then changes from E to W or vice versa and reduces in value back to 0.”
I think that comes from the way the map is laid out. The center line of the map is not 0, so by going 220W from 0 makes the box ‘inclusive’. Stating it another way would make it sound like it was describing the area outside the box.
Doing it this way 359 W is the same as 1 E.
Frank,
Comparing the ‘extra’ ice to Greenland is good, but I’m not sure exactly how many people realize what size Greenland really is…but the ice is about 1/4 the size of Europe or about 1/3 the size of Australia. Now that may be a little more understandable.
Or…France, Spain, Portugal, Italy, Belgium, Netherlands, Luxembourg, Liechtenstein, Monaco, Germany, Vatican City and the UK (and all the other little islands associated with it).
And, of course, that “the water freezes more easily because the ice melts” only works at Antarctica and not near Greenland, for instance. This is because ice behaves differently in the North, everybody knows that.
Mary Brown:
our post at July 2, 2014 at 9:12 pm says in total
Say what!?
Temperature is not heat. Assuming you mean that the temperature rise implies additional heat in the ocean then it is a stretch to say “ARGO has shown at addtional (sic) .02 deg C of heat added to the deep ocean”.
O.O2 K change averaged over the entire oceans has been determined over the last 10 years. Does it actually indicate any real changeover the 10 years: what are the inherent errors of that determination?
And if it is true then how can that be a “a clear peer reviewed sign that total heat of the planet is increasing at an even faster rate than before” when there were no ARGO measurements before?
Assertions of the “mainstream” media are not relevant to the above article.
Richard