Even on business as usual, there will be <1° Kelvin warming this century
By Christopher Monckton of Brenchley
Curiouser and curiouser. As one delves into the leaden, multi-thousand-page text of the IPCC’s 2013 Fifth Assessment Report, which reads like a conversation between modelers about the merits of their models rather than a serious climate assessment, it is evident that they have lost the thread of the calculation. There are some revealing inconsistencies. Let us expose a few of them.
The IPCC has slashed its central near-term prediction of global warming from 0.28 K/decade in 1990 via 0.23 K/decade in the first draft of IPCC (2013) to 0.17 K/decade in the published draft. Therefore, the biggest surprise to honest climate researchers reading the report is why the long-term or equilibrium climate sensitivity has not been slashed as well.
In 1990, the IPCC said equilibrium climate sensitivity would be 3 [1.5, 4.5] K. In 2007, its estimates were 3.3 [2.0, 4.5] K. In 2013 it reverted to the 1990 interval [1.5, 4.5] K per CO2 doubling. However, in a curt, one-line footnote, it abandoned any attempt to provide a central estimate of climate sensitivity – the key quantity in the entire debate about the climate. The footnote says models cannot agree.
Frankly, I was suspicious about what that footnote might be hiding. So, since my feet are not yet fit to walk on, I have spent a quiet weekend doing some research. The results were spectacular.
Climate sensitivity is the product of three quantities:
Ø The CO2 radiative forcing, generally thought to be in the region of 5.35 times the logarithm of the proportionate concentration change – thus, 3.71 Watts per square meter;
Ø The Planck or instantaneous or zero-feedback sensitivity parameter, which is usually taken as 0.31 Kelvin per Watt per square meter; and
Ø The system gain or overall feedback multiplier, which allows for the effect of temperature feedbacks. The system gain is 1 where there are no feedbacks or they sum to zero.
In the 2007 Fourth Assessment Report, the implicit system gain was 2.81. The direct warming from a CO2 doubling is 3.71 times 0.31, or rather less than 1.2 K. Multiply this zero-feedback warming by the system gain and the harmless 1.2 K direct CO2-driven warming becomes a more thrilling (but still probably harmless) 3.3 K.
That was then. However, on rootling through chapter 9, which is yet another meaningless expatiation on how well the useless models are working, there lies buried an interesting graph that quietly revises the feedback sum sharply downward.
In 2007, the feedback sum implicit in the IPCC’s central estimate of climate sensitivity was 2.06 Watts per square meter per Kelvin, close enough to the implicit sum f = 1.91 W m–2 K–1 (water vapor +1.8, lapse rate –0.84, surface albedo +0.26, cloud +0.69) given in Soden & Held (2006), and shown as a blue dot in the “TOTAL” column in the IPCC’s 2013 feedback graph (fig. 1):

Figure 1. Estimates of the principal positive (above the line) and negative (below it) temperature feedbacks. The total feedback sum, which excludes the Planck “feedback”, has been cut from 2 to 1.5 Watts per square meter per Kelvin since 2007.
Note in passing that the IPCC wrongly characterizes the Planck or zero-feedback climate-sensitivity parameter as itself being a feedback, when it is in truth part of the reference-frame within which the climate lives and moves and has its being. It is thus better and more clearly expressed as 0.31 Kelvin of warming per Watt per square meter of direct forcing than as a negative “feedback” of –3.2 Watts per square meter per Kelvin.
At least the IPCC has had the sense not to attempt to add the Planck “feedback” to the real feedbacks in the graph, which shows the 2013 central estimate of each feedback in red flanked by multi-colored outliers and, alongside it, the 2007 central estimate shown in blue.
Look at the TOTAL column on the right. The IPCC’s old feedback sum was 1.91 Watts per square meter per Kelvin (in practice, the value used in the CMIP3 model ensemble was 2.06). In 2013, however, the value of the feedback sum fell to 1.5 Watts per square meter per Kelvin.
That fall in value has a disproportionately large effect on final climate sensitivity. For the equation by which individual feedbacks are mutually amplified to give the system gain G is as follows:
![]()
![]() (1)
(1)
where g, the closed-loop gain, is the product of the Planck sensitivity parameter λ0 = 0.31 Kelvin per Watt per square meter and the feedback sum f = 1.5 Watts per square meter per Kelvin. The unitless overall system gain G was thus 2.81 in 2007 but is just 1.88 now.
And just look what effect that reduction in the temperature feedbacks has on final climate sensitivity. With f = 2.06 and consequently G = 2.81, as in 2007, equilibrium sensitivity after all feedbacks have acted was then thought to be 3.26 K. Now, however, it is just 2.2 K. As reality begins to dawn even in the halls of Marxist academe, the reduction of one-quarter in the feedback sum has dropped equilibrium climate sensitivity by fully one-third.
Now we can discern why that curious footnote dismissed the notion of determining a central estimate of climate sensitivity. For the new central estimate, if they had dared to admit it, would have been just 2.2 K per CO2 doubling. No ifs, no buts. All the other values that are used to determine climate sensitivity remain unaltered, so there is no wriggle-room for the usual suspects.
One should point out in passing that equation (1), the Bode equation, is of general application to dynamical systems in which, if there is no physical constraint on the loop gain exceeding unity, the system response will become one of attenuation or reversal rather than amplification at loop-gain values g > 1. The climate, however, is obviously not that kind of dynamical system. The loop gain can exceed unity, but there is no physical reality corresponding to the requirement in the equation that feedbacks that had been amplifying the system response would suddenly diminish it as soon as the loop gain exceeded 1. The Bode equation, then, is the wrong equation. For this and other reasons, temperature feedbacks in the climate system are very likely to sum to net-zero.
The cut the IPCC has now made in the feedback sum is attributable chiefly to Roy Spencer’s dazzling paper of 2011 showing the cloud feedback to be negative, not strongly positive as the IPCC had previously imagined.
But, as they say on the shopping channels, “There’s More!!!” The IPCC, to try to keep the funds flowing, has invented what it calls “Representative Concentration Pathway 8.5” as its business-as-usual case.
On that pathway (one is not allowed to call it a “scenario”, apparently), the prediction is that CO2 concentration will rise from 400 to 936 ppmv; that including projected increases in CH4 and N2O concentration one can make that 1313 ppmv CO2 equivalent; and that the resultant anthropogenic forcing of 7.3 Watts per square meter, combined with an implicit transient climate-sensitivity parameter of 0.5 Kelvin per Watt per square meter, will warm the world 3.7 K by 2100 (at a mean rate equivalent to 0.44 K per decade, or more than twice as fast on average as the maximum supra-decadal rate of 0.2 K/decade in the instrumental record to date) and a swingeing 8 K by 2300 (fig. 2). Can They not see the howling implausibility of these absurdly fanciful predictions?
Let us examine the IPCC’s “funding-as-usual” case in a little more detail.

Figure 2. Projected global warming to 2300 on four “pathways”. The business-as-usual “pathway” is shown in red. Source: IPCC (2013), fig. 12.5.
First, the CO2 forcing. From 400 ppmv today to 936 ppmv in 2100 is frankly implausible even if the world, as it should, abandons all CO2 targets altogether. There has been very little growth in the annual rate of CO2 increase: it is little more than 2 ppmv a year at present. Even if we supposed this would rise linearly to 4 ppmv a year by 2100, there would be only 655 ppmv CO2 in the air by then. So let us generously call it 700 ppmv. That gives us our CO2 radiative forcing by the IPCC’s own method: it is 5.35 ln(700/400) = 3 Watts per square meter.
We also need to allow for the non-CO2 greenhouse gases. For a decade, the IPCC has been trying to pretend that CO2 accounts for as small a fraction of total anthropogenic warming as 70%. However, it admits in its 2013 report that the true current fraction is 83%. One reason for this large discrepancy is that once Gazputin had repaired the methane pipeline from Siberia to Europe the rate of increase in methane concentration slowed dramatically in around the year 2000 (fig. 3). So we shall use 83%, rather than 70%, as the CO2 fraction.

Figure 3. Observed methane concentration (black) compared with projections from the first four IPCC Assessment Reports. This graph, which appeared in the pre-final draft, was removed from the final draft lest it give ammunition to skeptics (as Germany and Hungary put it). Its removal, of course, gave ammunition to skeptics.
Now we can put together a business-as-usual warming case that is a realistic reflection of the IPCC’s own methods and data but without the naughty bits. The business-as-usual warming to be expected by 2100 is as follows:
3.0 Watts per square meter CO2 forcing
x 6/5 (the reciprocal of 83%) to allow for non-CO2 anthropogenic forcings
x 0.31 Kelvin per Watt per square meter for the Planck parameter
x 1.88 for the system gain on the basis of the new, lower feedback sum.
The answer is not 8 K. It is just 2.1 K. That is all.
Even this is too high to be realistic. Here is my best estimate. There will be 600 ppmv CO2 in the air by 2100, giving a CO2 forcing of 2.2 Watts per square meter. CO2 will represent 90% of all anthropogenic influences. The feedback sum will be zero. So:
2.2 Watts per square meter CO2 forcing from now to 2100
x 10/9 to allow for non-CO2 anthropogenic forcings
x 0.31 for the Planck sensitivity parameter
x 1 for the system gain.
That gives my best estimate of expected anthropogenic global warming from now to 2100: three-quarters of a Celsius degree. The end of the world may be at hand, but if it is it won’t have anything much to do with our paltry influence on the climate.
Your mission, gentle reader, should you choose to accept it, is to let me know in comments your own best estimate of global warming by 2100 compared with the present. The Lord Monckton Foundation will archive your predictions. Our descendants 85 years hence will be able to amuse themselves comparing them with what happened in the real world.
Here is my prediction: By 2100 the temperature will be the same in the tropics, perfectly controlled by thunderstorms, clouds and hurricanes.
The desert parts in 10-40 region will be warmer, about 0.8K.
The temperate regions will be 2.0K warmer in the winter, the same in the summer.
The polar regions will be 6K warmer in the winter (more snow) and .2K colder in the summer (it takes a lot of heat to melt all that snow).
Overall effect: A more pleasant globe, about 0.3K warmer overall, concentrated in areas that wants it (Minnesotans for global warming) with weaker winter storms and fewer hurricanes.
In addition it can feed another 2 billion people, not to mention more plants and animals thanks to the increase in CO2.
On the other hand, if totalitarian governments get their way, we can change the climate as successfully as was done to the Lake Aral region.
My estimate was given back in 2010 in a thread on this site:
http://wattsupwiththat.com/2010/10/25/sensitivity-training-determining-the-correct-climate-sensitivity/#comment-516753
My result was 0.121 ºC/(W/m^2) which on the basis of a CO2 doubling is
0.121 * 3.7 = 0.45 ºC
This is a “no feedbacks” estimate. As Lord Moncton intimates, feedbacks from an atmosphere constrained by the laws of thermodynamics would necessarily be negative.
Google is 100% committed to AGW https://www.google.com.au/search?hl=en&gl=au&tbm=nws&authuser=0&q=global+warming&oq=global+warming&gs_l=news-cc.3..43j43i53.6564.9920.0.10381.14.3.0.11.11.0.440.798.0j1j1j0j1.3.0…0.0…1ac.1.VOgF2Q_jxo8
There are NO skeptic stories anymore! LOL
I’m betting on +1°C assuming we don’t get another Maunder Minimum. Should we get into another multidecadal period without sunspots, the resulting temperature will be lower. I sympathise with Willis’ strong skepticism regarding the effect of sunspots on temperature, but the LIA and MM are there looking at me and I cannot look at their eyes and say, “you both just happened to occur at the same time”…
As a science illiterate, I wonder how a prolonged solar maximum (beyond and above current cycle records) can be in any way accurately predicted. Nature is full of surprises.
In earlier posts on
http://climatesense-norpag.blogspot.com
at 4/02/13 and 1/22/13
I have combined the PDO, Millennial cycle and neutron trends to estimate the timing and extent of the coming cooling in both the Northern Hemisphere and Globally.
Here are the conclusions of those posts.
1/22/13 (NH)
1) The millennial peak is sharp – perhaps 18 years +/-. We have now had 16 years since 1997 with no net warming – and so might expect a sharp drop in a year or two – 2014/16 -with a net cooling by 2035 of about 0.35.Within that time frame however there could well be some exceptional years with NH temperatures +/- 0.25 degrees colder than that.
2) The cooling gradient might be fairly steep down to the Oort minimum equivalent which would occur about 2100. (about 1100 on Fig 5) ( Fig 3 here) with a total cooling in 2100 from the present estimated at about 1.2 +/-
3) From 2100 on through the Wolf and Sporer minima equivalents with intervening highs to the Maunder Minimum equivalent which could occur from about 2600 – 2700 a further net cooling of about 0.7 degrees could occur for a total drop of 1.9 +/- degrees
4)The time frame for the significant cooling in 2014 – 16 is strengthened by recent developments already seen in solar activity. With a time lag of about 12 years between the solar driver proxy and climate we should see the effects of the sharp drop in the Ap Index which took place in 2004/5 in 2016-17.
4/02/13 ( Global)
1 Significant temperature drop at about 2016-17
2 Possible unusual cold snap 2021-22
3 Built in cooling trend until at least 2024
4 Temperature Hadsst3 moving average anomaly 2035 – 0.15
5 Temperature Hadsst3 moving average anomaly 2100 – 0.5
6 General Conclusion – by 2100 all the 20th century temperature rise will have been reversed,
7 By 2650 earth could possibly be back to the depths of the little ice age.
8 The effect of increasing CO2 emissions will be minor but beneficial – they may slightly ameliorate the forecast cooling and help maintain crop yields .
9 Warning !! There are some signs in the Livingston and Penn Solar data that a sudden drop to the Maunder Minimum Little Ice Age temperatures could be imminent – with a much more rapid and economically disruptive cooling than that forecast above which may turn out to be a best case scenario.
How confident should one be in these above predictions? The pattern method doesn’t lend itself easily to statistical measures. However statistical calculations only provide an apparent rigor for the uninitiated and in relation to the IPCC climate models are entirely misleading because they make no allowance for the structural uncertainties in the model set up.This is where scientific judgment comes in – some people are better at pattern recognition and meaningful correlation than others. A past record of successful forecasting such as indicated above is a useful but not infallible measure. In this case I am reasonably sure – say 65/35 for about 20 years ahead. Beyond that certainty drops rapidly. I am sure, however, that it will prove closer to reality than anything put out by the IPCC, Met Office or the NASA group. In any case this is a Bayesian type forecast- in that it can easily be amended on an ongoing basis as the Temperature and Solar data accumulate. If there is not a 0.15 – 0.20. drop in Global SSTs by 2018 -20 I would need to re-evaluate.
I agree with Cripwell above. The earths atmosphere and all its interacting components (plus solar) are not even close to a University laboratory gas experiments and can not be simulated by models or expected Arrhenius etc outcomes: if there is so much C02, we can expect so and so. Complete nonsense in the real world.. For all we know we could be heading for an ice age or boiling temps in 20 years or 10000, or 1000000 years
“Figure 3. Observed methane concentration (black) compared with projections from the first four IPCC Assessment Reports. This graph, which appeared in the pre-final draft, was removed from the final draft lest it give ammunition to skeptics (as Germany and Hungary put it). Its removal, of course, gave ammunition to skeptics.”
haha, the IPCC and supporters in a nutshell.
my guess is that we will cool due to historical evidence that low sunspot activity leads to negative temperature anomalies. 85 years, maybe not, but lets say 0.5k cooler than now. i guess my dart is just as good as the ipcc weighted v2013 is. mann, if they had a dart board on their wall, not a single dart would be in it, they would be all around the same point in the floor below it!
i would also guess that co2 levels will level off with the natural release of co2 from warming being underestimated and the human component being overestimated. reasoning- every indicator/model has been biased strongly towards human influence over the past 20 years or so.
Whatever the temperature will be , I don’t know. However, what I do know is that it will have absolutely nothing to do with CO2 change.I am not foolish enough to be taken in by a coincident slope angle of CO2 increase and temperature increase over 25 years ago.
James Strom is right and Mr Cripwell wrong. In these posts, I often apply the IPCC’s own methodology and data to determine whether its own conclusions are consistent with them. In the present case, as so often, there is no justification for those conclusions. The large warming they predict for this century on their “funding-as-usual” scenario will not occur.
A fortiori, the IPCC’s conclusions cannot be justified if the IPCC makes the mistake – as it does – of assuming that over the 21st century anthropogenic warming will be a merely linear response to the radiative forcing. Professor Brown is quite right to make a point similar to this: but in making that point he criticizes not me but the IPCC itself. I am drawing conclusions from premises with which the IPCC is in no position to disagree, for they are its own premises. If it finds the conclusions contradictory to its own, then it has some explaining to do. This method of argument is known as Socratic elenchus.
Rarely, Professor Brown errs. I fear he may have done so here. For the feedback sum may be attained either by linear or by non-linear processes (see e.g. a remarkably clear and detailed pedagogical paper by Dick Lindzen’s pupil Gerard Roe in 1999). So there is nothing inherent in the IPCC’s treatment of feedbacks that precludes non-linearity in the system response of which the feedbacks are at once an effect and a cause.
Of course, if there are no temperature feedbacks or if they are close to or below zero, the system response to our influence will be near-linear in any event, save where natural phenomena such as volcanoes supervene.
Mr Cripwell says it is impractical to measure climate sensitivity at present. True, but it is imprudent of him to go one to say that “none of the numbers manipulated” by me “have any meaning in physics”. Actually, the CO2 radiative forcing is thought to be in the right ball-park (though I privately suspect it is on the high side); the Planck parameter’s value is directly calculable by reference to a sufficient run of temperature data for the mid-troposphere, and I have thus calculated it, broadly confirming the value used in the models; the feedback-amplification equation, an established result in physics, is as I have stated it; and the reduction in the IPCC’s estimate of the feedback sum is also as I have stated it.
Mr Mearns says he is not sure if there is anything new in this post. What is new about it is that various data buried in the IPCC’s latest report and – as far as I can discover – not yet discussed anywhere show quite clearly that we shall certainly not get much more than 2 K warming this century, and that we shall probably see considerably less than that. The central estimate of climate sensitivity that the IPCC should have published ought to have been 2.2 K, using its own methodology.
Dr Burns asks how clouds cause warming. They do so at night in the winter, by retaining warmth that would otherwise radiate out to space. However, as the IPCC would have admitted from the outset if it had not been hell-bent on achieving a physically-absurd but profitable result, the major effect of clouds is of course to shield the surface from the Sun’s radiation, so that their net effect is of cooling. And that is why the naturally-occurring reduction in global cloud cover from 1983-2001 caused 2.9 Watts per square meter of radiative forcing, compared with just 2.3 Watts per square meter for the entire anthropogenic forcing since 1750.
“Commiebob” is right to say that any climate forecast should carry the rider “all other things being equal”. Natural variability is more than sufficient to explain all changes in global temperature, so it is more than sufficient to prevent any warming effect from CO2 for quite long periods – such as the last two decades of no-warming, which the models failed to predict.
“Q” and I agree that there will perhaps be less than 1 K global warming this century. However, he is not quite right in suggesting there is a point beyond which adding more CO2 to the atmosphere will make no difference. In theory,. All additional CO2 ought to cause some warming.
Mr Mosby thinks electric autos will reduce CO2 emissions. In themselves, they won’t. Most of the electricity has to come from conventional power stations, and electric cars use 30%more energy per mile than ordinary autos because of the weight of the batteries. They are the costliest and least effective method of making global warming go away that I have yet run through my simple climate-mitigation model.
“Aaron” says he thinks the world would be 2-4 K warmer than the present by 2100. On what evidence? The IPCC’s prediction is approximately that; but its 1990 prediction of the near-term warming rate, issued with what it described as “substantial confidence”, has proven to be a twofold exaggeration. On the IPCC’s track record, then, one should divide its projections by 2, giving 1-2 K warming occur this century – which was, broadly speaking, the conclusion of the head posting.
Anthropogenic warming will not rise above the long term natural variation proxies calculated since before the Medieval Warm Period.
“let me know in comments your own best estimate of global warming by 2100 compared with the present.”
Ok, swammy says in 2100 the GAST will be [drum roll] the same as current +/- 0.5 °C.
Chuck L says: “I am not sure if this was taken into consideration but as oceans cool (-PDO, -AMO) their absorption of CO2 will increase further reducing sensitivity.”
The PDO is not an indicator of ocean temperatures (warming or cooling) of the Pacific. The PDO simply represents the spatial pattern of the sea surface temperature anomalies of the extratropical North Pacific. See the post:
http://bobtisdale.wordpress.com/2014/04/20/the-201415-el-nino-part-5-the-relationship-between-the-pdo-and-enso/
Also, the PDO is positive, not negative, and I suspect it will go higher this month:
http://jisao.washington.edu/pdo/PDO.latest
Regards
Countryfile UK (BBC BS) about 9 months back – John Craven suddenly came upon “scientists/researchers” discovering CO2 emissions (circa 330ppm) in a wood somewhere in England. With there instruments they said it came from the surrounding ground…and OMG we don’t know why?
That was the last to be seen of that, no follow up. Delete button – panic!
That looked to be over ground 1mtr squared in a wood. That might suggest a lot more leeching out of the non volatile landmass. I am not sure how that works really, but clearly the land is a source for various reasons. Anybody know of reliable research? Something like this must mask anything AGW…ever?
Chuck L, PS: The sea surface temperatures of the North Pacific also took a mighty upward swing in May: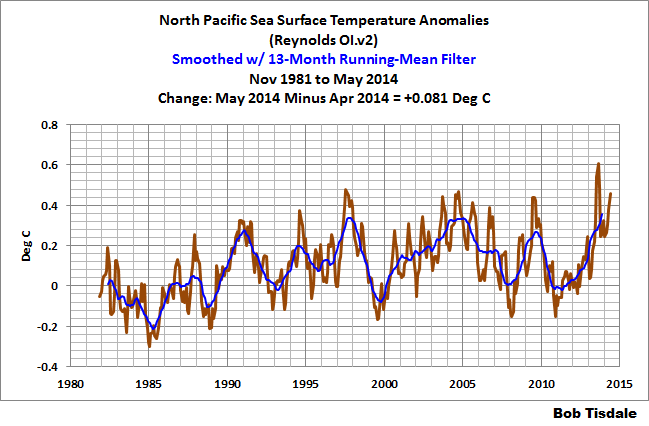

Which impacted the Pacific as a whole:
Those graphs are from the sea surface temperature update posted this morning:
http://bobtisdale.wordpress.com/2014/06/09/may-2014-sea-surface-temperature-sst-anomaly-update/
Cheers
All the climate skeptics should move to one country , take over its government and then ignore all international laws
Ex-expat Colin says:
June 9, 2014 at 7:03 am
9 months ago and 330 ppm? Currently it is around 400 ppm. So I guess the wood was absorbing CO2. As plants usually do when they are growing. Why the surprise?
Ex-expat Colin says:
June 9, 2014 at 7:03 am
I read a study sometime ago about CO2 levels over crop fields. I really can’t remember all the details but I seem to recall that the level of CO2 dropped down to 275 ppm at some time during the day. Plants seem to really ‘suck’ the co2 out of the atmosphere when they want to
Bob, correct me if I am wrong. I am going to attempt a PDO description that is rather plain.
The North Pacific Ocean temperature (if one can actually measure it apart from the rest of the Pacific Ocean), can remain the same temperature (no overall warming or cooling), or not, but the spatial pattern titled the PDO (where large pools of water set up) of the main warm and cool pool will switch places back and forth from time to time. The PDO is not therefore, a temperature measurement.
During a positive phase, the west Pacific (up by Northeast Asia countries) is the location of the cool pool and part of the eastern ocean (by Western US and Canadian territory) is the location of the warm pool; during a negative phase, the opposite pattern sets up. It shifts phases on at least inter-decadal time scales but with such a short historical data string combined with longer term tree ring proxies, I have a difficult time believing or not how long each phase lasts.
What makes us along the West coast feel colder when the PDO is negative is when that cool pool is along our coast and the warm pool is clear across the Pacific.
si on se réfère aux données historiques à notre portée, on peut raisonnablement espérer 2/3 ° de réchauffement comme à l’époque romaine.
Je me vois bien en toge, taquinant quelques jeunes esclaves….
Par contre cela pourrait tout aussi bien être -2°, auquel cas, je prépare déjà mon bateau pour m’échouer sur une côte tropicale.
le CO2?
c’est quoi tous vos calculs à la noix?
Spencer posait une bonne question: les IR peuvent-ils chauffer l’océan?
Ils ne savent même pas comment cela se passe sur les 4/5 du globe?
farceurs va
joletaxi says:
June 9, 2014 at 7:34 am
I would like to see myself in the same position. Who cares what the temperature is and the causes
How much warming by 2100? Some of the assumptions that must be made to come up with a prediction are little more than guesses. For example, sometime in the next 85 years, mankind might be getting the vast majority of our energy from nuclear fusion reactors, “clean” nuclear fission or some other way not yet guessed. I tend to believe that a new energy source will be developed and therefore I don’t think the CO2 growth rate Lord Monckton estimated will be hit (much less the estimate of the IPCC). I think CO2 levels could be between 500 and 600 ppm. I’ll guess 550. The forcing based on the calculation give by Lord Monckton would be reduced from 0.75 degree C to slightly less than 0.7 degree C. I think we are coming to a period when the world will have some natural cooling that will end in 30 or 40 years (another assumption) followed by warming. The net effect – by 2100, perhaps 0.3 degree C increase in temperature from the current temperature.
“Tanya Aardman says: June 9, 2014 at 7:08 am All the climate skeptics should move to one country , take over its government and then ignore all international laws”
Think about Ban Ki-moon, who must reside in a country toying with UN Kyoto agreement. Even North Korea has ratified it. And not only, the satellite images show an earth hour 24/7/365 over there as a bonus. How about sending Ban Ki-moon there instead? It should feel more like home to a devoted alarmist, keen on a myriad of precautionary measures. US approach could then become the new international standard.
Much as I generally love xkcd, this just in:
IPCC Claim’s 4.5 C by 2100
The tragic thing about this is that it is arrant nonsense.
Not even the IPCC, in their wildest drug-induced nightmares, is still calling for 4.5C of warming by 2100 when the planet is in neutral and has been for the entire 21st century, when the only statistically significant warming of the last 75 years occurred in a single fifteen year stretch from the 1982/1983 ENSO to the 1997/1998 ENSO. Note that means that statistically significant warming has occurred in a single span of time consisting of roughly 1/5 of the entire “post-industrial CO_2” record, the period over which it went from 300 ppm to 400 ppm in round numbers, It is isolated on the left by mostly flat, a bit of warming and a bit of cooling, from 1940 to 1983 (with some violent bobbles around the ENSO event a few years to either side) and from 1998 to the present on the right (with some violent bobbles around the ENSO event a few years to either side). AR5 actually contains a box that tries to explain the latter — too bad that they didn’t think to try to explain the former, or why its models completely erase (on average) the other major temperature variations in the 20th century, especially from 1900 to 1940.
But will he author of XKCD publish a retraction when it is pointed out, repeatedly (as is now happening on the blog devoted to today’s comic) that the actual warming expected by the IPCC is currently around 2 C and falling as the “hiatus” continues and the central estimate of climate sensitivity continues to diminish? Will he in fact stick with his parenthetical assertion that 2C is “probably no big deal”? Will he acknowledge that even the central 2 C assertion is currently in pretty serious doubt as Trenberth is currently stating that the oceans ate my global warming and can continue to do so for centuries without significantly (or possibly even measurably) affecting the temperature of the oceans?
The only person who is still smoking this crack is James Hansen, who finally became enough of an embarrassment that he was quietly ushered out from the bully pulpit where he had spent decades asserting personal opinion as fact (and filling in a central, basically free, square on my logical fallacy bingo sheet in the process) — 5+ C warming, 5 meter sea level rise (stated in an equally public forum, with equally nonexistent objective or even theoretical support).
What will it take to call somebody on something like this, stated in a public forum? One single, maximally extreme scenario, one in which human CO_2 actually plays the MINOR role, has been modelled to produce this much warming as a median result, and and not even the IPCC assigns it any “confidence” — not that their assertions of confidence have the slightest weight from any actual theory of statistical analysis, as the statistical average of a large stack of non-independent models that are unchecked against the phenomena they are trying to predict (and that largely fail such a check if it is performed) is a completely meaningless quantity.
I clearly missed my Nobel Prize in physics. I should have just written 36 distinct numerical solutions to the Hartree approximation of the many electron atom (well, really only seven distinct solutions, but then I could have taken the seven and changed a few lines of code around to keep them “the same” but maybe compute the answer to higher precision to flesh it out to 36 because 7 is too few to convince anybody of statistical significance). Then I could have averaged their result and asserted that because it was computed by 36 physics based models it must be a truly excellent predictor of the actual correlated, antisymmetric quantum electronic structure that the Hartree models, sadly, completely omit. And if 36 wasn’t enough, I could have added even more! I could have boosted that ol’ confidence factor WAY up. I could have computed that (wrong) answer to FIVE significant digits with enough “independent” computations.
I just don’t get it. No physicist would stand still for this in quantum theory because the assertion is absurd. No physicist would stand still for it in (e.g.) designing nuclear explosives or computational fluid dynamics being used to engineer supersonic jets where a company would go broke if you got the wrong answer — just ask a bunch of people (in only a handful of groups, getting six or seven models per group) to write CFD or nuclear hydrodynamic models and average whatever they come up with as if it is bound to be correct if enough models contribute. No computer scientist or mathematician studying the general problem of turbulence would stand still for it when implementing a solution to a nonlinear, chaotic problem being solved at an integration scale known to be five or six orders of magnitude too large.
Only in climate science can somebody who writes comics cherry pick what is literally the worst case scenario in all of AR5, present it as if it is “the” central estimate in which they are willing to claim some ill-founded confidence, state in parentheses that their actual central estimate is likely not to be catastrophic, and present it to create purely political alarm that happens to coincide with a presidential assertion of impending doom and measures that will cost us a few hundred billion dollars, our prosperity, and tens to hundreds of millions of lives in the poorest countries in the world to implement and which still will make no measurable difference in the warming projected by the models by 2100.
The only thing that might make a difference is building mountains of nuclear power plants (or discovering new physics and/or technology, but one cannot predict either one). Even Hansen, who in his younger days would join nuclear plant picket lines, has come to acknowledge this. Where is the call from the president to build nuclear power plants to replace the coal plants on an urgent international basis?
rgb
“Predicting is hard, especially about the future.” Yogi Berra.