 Eric Worrall writes:
The volcano Mount Sangeang Api in the Lesser Sunda Islands has just erupted, sending a huge ash cloud 12 miles into the air.
Wikipedia describes Sangeang Api as a volcano complex with 2 active cones, Doro Api 1,949 metres (6,394 ft) and Doro Mantoi. 1,795 m (5,889 ft). Indonesia has a number of very active volcanoes, including volcanoes which threaten major cities, such as the infamous Mount Merapi.
Merapi, which has erupted several times in the last decade, is located just 17 miles from the city of Yogyakarta, home of 2.5 million people.
Near equatorial volcanoes like Sangeang Api are useful to global warming modellers, as the ash cloud can usually be detected in both hemispheres. They provide a convenient excuse for the short term cooling of the entire Earth.
Some spectacular pictures in the following link:-
ren says:
How was temperature at the equator in 1998 at the height of 12 km? Is not the same?
That was 12 MILES (19km) not 12km . What was the point you were making with the graphs?
http://www.cpc.ncep.noaa.gov/products/analysis_monitoring/ensostuff/ONI_change.shtml
Due to a significant warming trend in the Niño-3.4 region since 1950, El Niño and La Niña episodes that are defined by a single fixed 30-year base period (e.g. 1971-2000) are increasingly incorporating longer-term trends that do not reflect interannual ENSO variability. In order to remove this warming trend, CPC is adopting a new strategy to update the base period.
===
So even the base period for the “anomaly” is shifting .
Someone needs to stop all this ad hoc piecemeal, poking around and define what this “index” is supposed to measure. It looks like some kind of ill-defined and poorly implemented band pass filter.
I’m with you on this one, Greg. It’s an arbitrary index. When I ask, only-semi rhetorically, what are the S.I. units of ENSO? I end up more confused about what it is supposed to represent.
Some of the cooling associated with Tamboro in 1815 may have been associated with a perturbed jet stream that created an amazing cross-polar-flow. I don’t claim to understand the dynamics, but a huge amount of ice was apparently flushed from the Arctic Ocean into the North Atlantic, and icebergs were coming ashore in Ireland. It may have been the cooled Atlantic, rather than ash causing less sunlight, that caused “The Year Without A Summer.”
I was always puzzled by the fact Tamboro is associated with less ice in the arctic. We had an interesting discussion about this puzzle last year: http://wattsupwiththat.com/2013/07/08/1815-1816-and-1817-a-polar-puzzle/
To be honest, the effect of volcanoes remain a mystery to me, but I do like the discussions about the mystery here at Watts Up With That.
From the same ref: “So, ONI values during 1950-1955 will be based on the 1936-1965 base period, ONI values during 1956-1960 will be based on the 1941-1970 base period, and so on and so forth.
In real-time operations, the past 30-year base period (e.g. 1981-2010) will continue to be used to compute the departure from average.”
====
It’s gets worse the close you look. Now it seems the older data uses a centred reference period and the recent years uses a lagged one. This confused mess is supposed to indicate a history of ENSO.?
In a desperate attempt to present ENSO as an “internal oscillation” they have removed the inter-decadal variation.
Wait , there’s more:
http://www.cpc.ncep.noaa.gov/products/analysis_monitoring/ensostuff/detrend.nino34.ascii.txt
So even the base Nino34 SST used to derive this was detrended before we start.
Let me see if I can recap.
Nino34 SST
take monthly average (resample at irregular calendar months without anti-alias filter)
detrend ( without saying why a linear model should be fitted to the data)
find “climatology” of 30 year segments changed every 5 years. (Why not every year?)
subtract climatology from detrended SST (reduce annual variability )
take three month running mean of monthly means ( distorting low pass filter)
define arbitrary threshold based on arbitrary 5 month sample of 3 month means of climatology adjusted detrended monthly means …. of Nino34 SST.
I hope I haven’t missed anything.
So, Michael, the units would be degree C ( or Kelvin ) but what it represents seems less clear.
Let’s see.
“average” sub-annual variability removed with adaptive anomaly method.
Full period long term “trend” is removed. (not clear why)
Base line of climatologies are not aligned so 5 year staircase adjustment introduced.
Crude 3 mo running mean filter reduces residual sub-annual and introduces spurious frequencies
Then they use what is left of the mangled short term variability to “detect” Nino / Nina periods.
I am not at all surprised that they have “spring time barrier” where predictions are unreliable.
Any way that’s enough of that. This is supposed to be about a new volcano that should give a new chance to measure and evaluate the effects of aerosols on climate.
Should be interesting.
Greg Goodman says: “I really have little time for an “index” based on a runny mean of 3mo averages in the presence of 6mo and 12mo cycles. That’s typical climatologists Mickey Mouse data processing.”
I presented ONI for Arno, because Arno apparently has a hard time interpreting graphs. If you had asked, Greg, I would have presented a graph of NINO3.4 SST anomalies:
http://bobtisdale.files.wordpress.com/2014/05/monthly-nino3-4.png
climatereason says: “Nasa says that volcanos can cause winter warming which again seems to be forgotten.”
The research was done by Alan Robock of Rutgers:
http://www.envsci.rutgers.edu/~robock/
Greg Goodman says: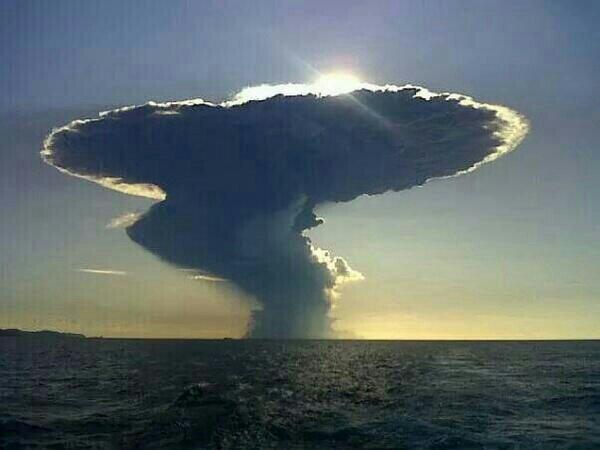
May 31, 2014 at 1:08 am
> Definitely looks to be hitting tropopause: classic anvil spreading
http://www.wired.com/2014/05/explosive-eruption-at-sangeang-api-in-indonesia/
How about this one:
If anything made it into the stratosphere, it’s a tiny percentage of what had erupted. I won’t be looking for amazing sunsets in New Hampshire.
I found that at http://volcanocafe.wordpress.com/2014/05/31/sangeang-api-lesser-sunda-islands-indonesia-eruption-30-may-2014/ . He has some other images, including that one at Wired.
Greg Goodman says: “From the same ref: “So, ONI values during 1950-1955 will be based on the 1936-1965 base period, ONI values during 1956-1960 will be based on the 1941-1970 base period, and so on and so forth.”
I linked the old version of ONI for Arno, Greg.
I’ve already commented on the new version of ONI:
http://bobtisdale.wordpress.com/2012/06/05/comments-on-noaas-recent-changes-to-the-oceanic-nino-index-oni/
Bob Tisdale says:
May 31, 2014 at 5:38 am
No sign of “a La Nina as big as life in 1993/94” in that graph either. 🙂 Perhaps it was visiting the fjords.
With an ash column 15 to 20 kms high and with a high SO2 content, this volcano has the potential to provide a cooling dip. I guess it depends if there are further eruptive phases.
The ash column is already about 300 kms long and appears to be quite thick. You can zoom into the location and see it on the Modis satellites with Modis Worldview.
https://earthdata.nasa.gov/labs/worldview/
If it is going to produce a cooling dip, we should be able to tell through the daily stratosphere temperatures. Mount Pinatubo produced a +1.5C spike in stratosphere temperatures which started 12 days after the main eruption. This volcano probably happened too late in May to show up in the May temperatures but it will be clear by the time June temps come out. Daily UAH lower stratosphere and lower troposphere temps. Stratospheric Volcano Eruptions provide a very clear signal.
http://s30.postimg.org/5h9be8s7l/Daily_UAH_LT_LS_Volcs_Mar14.png
Was the Darwin airport close down a result of modelled projections of ash cover like in the Icelandic errustions a few years ago that brought the EU airspace to a grinding halt? 12 miles is ~63k feet!
Thanks for the daily plot. It’s true that we get too much smoothed/filtered detrended , anomalified data.
So what is your down arrow in 1982 supposed to be? The data goes up and you indicate an arrow in completely the other direction.
Note, the longer term downward trend runs from 1978 to 1984. The only credible correlation with El Chinon is POSITIVE bump with a lag of about 6mo (very roughly by eye, with your x-axis) . I see abolsutely no indication of dip that is anti-correlated with TLS.
Mt P: the dip in TLT does correlate if we spread the effect as I did with a decaying response. However, it has to be noted that there was a very similar dip about 4 years earlier of very nearly the same magnitude. What enables the conclusion that the second one ( which we already see starting a year BEFORE the eruption) is caused by volcanism and the first one wasn’t.
There is a heave degree of confirmation bias in all this. It’s significant how often presentations focus on Mt P and ignore the previous one that “doesn’t work”.
I’ll have a closer look at daily TLS. It looks like there could be something useful I can pull out of it.
PS Bill, what’s that last arrow on TLS supposed to show? You just hand drew a line from the low point to the highpoint or what?
It you want to play with straight lines fit a linear model from 1994 to 2014 and I’d bet it’s very near zero slope. Then you will note what my lowpass filtered graph showed: Mt Pintubo caused a 0.5K cooling step in TLS.
Then we can address the question of where the extra 2 W/m2 of SW that did not get reflected back out went to in that period.
Greg Goodman says:
May 31, 2014 at 7:16 am
———————–
There was a Super-El Nino in 1982-83. Troposphere temps should have spiked similar to 1997-98 but instead, temps were flat or down quite a bit by 1984. I’ve got the impact of the 1982 El Chichon eruptions at -0.3C for the lower troposphere temps (going back to 1958 here adding in HadAT to the record which provides for a few more eruptions to look at).
http://s2.postimg.org/ojsxh3vbt/UAH_RSS_Had_AT_Volc_Impact.png
Just another every-other-year volcano. Takes a big one to affect anything other than a local/regional area.
Greg Goodman says:
May 31, 2014 at 7:25 am
PS Bill, what’s that last arrow on TLS supposed to show? You just hand drew a line from the low point to the highpoint or what?
——————————–
Lower stratosphere temperatures appear to slowly recover over up to 25 years after a major stratospheric eruption. The idea is that Ozone is depleted by a the large eruptions and then it takes a long time for the Ozone to rebuild. If you have successive eruptions in a row, the Ozone does not have time to recover and one can get a long-term decline in stratosphere temperatures since there is less UV solar radiation intercepted in the stratosphere. This allows more solar radiation to reach the surface instead and we have long-term warming at the surface from the eruptions (versus the short-term cooling impact).
MSU equivalent temps from radiosondes going back to 1958.
http://hadobs.metoffice.com/hadat/images/update_images/msu_timeseries.png
This is a counter-argument to global warming theory that forecasts cooling in the stratosphere (which does show up in the record, its just that I think it is more a volcanic signature rather than a GHG signal).
What’s HadAT ? Never heard of that.
Sorry Bill , what you are presenting is totally inconsistent. Why would you expect an instantaneous correlation? A change in forcing implies a change in dT/dt . Only when that system has time to approach equilibrium can you talk about a final delta T.
I suggest you have read of what the integrated climate response would look like:
http://climategrog.wordpress.com/?attachment_id=884
12 miles high is only a small distance into the stratosphere. The tropopause height in the tropics averages 56,000 ft, 11 miles. If 12 miles is the top of the eruption cloud, little material will be in the stratosphere and the bulk will rain out of the troposphere fairly quickly.
I found a reference for estimate historical plume height here:
http://www.academia.edu/4440754/Plume_height_volume_and_classification_of_volcanic_eruptions_based_on_the_Weibull_function
Pinatubo is listed at 40 km, 24 miles.
“This is a counter-argument to global warming theory that forecasts cooling in the stratosphere (which does show up in the record, its just that I think it is more a volcanic signature rather than a GHG signal).”
Indeed, that is what my graph of TLS shows but again your hand drawn straight lines are showing what you think is the explanation not what the data shows.
OK, I’ve found HadAT, large uncertainty but may be worth a look.
My recollection of reading analysis by Joe Bastardi & Joe D’Aleo is that tropical volcanoes will decrease the global temp average but not necessarily make NH winters any colder. Conversely, a high latitude NH volcano can decrease NH temps, especially winter temps , but not necessarily be seen in the global temp average.
Given latest estimates of 20 km height , compared to other larger events, it would seem unlikely that any changes in global temps from this event would be decernable from general background variations in the global temp datasets.
I will be visiting Indonesia in August -2014 and hope to trek to Mount Merapi.Trekking to Volcanic mountains is the last unpredictable adventure on planet Earth .This lastest Volcanic erruption proves the fact that we humans are still at the mercy of nature despite scientific discoveries.
hmmmm. Does it matter how high or how much? Or is “where” more important?
[Actually, the mods were wondering was Pamela’s fishing when Pamela was fishing where Pamela was fishing wides? .mod]
Thanks, Eric. Good post.
The immense power of nature!
Go sequester the CO2 from volcanoes, and remember they keep spewing it for years after the eruption.
Ah, the futility of fighting nature and the whole world. Even the Germans are burning more and more coal, no to mention China and India. It is futile but very harmful for mankind.
I should add “when” as well, alongside “where”.