We’ve already discussed Cowtan and Way’s infilling of HADCRUT4 data in the post On Cowtan and Way (2013) “Coverage bias in the HadCRUT4 temperature series and its impact on recent temperature trends”. The paper is available here. In that earlier post, I presented the following graph and noted:
If we compare the HADCRUT4 data to the CMIP5 models (historic and RCP6.0) for the period of 1997 to 2012, Figure 1, we can see that the models over-estimate the warming from 65S to 65N (the vast majority of the planet) and underestimate the warming at the poles. Therefore, if the Cowtan and Way (2013) data are increasing the warming in the Arctic, they are creating a greater divergence from the models there, but failing to reduce the differences between the models and data where the models overestimate the warming.

Figure 1
(I changed the above Figure number for this post. It was Figure 9 in the earlier post.)
The Cowtan and Way (2013) data do increase the warming at the poles and exaggerate the failings in the models there, while doing little to explain the hiatus in the non-polar regions, which make up about 90% of the planet.
Note: For those not familiar with the type of graph shown in Figure 1: It illustrates the warming and cooling rates of the HADCRUT4 data, and the average of the CMIP5 (IPCC AR5) climate runs for the period of January 1997 to December 2012…the hiatus period. The vertical axis (y-axis) is scaled in deg C/decade, so we’re showing the warming and cooling rates (that is, the trends). The horizontal axis (x-axis) is scaled in latitude, so the South Pole is to the left at -90 (90S) and North Pole is to the right at 90 (90N). From 1997 to 2012, the HADCRUT4 data show the very slow warming rates (and cooling at some latitudes) extending from the mid-latitudes of the Southern Hemisphere to the mid-latitudes of the Northern Hemisphere. Both poles continue to show warming, however. On the other hand, the models do not show the lack of warming in the non-polar regions during this period. That is, they do not capture the hiatus, the pause, the halt, the cessation of global warming in the non-polar regions. And the models underestimate the warming at the poles, especially in the Arctic, and that means the models do not properly simulate polar amplification. But we already knew the models cannot simulate polar amplification—we discussed and illustrated that failing in the posts here and here.
Back to the Cowtan and Way (2013) data:
In the earlier post, I had not presented warming rates (or lack thereof) for the Cowtan and Way data on a zonal-mean (latitude-average) basis (like Figure 1)because their data is not available on a gridded basis in an easy-to-use format. However, blogger Nick Stokes made the effort to determine those trends for the Cowtan and Way “hybrid” version, for the period 1997 to 2012. (Just what we’re looking for.) See Nick’s post Cowtan and Way trends. Nick was also very kind and he listed the trends in a table. (Thanks, Nick.)
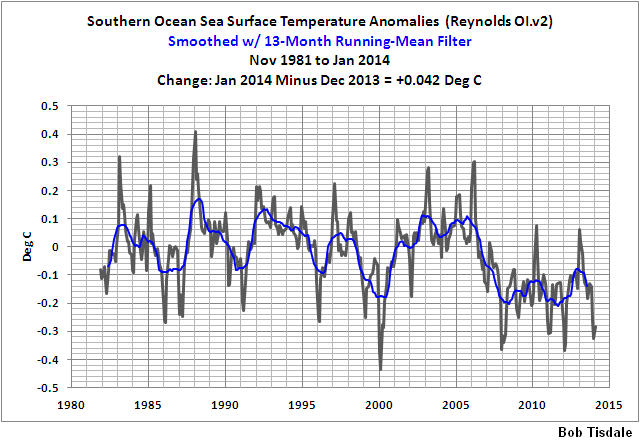
Figure 2 presents the trends of the Cowtan and Way “hybrid” data (courtesy of Nick Stokes) versus the trends of the multi-model mean of the climate models used by the IPCC for their 5th Assessment Report (AR5), for the period of 1997-2012. I’ve also included the HADCRUT4 trends as a reference (dashed lines), because they’re the basis for the Cowtan and Way data. The Cowtan and Way infilling make the models perform worse at the poles, and they had performed very badly with the HADCRUT4 data without the “help” of Cowtan and Way. And the Cowtan and Way infilling did little to eliminate the hiatus in the non-polar regions. Most notably, Cowtan and Way reduced, but did not eliminate, the cooling taking place in the Southern Ocean surrounding Antarctica, a place where sea ice has been expanding in recent decades…and where sea surface temperatures have been cooling.

Figure 2
CLOSING
The Cowtan and Way (2013) revisions to the HADCRUT4 data do nothing to explain the absence of warming that is occurring in the non-polar regions during the hiatus period. Those non-polar regions cover about 90% of the planet and it’s there that climate models cannot explain the slowdown and absence of warming. The Cowtan and Way revisions also exaggerate the warming at the poles which further undermines the current generation of climate models, because the models are unable to explain the observed warming at the poles. That is, the models are still not capable of properly simulating polar amplification.
Those who promote the Cowtan and Way (2013) revisions to the HADCRUT4 data don’t understand where the hiatus is taking place and they don’t understand the model failings at simulating polar amplification—or—they are intentionally being misleading.
SOURCES
The HADCRUT4 data and the climate model outputs are available through the KNMI
Discover more from Watts Up With That?
Subscribe to get the latest posts sent to your email.
DBStealey,
You chose to disbelieve the data that is published by organizations that produce the data and would rather cite third party analysis of that data that shows obvious misinterpretations or even falsifications of that data (i.e. claiming that the GISP2 series trend ends later than 1855).
In choosing to only accept information that fits your belief, you would rather quote Richard Lindzen who, as far as his multiple pet theories of negative feedbacks and his projections for future warming scenarios has been 100% (completely) wrong.
for example, this graphical image of “skeptic” temperature projections vs. actual projections and how they compare to the actual temperature record shows.
you asked me about a bet, well what you don’t realize is that you are already making that bet. I have too. The bet is that global warming is going to significantly impact the life expectancy and well being of YOUR grandchildren’s adult lives. This is what the scientific models say.
You refuse to believe the multiple levels of data, linked to the original sources. You would rather choose to believe third party individuals, some of whom have stated explicitly that the work they are doing is being done to intentionally “make government smaller”. This is ideology, not science.
Therefore, because of your ideology, you are choosing to bet that your grandchildren’s (really EVERYONE’S grandchildren’s) lives will be fine without CO2 mitigation efforts.
Ideology, taken to this level of extremism is hubris of such a degree that it borders on the verge of sociopathy, it isn’t “skepticism” and it certainly isn’t “science”.
Hows that for a “null hypothesis”?
Jai Mitchell says:
February 24, 2014 at 4:20 pm (replying to DBStealey),
Odd, that.
See , because of your ideology, you are choosing to deliberately kill millions of innocents that otherwise would live longer, healthier lives in better conditions for their grandchildren’s (and EVERYONE’S grandchildren’s) lives that will be not “fine” but much BETTER without the futile CO2 mitigation efforts YOU are demanding. YOU are the one actually killing millions now and through the next 100 years, YOU are the one demeaning and harming billions through YOUR fear of the benefits of CO2 and lower energy costs because YOU fear the “effects” not of a future, but the effects only of propaganda.
By the way, because you do fear the future so greatly, have you sterilized yourself, your family, and all of your relatives? Surely you yourself are going to add to the “burden” of a healthy future world are you?
Ideology, taken to this level of extremism is hubris of such a degree that it borders on the verge of sociopathy, and certainly isn’t “science”.
jai mitchell has a bad case of psychological projection: everything he mentions above he and his alarmist chumps are guilty of. Mitchell cherry-picks whatever supports his religious beliefs, and he disregards all the rest.
Regarding Prof Lindzen, he [Lindzen] has stated in the past that he does not make predictions. Therefore, the Skeptical Pseudo-science chart that mitchell linked to is simply more fabricated nonsense that supports jai’s religious belief. Skeptical Pseudo-science has made dishonesty into an art form. That’s why no one takes them seriously. They have zero credibility. Anthony even gave them their own special category: Unreliable, due to (1) deletion, extension and amending of user comments, and (2) undated post-publication revisions of article contents after significant user commenting.
And regarding mitchell’s bogus concern for ‘the childrunnn’, he sounds more hypocrital than Hitlery Clinton. If mitchell really believed the nonsense that he posts here, he would have taken my wager, which was based on his mythical ’38 degree’ temperature rise. But of course, mitchell knows that is complete nonsense. Otherwise… easy money!
jai mitchell is angry for one main reason: because scientific skeptics will not buy into his silly climate alarmism. Why not? Because we have eyes! We can see that there is nothing unusual happening. Nothing at all. The whole alarmist story is one giant head fake that only credulous acolytes like mitchell would believe.
Once more: not one alarmist prediction has happened. Not one! They have all been flat wrong. With a record of failure like that, only a religious True Believer would still buy into runaway global warming nonsense. jai mitchell does. But not many others do.
jai mitchell:
Well if you believe that ENSO, PDO and world temperatures are in anyway linked, then this should prove an interesting graph to examine.
http://climatedatablog.files.wordpress.com/2014/02/pdo-reconstruction-1470-1998-shen-2006-with-gaussian-low-pass-15-and-75-year-filters-and-hadcrut-overlay.png
Dear Jai, C you’ll get the idea. That’s probably a fair estimate of the probable error, and may even be a bit generous given how new ARGO is and all of the calibration etc unknowns, and the sparsity of the grid.
A) HADCRUT4, based on many, many surface thermometers INCLUDING ARGO, only claims 0.15C accuracy (and probably underestimates it as it often differs from e.g. GISS by more than this). It is very, very doubtful that ARGO instrumentation provides a more accurate global average temperature profile to a depth of kilometers than HADCRUT4 can deliver in a single thin surface layer of the planet. A reasonable person could doubt any assertion of “0.1C warming” or cooling either one over a decade (whatever that means in a profile of temperatures bounded 4C below and by the more or less unchanged SST at the top) as being pure “noise”, measurement+method error. Maybe if we write it as
B) The thermohaline cycle time is order of 1000 years and is fairly well understood. The general surface mixing time down to depth is at least some large fraction of this. Sea water per se is thermally stratified and stable, except to the extent that global processes of thermal expansion and variation of salinity/density at the surface destabilize it, maintaining the thermohaline circulation, plus the extent that the trade winds produce a limited churn at the surface. As far as I know, there is no credible way to explain how heat makes it from the surface to uniformly spread itself out in the top kilometer of ocean water in only a decade. Hence the measurement in A), surely down there in the instrumental noise, is extremely dubious because it lacks a credible physical mechanism that could have produced it that is consistent with our measurements of transport processes in the ocean. Note well that one also has to explain why this mechanism just turned on in time to flatten surface temperatures, why all of the supposed surplus heat responsible for the warming in the 80s and 90s didn’t also go into the ocean. In fact, one has to explain a whole lot of things, as it completely changes the energy dynamics of the entire planet if the ocean can uptake all that extra energy on a whim and spread it out at depth. At the very least, all of the GCMs are wrong, badly wrong.
C) But we knew that. The GCMs are the only source for your belief in a power imbalance, because AFAIK we cannot actually measure a global power imbalance at the TOA. We simply do not have accurate enough instrumentation capable of integrating the outgoing spectrum over the entire surface, and there is a lot of noise. The numbers you use are themselves the predictions of GCMs, with assumptions for feedback, the role of aerosols, the heat transport by things like thunderstorms, that may or may not be correct. In any event, the GCMs are proving to be badly wrong in their predictions of global warming, rainfall patterns, the frequency and violence of storms, droughts, floods. Basically, they are individually failed models, models that simply don’t describe the actual data accumulated since they were initialized and set loose. So when Trenberth looks for “missing heat”, he’s doing so to try to rescue one fragile part of the model predictions — that there is indeed an energy imbalance in the first place — while also explaining why temperatures have managed to be flat. Trenberth actually understand this — from what I’ve seen and read, he realizes that the GCMs are toast because for them to work, they will have to actually extend to depth in the ocean and predict the oceanic heat uptake in a quantitative way, including why it turned on in 1997/1998 with the super ENSO, why it was off before then (so the atmosphere warmed instead), why it might turn on or off in the future. Oops. We cannot even solve the atmospheric problem, and now we have to solve the Navier-Stokes equation for two coupled fluids, both with enormously complex, largely unknown nonlinear interactions, on a ridiculously coarse grained grid, to a depth of ten kilometers on both sides!
Good luck with that.
D) Suppose that the 0.1C is, in fact, by incredibly good fortune, precisely correct (whatever it means, again, in a profile to depth). That is great news! That means that the ocean is perfectly capable of buffering the “imbalance” for the next couple of centuries and preventing catastrophic warming, while humans without any extraordinary expenditure or effort gradually wean themselves from burning carbon for energy not to “save the planet” (which probably doesn’t need saving) but because at least some alternative energy sources will within the next decade or two become systematically cheaper than coal-generated electricity. By 2050, it is likely that carbon utilization will be ramping down even if we do nothing. So in the meantime, perhaps we can invest the energies of human civilization in curing real problems like global poverty and ignorance — which requires cheap, plentiful energy — and war. These are contemporary catastrophes that the entire CAGW scandal was engineered (IMO) to distract us from.
rgb
B)
rgb:
I think the best line I heard on all this was the one where it was said, that in that case, if the heat is indeed going into the deep oceans, then that is the best example of natural variability that could be observed to be currently happening :-).
Hmmmm both poles show warming yet the Antarctic ice is increasing?
Riiiiighhhtt.