El Niño and La Niña events are the dominant modes of natural climate variability on Earth, which is why the state of the tropical Pacific is continuously monitored. El Niños and La Niñas impact weather patterns globally. As a number of recent papers have argued, the dominance of La Niña events in recent years is responsible for part of the cessation in global surface warming outside of the Arctic, so by inference, those papers are also stating that a string of strong El Niño events were responsible for part of the long-term warming from the mid-1970s to the turn of the century. There’s nothing new about that; for years we’ve been discussing the naturally occurring, sunlight-fueled processes that drive El Niño events and cause long-term warming of global surface temperatures. If this subject is new to you, see the link at the end of this post for an overview.
The World Meteorological Organization (WMO) provides the following summary of their ENSO forecasts in their January 30, 2014 El Niño/La Niña Update:
- ENSO conditions are currently neutral (neither El Niño nor La Niña);
- As of mid-January 2014, except for a small possibility for weak and brief La Niña development during the next couple of months, outlooks indicate likely continuation of neutral conditions into the second quarter of 2014;
- Current forecasts indicate approximately equal chances for neutral conditions or the development of a weak El Niño during the third quarter of 2014, reflecting increased chances for development of a weak El Niño.
It appears no one is suggesting that a full-fledged La Niña will form for the 2014/15 season. As of the week centered on February 5th, the sea surface temperature anomalies of the NINO3.4 region of the equatorial Pacific indicated that the tropical Pacific was experiencing La Niña conditions, though not an “official” La Niña. See the monthly sea surface temperature update for January 2014.
What’s your prediction? Please provide links to the variables you monitor. Here’s what I predict.
I predict, if we see El Niño conditions, global warming enthusiasts will cheer, because they have forecast, in turn, that record high global temperatures will accompany the next El Niño. And I predict, if we see La Niña or ENSO-neutral conditions, skeptics will cheer, because global surface temperatures should continue to remain flat. (Other than that, I don’t make predictions.)
The ENSO wrap-up from Australia’s Bureau of Meteorology (BOM) for February 14, 2014 provides a similar loose forecast. (For those who live north of the equator, keep in mind the BOM is discussing austral seasons.)
And NOAA’s CPC has a similar mix of possible scenarios in their Weekly ENSO Update dated February 10, 2014—though the NCEP’s models are forecasting El Niño conditions starting in April-June 2014. See page 27.
The WMO briefly mentions the problems with ENSO predictions during this part of the year. They write:
It must be noted that model outlooks that span March-May period tend to have particularly lower skill than those made at other times of year. Hence some caution should be exercised when using long range outlooks made at this time for the middle of the year and beyond.
ENSO predictions at this time of year are hampered by a problem called the Spring Prediction Barrier. See the discussion at the IRI website here. But a series of new papers claim to have overcome that hurdle.
The recently published Ludescher et al (2014) Very Early Warning of Next El Niño (paywalled) are predicting El Niño conditions by late 2014. The abstract reads:
The most important driver of climate variability is the El Niño Southern Oscillation, which can trigger disasters in various parts of the globe. Despite its importance, conventional forecasting is still limited to 6 mo ahead. Recently, we developed an approach based on network analysis, which allows projection of an El Niño event about 1 y ahead. Here we show that our method correctly predicted the absence of El Niño events in 2012 and 2013 and now announce that our approach indicated (in September 2013 already) the return of El Niño in late 2014 with a 3-in-4 likelihood. We also discuss the relevance of the next El Niño to the question of global warming and the present hiatus in the global mean surface temperature.
Global warming enthusiasts have already started cheering for an El Niño. See the Michael Slezak article in NewScientist titled El Niño may make 2014 the hottest year on record. And Andrew Freedman of ClimateCentral begins his post Study Sounds ‘El Niño Alarm’ For Late This Year:
A new study shows that there is at least a 76 percent likelihood that an El Niño event will occur later this year, potentially reshaping global weather patterns for a year or more and raising the odds that 2015 will set a record for the warmest year since instrument records began in the late 19th century.
Ludescher et al (2014) appears to be based on Ludescher et al (2013) Improved El Niño forecasting by cooperativity detection (paywalled). We discussed the earlier Ludescher et al paper in the July 2013 post El Niño in the News. I closed that post with:
DID GLOBAL WARMING CAUSE THE EL NIÑOS OR DID EL NIÑOS CAUSE GLOBAL WARMING?
Numerous datasets indicate that El Niño events are fueled naturally. Additionally, satellite-era sea surface temperature records indicate that El Niño events are responsible for the warming of sea surface temperatures over the past 31 years, not vice versa as Li et al (2013) have suggested. If this topic is new to you, refer to my illustrated essay “The Manmade Global Warming Challenge” [42MB].
RoHa says:
February 15, 2014 at 8:37 pm
Your brain is shutting down?
=========
wrong location. go to Real Climate for that.
Pippen Kool says:
February 15, 2014 at 6:56 pm
“But was Abbot talking about temps? No. He was talking about ice. And in the 30s, ice in the arctic was huge. Look at the pict here:”
Like I said, we didn’t have satellite images from the time. You have an old drawn map and just act as though there wasn’t extreme melting. We know there was,
http://mclean.ch/climate/Arctic_1920_40.htm
We just don’t know how extreme. Of course, if you base it off the Sea Level rise I provided…
Plus, you oddly use a link to a 2012 photo against that map as your proof. Why not use the most recent August? You know, August 2013…
http://en.es-static.us/upl/2013/12/arctic-sea-ice-2012-vs-2013.jpg
That is your Aug12 & Aug13, with Aug13 looking a whole heck of a lot more like your Map.
But that is all besides the point; the same amount of ice melt shouldn’t be expected for one huge reason…
“I think a few years of warm temps are not enuf to affect the ice that much. You need a few decades…and we have had them now.”
The Arctic didn’t really start coming out of the LIA until the late1800s/early1900s. The 1920s-1940s marked by far the quickest and highest temperature rises out of said LIA. And we’re talking +2 degrees, over only a very low and slow rise prior. When that temperature spike hit, they were sitting at Ice Levels which had been building up for the past roughly 800 years of extreme colds. Of course that is going to melt at a different rate than the melting of that periods leftovers and whatever built up in the cold of the 60s-70s. That is a given! And wouldn’t you consider that a bigger influence on the amount of melt than your (incorrect) “need a few decades” line?
As I initially stated, attempting to measure Ice is impossible and would be meaningless anyway because of the drastic difference in the situations. In the end, all that really matters with regards to the Arctic and “Global Warming” is this:
“The Arctic 1920–40 warming is one of the most puzzling climate anomalies of the twentieth century. Over some 15 yr the Arctic warmed by 1.78C and remained warm for more than a decade. This is a warming in the region comparable in magnitude to what is to be expected as a consequence of anthropogenic climate change in the next several decades. A gradual cooling commenced in the late 1940s bringing the temperature back to much lower values, although not as cold as before the warming started.”
http://www.nerc-essc.ac.uk/~olb/PAPERS/len19.pdf
You have multiple decades of completely Natural Warming comparable to what has been experienced/is expected of “Man Made Global Warming”. One of those two periods, we are somehow told, could absolutely only be caused by man… A preschooler could tell you that is a nonsensical stance.
For all absolutely anyone knows, recent Arctic Warming (which didn’t really start until the 1990s) is 100% Natural following the same pattern of the 1930s.
By the way, here are the actual temperatures where you can see the periods in question for yourself
http://earthobservatory.nasa.gov/Features/ArcticIce/Images/arctic_temp_trends_rt.gif
Entering my two cents.
The phase will be la~nada to la~ninia.
My reasoning is Antarctic albedo, deep water cold returns which are cooling some of the input to the warm pool and solar blocking of equatorial waters (equatorial cloud cover). I simply do not see the warm pool recharging enough to cause a deep El~Nino.
As the winds and flows shift I do not think it will be enough to cause any major uptick in anything at this point. Even the Arctic Deep Water Cold Return is showing its cold side in Europe right now. There simply isn’t enough warm water to create a deep El~Nino
Thanks Bob for the post.
I would like to see an El Nino, but doubt it can happen to any reasonable degree for reasons Bill Illis has covered. Reason being that I would like to see El Nino is it will precede another very strong 2 year La Nina.
As it stands I think it will happen anyway, in 2015 – 2017. The degree of how strong the La Nina will be will depend on this years El Nino development IMO. Again, as others have said, this warm pool will peter out as it surfaces unless we see a big westerly wind burst. SOI has now gone negative which usually precedes a WWB. So we will get the warm water moving East, but very unlikely it can amount to an El Nino of any significance.
Also, this year is almost a repeat of 2009 here. In 2009 in Australia, we have record heat in Jan/Feb, which bought on the Black Saturday bushfire tragedy, then a scorching early Spring. Then, humidity increased in November and we were deluged, rain was consistent for the summer months with big storms all summer, despite the El Nino peaking in Jan 2010. Was very odd summer, this summer here has been much more El Nino like for most of the Eastern half of the country. Then in autumn 2010 we were greeted with ridiculous humidity, the worst I have experience in my 40 years.
And we all know what happened next, we were torn a new one for the next 30 months.
So far at this early stage I see a carbon copy, but as the months go on im looking for an increase in humidity to see if it turns out the same.
A weak La Nina . It’s the sun, even thou climate scientists don’t see the full mechanism yet, and the very active typhoon season of this past took a huge chunk of energy out of the tropical W. Pacific.
Ive been saying for 6 months that there will be a La Nina early this year, which is now happening.
There will be no el Nino.
–Is the Equatorial Pacific Ocean Entering a Cooldown Phase? —
I am a pure weather amateur, an agricultural commodities analyst wading into deep meteorlogy, but here in Southeast Asia, I can’t help but notice one anomalous piece of weather behavior, and a possible answer.
For the last six weeks, we have had a fairly serious drought over Singapore and Malaysia, which usually occurs during El Nino events…BUT at this time, unlike the last few occasions, there is no El Nino event to explain the drought. Instead, the Nino 3.4 SST anomaly is negative, around -0.35. That is near the -0.5 borderline between normal and La Nina conditions, which usually make Southeast Asia cloudy and rainy, not dry as it is at this time.
But I also noticed that from December to January, the SST anomaly both in the Nino 4 region (nearest Southeast Asia) and Nino 3.4 region each fell in temperature by 0.3C degrees each.
Is it possible that on one hand
– we are seeing no El Nino because the east equatorial Pacific is staying cool as one would expect in neutral or La Nina phases
– at the same time, the west equatorial Pacific is also cooling off, resulting in less Southeast Asian rainfall
Conclusion – the El Nino forms when Southeast Asia’s water’s cool off and east Pacific equatorial waters warm up.
This time, could both Southeast Asia and equatorial east Pacific waters be cooling off at the same time, which would
1) Explain Southeast Asia’s nasty drought happening without the usual accompanying El Nino event
2) Imply that rather than one end of the Pacific warming up/cooling off relative to the other, the entire equatorial Pacific is cooling off, which would make simultaneous arid conditions in Southeast Asia and Latin America possible?
This is not my usual field of expertise, so I hope I am not too vague in what I’m trying to express.
With my Artificial Neural Network (ANN) where I have applied feedback on ENSO forcing and on ENSO forecast I expect that ENSO is going to be in La Niña conditions at the end of this year.
My result show that ENSO is mainly driven by a combination of tidal and magnetic forcing.
http://www.global-warming-and-the-climate.com/enso-and-tidal-forcing.htm
Because there hasn’t been an El Niño since 2010 many forecasters expect ENSO to be in El Niño position at the end of this year.
Well, I expect them to be wrong on this specific forecast, as my result indicate that ENSO is going to be in La Niña or possible in neutral positions at the end of this year.
But, I think it is going most likely to be a La Niña.
@eric j brooks
well put your prediction and mine
http://wattsupwiththat.com/2014/02/15/el-nino-or-la-nada-for-the-201415-enso-season/#comment-1568484
together
and what do we see?
it is lalala….
going to get cooler
yes sir
global cooling is here to stay
which means the jets stay further south (hence the flooding of England)
and it is going to get drier at the higher latitudes…..
http://blogs.24.com/henryp/2013/04/29/the-climate-is-changing/
sorry
I made a mistake there
I meant to address my comment to
Per Strandberg
but it does not matter
Eric is also my man if he with me on La Nina by the end of 2014?
gymnosperm: Matthew Marler:
We do not have DATA to rule it out, but that just puts us back in the normal human condition where all the important decisions in our lives are made with insufficient data. We are left with a few disjointed smatterings of equivocal data, logic, and thought experiments.
One of the things we don’t know is whether the Earth is warmer now than it would have been without the CO2 that has accumulated since about 1850. We do not have detailed information on the natural variability absent that increased CO2; we have a perfectly reasonable, yet incomplete and inaccurate, prima facie case that increased CO2 should lead to increased heat accumulation somewhere in the system.
Was the increase in global mean temp from about 1975 to about 1995 greater than it would have been without CO2? I doubt it, but why would anyone claim certainty one way or another? did the Warming from ’75 to ’95 contribute to the unusually large el Nino of 1997-1998? I don’t know the answer to that either, but if global heat is the fuel of el Nino, then maybe it did. Is there a causal chain between increased CO2 of the post WWII era, the warming of ’75-’95, and the unusually large el Nino that followed? I think that the bulk of the evidence and dynamical modeling theory and experience that I have referred to above gives the answer “maybe”.
I have argued elsewhere that increased CO2 in the atmosphere might produce increased evaporation of water from the non-dry parts of the Earth surface with little or no increase in surface temperature in those areas, analogous to the reasoning of Gail Combs above. that might produce increased cloud cover and decreased net surface insolation.
Pippen Kool says:
February 15, 2014 at 6:56 pm
“But was Abbot talking about temps? No.
All instrumental data available around the Arctic show very little difference in temperature between 1930s/1940s and recently.
“The period from 1928–1935 also had a dipole structure in SLP, which contributed to the interdecadal arctic-wide warm temperature anomalies in the first half of the 20th century.”
http://onlinelibrary.wiley.com/doi/10.1029/2005GL024254/abstract;jsessionid=01914DC09BB59D049E9750B4AC0849DC.f04t01?deniedAccessCustomisedMessage=&userIsAuthenticated=false
“The European Arctic experienced a pronounced warming around 1920 and a sustained warm period in the 1920s and 1930s. The causes of this climatic event are not fully known. However, understanding this event is considered important for assessing current and future climate change in the Arctic. ”
“The strongest warming at the ground from the 1910s to the 1920s and 1930s was found in wintertime.”
http://www.ingentaconnect.com/content/schweiz/mz/2009/00000018/00000004/art00006
DMI in the Arctic above 80N+ also shows the strongest warming to be in wintertime.
“The annual temperature has increased in Svalbard and Jan Mayen during the latest decades, but the present level is still lower than in the 1930s.”
http://onlinelibrary.wiley.com/doi/10.1111/j.1751-8369.2003.tb00102.x/abstract
“During the 1920s and 1930s, there was a dramatic warming of the northern North Atlantic Ocean. Warmer-than-normal sea temperatures, reduced sea ice conditions and enhanced Atlantic inflow in northern regions continued through to the 1950s and 1960s, with the timing of the decline to colder temperatures varying with location.”
“The warming in the 1920s and 1930s is considered to constitute the most significant regime shift experienced in the North Atlantic in the 20th century.”
http://www.sciencedirect.com/science/article/pii/S0079661106000036
The North Atlantic ocean flows up towards the Arctic ocean where it sinks and therefore any sudden change here will have pronounced knock on effects there.
Therefore you need to explain how that map could be possibly correct with very limited Arctic ice data available then, when there is evidence to the contrary.
RichardLH says: “Do you know where (or if) it is possible to pick up previous forecasts?”
Have you tried the IRI website?
http://iri.columbia.edu/climate/ENSO/currentinfo/SST_table.html
In fact, that’s where I may have seen the discussions of model performance.
NOAA recently obsoleted their older ENSO-prediction models (within the last year, I believe), so they won’t have a history of the newer models (NCEP CFSv2) that’s more than a couple of years old.
Matthew R Marler says: “So if an increase in atmospheric CO2 concentration produces an increase in downward shortwave radiation, does that not create more fuel, e.g. warmer water?”
Show me the warmer water, Matthew. Ocean Heat Content for the tropical Pacific has cooled since 1999:
http://bobtisdale.files.wordpress.com/2014/01/figure-4.png
And subsurface temperatures for the entire Pacific (0-2000 meters) have warmed very little during the ARGO era:
http://bobtisdale.files.wordpress.com/2014/01/nodc-argo-era-vertical-mean-temp-per-basin-to-2013.png
The only ocean basins that are warming are the South Atlantic and Indian Oceans.
The two graphs are from the following post:
http://bobtisdale.wordpress.com/2014/01/31/open-letter-to-kevin-trenberth-ncar/
Taphonomic says: “Bob, minor typo. You got the title of Ludescher et al. wrong, it should be ‘Very Early Warning of Next El Niño’ not ‘Very Early Warming of Next El Niño’”
Thanks for finding that. Corrected.
The coming La Nina will be neither weak nor brief.
Those waiting for el Ninot will go on waiting.
“Therefore you need to explain how that map could be possibly correct with very limited Arctic ice data available then, when there is evidence to the contrary.”
DS also explains that well, when clearly we talking about large yearly changes in Arctic sea ice. What you have shown on that map despite being likely unreliable was also very likely caused by the weather pattern that year.
http://en.es-static.us/upl/2013/12/arctic-sea-ice-2012-vs-2013.jpg
With low pressure remaining persistently over the Arctic during that month in 1933 it would have only favored more ice than usual.
http://www.wetterzentrale.de/pics/archive/ra/1933/Rrea00119330806.gif
http://www.wetterzentrale.de/pics/archive/ra/1933/Rrea00119330813.gif
http://www.wetterzentrale.de/pics/archive/ra/1933/Rrea00119330824.gif
Pressure over the Arctic was higher during 2012, explaining lower ice levels compared with 2013 and 1933.
http://www.wetterzentrale.de/pics/archive/ra/2012/Rrea00120120805.gif
http://www.wetterzentrale.de/pics/archive/ra/2012/Rrea00120120813.gif
http://www.wetterzentrale.de/pics/archive/ra/2012/Rrea00120120825.gif
Gail Combs says:
February 15, 2014 at 7:16 pm
“Darn my link did not work GRAPH of adjustments ”
http://i29.photobucket.com/albums/c274/richardlinsleyhood/Fig8HadCrutGISSRSSandUAHGlobalAnnualAnomalies-Aligned1979-2013withGaussianlowpassandSavitzky-Golay15yearfilters_zps670ad950.png
And if you look at the graph I supplied you can see how the GISS adjustments that Steve notes go even further back to keep GISS below HadCrut almost to the start of the record when they mysteriously come back together again.
Now I don’t know how that ‘trick’ is pulled off but it is there for all to see.
What has Arctic temperatures got to do with ENSO?
While the PDO is positive the Arctic has warmer ocean currents flowing into it from the transfer of energy via surface ocean currents from stronger/more frequent El Nino events.
While the PDO is negative the Arctic has cooler ocean currents flowing into it from the transfer of energy via surface ocean currents from weaker/less frequent El Nino events.
Pippen Kool says: “A more plausible way to look at it is that during La Niña the delta T from air to water is high, and more energy than normal ends up going into the water, warming the water in the Pacific…”
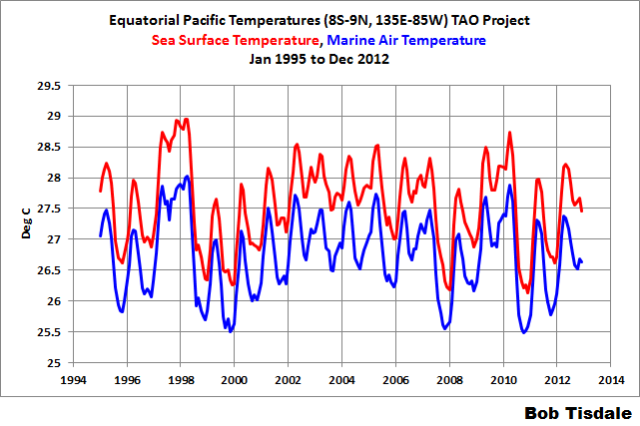


Data disagrees with your speculation, Pippen Kool. The following graph compares the sea surface temperatures and marine air temperatures from the TAO project buoys, for the period of January 1995 to December 2012. As you’ll note, monthly marine air temperature for the equatorial Pacific is always cooler than sea surface temperatures:
And the temperature difference between the marine air and sea surface temperatures (SST MINUS MAT) DECREASES (not increases) during La Niñas, Pippen Kool:
Just in case you’re having trouble see the relationship to ENSO, here’s the difference smoothed with a 12-month filter:
Obviously, your speculations are contradicted by data. You couldn’t be more wrong if you tried.
Come on back when you’re done speculating. That is, bring some data with you when you want to try to explain how ENSO works. Otherwise, you’re wasting your time and mine.
Have a good day.
The Weekly GODAS data was updated to Feb 12 overnight.
Now we are seeing movement towards an El Nino with the warm undercurrent moving farther east, cold water is infiltrating down at 120E to 130E, surface currents have slowed considerably or started moving east in the central Pacific and there is large weakening of the Trade Winds in the central Pacific. I change my mind everytime a new set of data comes out. Predicting a self-reinforcing oscillation is tricky business.
http://www.cpc.ncep.noaa.gov/products/GODAS/pent_gif/xz/movie.temp.0n.gif
http://www.cpc.ncep.noaa.gov/products/GODAS/pent_gif/xy/movie.uv15m.gif
http://www.cpc.ncep.noaa.gov/products/GODAS/pent_gif/xy/movie.h300.gif
http://www.cpc.ncep.noaa.gov/products/analysis_monitoring/enso_update/ua850_c.gif
Pippen Kool says: “A more plausible way to look at it is that during La Niña the delta T from air to water is high, and more energy than normal ends up going into the water, warming the water in the Pacific…”
No, that is not observed.
In the tropics oceans are the warmest source and with little height decrease in temperature all way up to the stratosphere. Hence, the warming source is the ocean and with it always losing energy warms to atmosphere less efficiently the higher above it.
There is a simple scientific explanation for this and that is the atmosphere only traps some of the energy from the sun directly. The heat capacity of the water is much greater than the atmosphere, so itself is able to trap far more energy from solar energy than the atmosphere can. Hence, why the ocean is the warmest source and itself warms the atmosphere much greater than if only the atmosphere existed.
Bob, the charts that you just posted: ” The following graph compares the sea surface temperatures and marine air temperatures from the TAO project buoys, for the period of January 1995 to December 2012. As you’ll note, monthly marine air temperature for the equatorial Pacific is always cooler than sea surface temperatures.”
I had not seen this data before- It says that the thinking that the tropics are cooled by clouds, thunderstorms, etc. is probably wrong. The source of cooling is the ocean, not the atmosphere. We need to look at this very closely.
I looked at the data wrong, the atmosphere does cool the ocean.
Thanks Bob. Your response at 4:46 am to PK and the accompanying chart with air vs water temps is interesting. It made me realize if air is warmer than water, the WV from the air will condense onto the water surface cooling the air. If the air is cooler than the water, then the water surface will evaporate and condense into the air, warming it. With a difference over three orders of magnitude in mass. any heat going into the water is negligible, but vice versa, the air is heated significantly. With the SST above the air temperature consistently the ocean is heating the atmosphere, not the other way around. Never really put it together that way in total. Thanks again.