 (Perturbation Calculations of Ocean Surface Temperatures.)
Guest essay by Stan Robertson, Ph.D., P.E.
1. Introduction
It is generally conceded that the earth has warmed a bit over the last century, but it is not clear what has caused it, nor whether it will continue and become a problem for humanity. There is a possibility that some of the warming has been caused by anthropogenic greenhouse gases, but it is also likely that the sun has been partially responsible. The arguments that are advanced to say that humans caused it and that it will become a serious problem rely on models that have not been validated and positive feedback effects that have not been shown to exist, at least at the hypothesized levels of effectiveness. The apparent weakness in the argument that the sun has been a major contributor is that satellite measurements of Total Solar Irradiance (TSI) have not shown changes large enough to have directly produced the warming of the earth over the last half century. But what about indirect effects? Is it possible that the sun exerts control in some indirect way? In these notes I recapitulate the evidence that this is the case by showing that the variations of TSI cannot provide the energy that is necessary to account for the warming of the oceans during solar cycles.
TSI, as measured above the earth’s atmosphere varies by about 1.2 watt/m2 over a nominal eleven year solar cycle (h/t Leif Svaalgard) primarily at wavelengths shorter than 2 micron. The dominant harmonic variation of TSI would thus have an amplitude half this large, or about 0.6 watt/m2. About 70% of this enters the earth atmosphere. Averaged over latitudes and day/night cycles, about one fourth of this 70%, or ~0.11 watt/m2, on average, enters the upper atmosphere. Since only about 160 watt/m2 of 1365 watt/m2 of incoming solar radiation at wavelengths less than 2 micron reaches the earth surface, the amplitude of short wavelength TSI reaching the earth surface would be only (160/1365)x0.6 = 0.07 watt/m2. However, about half of the difference between 0.11 and 0.07 watt/m2 eventually reaches the earth surface as scattered thermal infrared radiation at wavelengths greater than 2 micron. Thus the average amplitude of TSI reaching the earth surface in all wavelengths would be about 0.09 watt/m2. So the question is, just how much sea surface temperature variation can this produce?
Several researchers, including Nir Shaviv (2008), Roy Spencer (see http://www.drroyspencer.com/2010/06/low-climate-sensitivity-estimated-from-the-11-year-cycle-in-total-solar-irradiance/) and Zhou & Tung (2010) have found that ocean surface temperatures oscillate with an amplitude of about 0.04 – 0.05 oC during a solar cycle. (In fact, all of the ideas that I am presenting here were covered in Shaviv’s work, but it has not gotten the attention that it deserves.) Using 150 years of sea surface temperature data, Zhou & Tung found 0.085 oC warming for each watt/m2 of increase of TSI over a solar cycle. Although not strictly sinusoidal, the temperature variations can be approximately described in terms of a dominant sinusoidal component of variation with an 11 year period. Thus the question to be answered at this point is, can 0.09 watt/m2 amplitude of variation of TSI entering the oceans produce temperature oscillations with an amplitude of 0.04 – 0.05 oC?
The answer to this question depends on the average thermal diffusivity of the upper oceans. That is an unknown, but not unknowable, quantity. Thermal diffusivity is the ratio of thermal conductivity to heat capacity. The upper 25 to 100 meters of oceans are well mixed by waves and shears. These are mixing zones with high thermal diffusivity and correspondingly small temperature gradients. Diffusivities are lower at greater depths. Bryan (1987) has found that thermal diffusivities ranging from 0.3 to 5 cm2/s are needed to account for the temperature profiles below the mixing zone. In my first trial calculations of the energy flux necessary to account for the temperature variations, I tried values of thermal diffusivity in the range 0.1 – 10 cm2/s and found that the TSI variations were generally inadequate to produce the sea temperature variations over a solar cycle. But there was wide variation of calculated energy flux. Larger values of thermal diffusivity required more heat because more was able to penetrate to the depths, but even for 0.1 cm2/s, the required input was double the TSI variations that reach the earth surface. Fortunately, there is a way to constrain both the value of the thermal diffusivity and the heat input. It consists of first matching the measured trends of surface temperatures and ocean heat content over time. Measurements of these were reported by Levitus et al. (2012) and are available from http://www.nodc.noaa.gov/OC5/3M_HEAT_CONTENT/ .
In the calculations described below, I have used the data from 1965 to 2012 for ocean depths to 700 meters. Sea surface temperatures and ocean heat content began to increase after 1965. Only about a third of the increase of heat content occurred at depths below 700 meter. Since little heat migrates below this depth over 11 year solar cycles, it is preferable to use the 0 – 700 m data for the purpose of calibrating the thermal diffusivity
2. Heat Transfer Perturbation Calculations
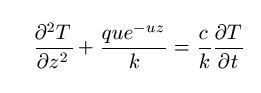
For the calculation of sea surface temperature and sea level changes, we can treat the variations of radiations entering and leaving atmosphere, lands and oceans as minor perturbations on an earth essentially in thermal equilibrium. Ocean mixing zones, thermoclines and other features of the temperature profiles remain largely as they were while small radiant disturbances produce minor variations of temperature starting from zero, and imposed at each depth. Thus the effects of these disturbances can be modeled as one-dimensional energy flows into a medium at uniform temperature. Such “perturbation calculations” are among the most powerful analysis techniques used by physicists and engineers and are widely used. The energy equation to be solved in this case is:
http://i1244.photobucket.com/albums/gg580/stanrobertson/equation_zpscea297ad.jpg

Where T is the temperature departure from equilibrium at depth , z, and time, t. q is a perturbing radiant flux entering the surface, u the absorption coefficient, c is absorber heat capacity and k its thermal conductivity. The rate of heat transfer by conduction processes is controlled by the thermal diffusivity, which is the ratio k/c.
As a one dimensional heat flow problem, it is straightforward undergraduate level physics or engineering to numerically solve the equation above for the expected changes of surface temperature as surface radiant flux varies. In my calculations, temperature changes were calculated for 1.0 meter increments of depth in the oceans. Two cases were considered. In one
case the surface radiation perturbation was assumed to increase linearly with time. This corresponds to the ocean conditions for the period 1965-2012. In the second case, it was assumed to vary as a cosine function of time with the 11 year period of the solar cycle. The cosine function provides both some positive and some negative variation in the first half cycle, which helps to minimize the transients of the first few years.
I treated q and thermal diffusivity, (k/c), as input parameters that were chosen to provide agreement with the observed sea surface temperature variations and ocean heat content measurements (https://www.ncdc.noaa.gov/ersst/ ). The absorption coefficient, u, was entered in piecewise fashion. Only the deep UV radiations penetrate to depths below 10 meter, but conduction takes energy to much greater depths. For the values of u chosen, only 44.5% of the surface energy flux goes deeper than 1 meter, 22.5% below 10 meter and 0.53% to 100 meter (h/t Leif Svalgaard). Thermal diffusivity of oceans was assumed to be 0.3 cm2/s below 300 m. This accords with Bryan’s estimates below the mixing zone, but little change of results occurred for values as low as 0.1 cm2/s. The required heat inputs are relativity insensitive to the thermal diffusivity below 300 meter. For the shallower depths, thermal diffusivity was varied until trends in accord with observed temperatures and heat content were produced.
It is necessary to maintain an energy balance at the sea surface in approximate equilibrium with the incoming solar radiation. As estimated by Trenberth, Fasullo and Kiehl (2009), about 160 watt/m2 enters the surface, on average. At a mean temperature of 288 oK, the sea surface will emit about 390 watt/m2 of surface thermal infrared radiation at wavelengths longer than about 2 micron, however, about 84% of that is returned as back scattered radiation. The rest of the energy balance is provided by evaporation and thermal convection, which remove about 59% of the heat from the surface. From the standpoint of merely wanting to know how much heat is required to change the ocean surface temperature, it is possible to maintain a proper energy balance without delving into the messy details of evaporation, convection and infrared absorption in the first few millimeters of water. The temperature variations at one meter depth will not be measurably different from those at the surface for the thermal diffusivities of interest here. If we merely want to know what net energy flux entering the surface is required to make the water temperature at one meter depth oscillate with an amplitude of 0.04 – 0.05 oC , then all we need to do is account for the outgoing surface infrared emission and let 41% (160 watt/m2 / 390 watt/m2 = 0.41) escape. At the present 288 oK, the earth radiates an additional 5.42 watt/m2 for each 1 oC increase of surface temperature. In the case of surface temperature being perturbed by 0.04 oC, an outgoing additional 0.22 watt/m2 would be generated and 0.09 watt/m2 was allowed to escape. This nicely balances the amplitude of TSI variations that reach the earth’s surface.
3. Linear heating:
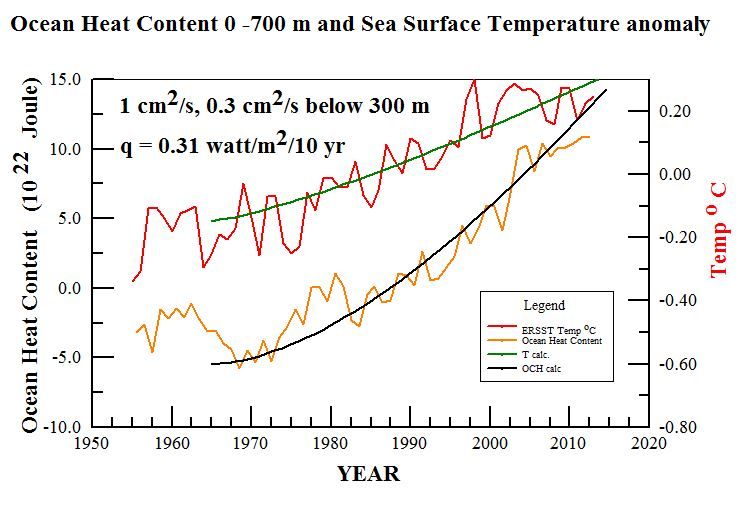
In these calculations, the aim was to find the heat input and thermal diffusivities necessary to account for the observed surface temperature increase (http://www.nodc.noaa.gov/OC5/3M_HEAT_CONTENT/ )Extended Reconstructed Sea Surface Temperature) and the increased ocean heat content (OHC 700) that have been reported by NOAA. Since surface temperatures had not been increasing in the early 1960s, but began to increase in the last half of that decade, I chose to start calculations with linearly increasing heating in 1965. I found that the ocean heat content to a depth of 700 meters was quite sensitive to the thermal diffusivity used. The best results that I have been able to obtain were for a thermal diffusivity of 1 cm2/s to 300 meter depth and surface heat input increasing at a rate of 0.31 watt/m2 per decade. These are shown on the graph below with calculated trends shown by the green and black lines. On a time scale of 50 years, most of the heat accumulates at relatively shallow depths. To better reflect a realistic thermal diffusivity for greater depths, I used a lower value of 0.3 cm2/s below 300 meter. That has little practical effect on a 50 year times scale, but would be necessary if one wanted to extend the calculations for several centuries while surface heating perturbations had time to penetrate to much greater depths.
http://i1244.photobucket.com/albums/gg580/stanrobertson/OHC700_zpsb9e34e91.jpg

Figure 1. Ocean heat content 0 – 700 meter and surface temperature trends according to NOAA. Blue and green lines show trends calculated for the parameters shown.
These calculations establish some parameters that do a good job of representing the thermal behavior of the upper oceans, however, if one looks closely at the data trends in the graph, it is apparent that both surface temperature and ocean heat content have considerably slowed their rates of increase in the last decade. This makes it unlikely that greenhouse gases are the cause of the rate of heating needed to explain the previous trends because their effects should have become enhanced rather than diminished. It might also be noted that a similar warming trend occurred in the first half of the previous century before anthropogenic greenhouse gases could have contributed significantly. Thus it is more likely that both warming periods had natural origins.
Obtaining simultaneous fits to the ocean heat content and sea surface temperature trends with only two free parameters, thermal diffusivity and surface heating rate, is quite confining. Acceptable, but noticeably worse, fits than shown above, were obtained with thermal diffusivities ranging from 0.8 to 1.2 cm2/s and heat inputs ranging from 0.29 to 0.33 watt/m2. Based on previous calculations for sea level data, I was initially inclined to think that larger thermal diffusivities would be necessary, but larger values let more heat penetrate to greater depths than the amounts of heat reported by Levitus et al. In addition, I was chagrined to learn that most of the variation of sea level that accompanies solar cycles is caused by evaporation rather than thermal expansion.
Solar Cycles:
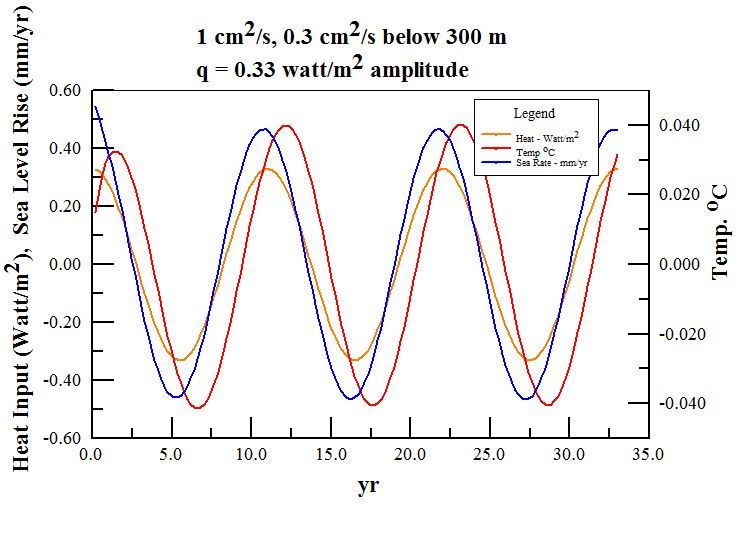
The process of choosing thermal diffusivity and surface heating rates to accord with observations provides a sound basis for calculating what to expect for the temperature variations during solar cycles. In this case we can use the thermal diffusivity of 1 cm2/s that is required of the ocean heat content results as an input parameter and choose the heat input that is required to produce temperature variations of 0.04 – 0.05 oC amplitude. Producing sea surface temperature variations with an amplitude of 0.04 oC requires a surface heat input of 0.33 watt/m2, as shown below:
http://i1244.photobucket.com/albums/gg580/stanrobertson/solarcycle10_zpsa3b8b0ee.jpg

Figure 2. Radiant flux, ocean temperature oscillations, and sea level variations for three solar cycles of eleven years each. The entering flux shown here is the value of q = 0.33 watt/m2 needed to drive the variations of surface temperature of 0.04 oC with ocean thermal diffusivity of 1.0 cm2/s to depth of 300 m. The amplitude of thermosteric rate of change of sea level was 0.47 mm/yr. Temperature lags the driving energy flux by 15 months. The thermal expansion coefficient of sea water used here was 2.4×10⁻⁴/ oC.
I believe that this settles the issue of what is required to produce sea surface temperature oscillations with an amplitude of 0.04 oC. The solar TSI variations that reach the earth’s surface are smaller than the 0.33 watt/m2 needed to account for sea surface temperature variations by a factor of 3.6 for this smallest estimate of sea surface temperature variability.
Although the estimated 0.33 watt/m2 that is required to explain the surface temperature variations is large compared to the amplitude of TSI variations that reach the surface, it is still only about two parts per thousand of the 160 watt/m2 of solar UV/VIS/NIR that reaches the earth surface. There are many possible ways in which the sun might modulate the surface energy flux to this extent. These include modulation of cloud cover and small spectral shifts in the energetic UV that might modulate ozone absorption or produce shifts of the effective sea surface albedo. It would seem to be a fairly direct radiative effect, rather than feedback, since it must vary in phase with the solar cycle.
In summary, my calculations based on energy conservation considerations imply that the sun modulates the ocean temperatures to a much greater extent than can be provided solely by its TSI variations. The great question that desperately needs an answer is how does it do it? It should be easily understood that solar effects would not necessarily be confined to cycles. More likely, the sun has been the driver of the large changes of temperatures of the Roman and Medieval warm period, the Little Ice Age, and the recent recovery from it without requiring large changes of its own irradiance. When we understand how the sun does this, we will have begun to understand the earthly climate.
###
Biographical note:
Stan Robertson, Ph.D, P.E, retired in 2004 after teaching physics at Southwestern Oklahoma State University for 14 years. In addition to teaching at three other universities over the years, he has maintained a consulting engineering practice for 30 years.
References:
Bryan, F., 1987: Parameter Sensitivity of Primitive Equation Ocean General Circulation Models. Journal of Physical Oceanography, 17, 970-985. (PDF available here http://journals.ametsoc.org/doi/abs/10.1175/1520-0485%281987%29017%3C0970%3APSOPEO%3E2.0.CO%3B2
Levitus, S. et al., 2012 World ocean heat content and thermosteric sea level change (0–2000 m), 1955–2010, Geophysical Research Letters, 39, L10603, doi:10.1029/2012GL051106, 2012 http://onlinelibrary.wiley.com/doi/10.1029/2012GL051106/abstract
Shaviv, Nir 2008, Using the oceans as a calorimeter to quantify the solar radiative forcing, Journal of Geophysical Research, 113, A11101 http://www.sciencebits.com/files/articles/CalorimeterFinal.pdf
Trenberth, K., Fasullo, J., Kiehl, J. 2009: Earth’s Global Energy Budget. Bull. Amer. Meteor. Soc., 90, 311–323. doi: http://dx.doi.org/10.1175/2008BAMS2634.1 www.cgd.ucar.edu/staff/trenbert/trenberth.papers/TFK_bams09.pdf , Fig. 1
Zhou, J. and Tung, K. ,2010 Solar Cycles in 150 Years of Global Sea Surface Temperature Data, Journal of Climate 23, 3234-3248 http://journals.ametsoc.org/doi/abs/10.1175/2010JCLI3232.1
My guess is that it is something to do with evaporation and clouds, with differential effects over different lattitudes under increased solar radiation.
The higher latitudes heat faster with increased solar radiation due to increased water vapour in the air and lessening cloud cover where humidity levels are low, whilst the tropics dont heat much under the same conditions because more evaporation and clouds occur under higher humidity which act together as a buffer, with evaporation being endothermic and a negative feedback. Endothermic reactions are unusual and rare in nature, but might explain why the tropics dont warm much with either increased solar radiation or increased greenhouse gases. But where there is low humidity, solar effects are magnified because not much evaporation occurs, cloud cover is reduced with slight warming, and the extra water vapour acts as a greenhouse gas under those conditions, rather than as a negative feedback under high humidity conditions. This is similar to Eschenbach’s idea of tropical thunderstorms being a kind of thermostat.
lsvalgaard says:
October 10, 2013 at 3:41 pm
Explain how any or all of these can supply 3.6 times MORE energy than the variation of the TOTAL energy received from the sun.
————————————————————————————————————–
Because the measurements are at different places. TSI is measured at the top of the atmosphere, the energy “entering” the climate system is (essentially) at the bottom of it.
Many processes in the atmosphere itself affect how much of the TSI at the top gets to pass through to the bottom in order to be captured by the climate system. Much of the total available is rejected before it can warm anything. It’s entirely possible that the small variations in TSI affect that transmission in some way, possibly yet to be discovered, allowing more of the available energy to enter the system. That’s entirely different from saying that the variation itself is providing all the extra energy.
Although, there was absolutely no point in typing this because, by your logic, I’m afraid that you’ll never get to read it – all those transistors that will be switching large currents in response to small ones in order to transmit it from my keyboard to your screen simply can’t possibly work.
Hilarious
Louis says:
October 10, 2013 at 4:20 pm
How good are we at measuring total TSI?
VERY good: We can measure variations in TSI with a precision of 0.007 W/m2 out of 1361 W/m2 or as 10 feet on the distance between San Francisco and Los Angeles.
Do the measurements account for all wavelengths?
Yes, that is what the T in TSI stands for ‘Total Solar Irradiance’.
And, once again, we cannot forget (exclude) all of the “products” supplied by our Sun. TSI is only one in the basket.
As we all know that study solar/climate connections TSI is among the least important.
Joe says:
October 10, 2013 at 4:27 pm
Because the measurements are at different places. TSI is measured at the top of the atmosphere, the energy “entering” the climate system is (essentially) at the bottom of it.
The article says explicitly: “Thus the average amplitude of TSI reaching the earth surface in all wavelengths would be about 0.09 watt/m2″ so is at the ‘bottom’
Does TSI include the energy of the solar wind? What about coronal mass ejections?
geran says:
October 10, 2013 at 4:34 pm
And, once again, we cannot forget (exclude) all of the “products” supplied by our Sun. TSI is only one in the basket.
But is the one that has almost all the energy. So we still need to explain how 0.9 W/m2 can supply 0.33 W/m2.
As Svalgard suggests, some sort of amplification mechanism or some sort of coupled causation (ie- another factor that varies as TSI does, for example cosmic ray flux) is needed to obtain an additional twice as much energy imbalance.
But this is not much different from the CAGW proposition, whereby an hypothesized H2O feedback produces twice as much of an effect as the 1.2 degrees of warming that CO2 can be calculated to create per doubling of concentration. ie- not the 3, 4, or even 5 degrees that the IPCC deemed necessary to account for the late 20th century warming.
Leif does not give consideration to the potential secondary effects associated with changes in various solar parameters other then TSI.
For example the ap index versus surface temperatures give a strong correlation. The ACI/LOD index gives another strong correlation with temperature.
The ACI index in turn closely follows the activity of the sun, being more meridional during quiet periods ,and more zonal during active solar periods which has a big impact on the climate.
kent Blaker says:
October 10, 2013 at 4:36 pm
Does TSI include the energy of the solar wind? What about coronal mass ejections?
>>>>
TSI is total energy (E/M energy that can be easily converted to heat). Solar wind and CMEs are mass (particles) with high energy, but does not translate easily to heat (only collisions and nuclear transmutations).
Friends:
I think several people are missing the real issue here.
Leif Svaalgard is making the obvious point that TSI is an order of magnitude too small for it to have been the direct cause of the observed rise in global temperature. Hence, TSI is NOT the direct cause of that rise.
Others are saying that there may be mechanisms which amplify the direct effect of TSI and, of course, there may be. Hence, TSI may be the indirect cause of the observed rise in global temperature.
Both are right, but Leif Svaalgard has stated the clear and irrefutable evidence which demonstrates his point. The others have stated possibilities but they have not provided any evidence that demonstrates their point.
The onus is on those claiming a solar effect to demonstrate their claim. Attacking Leif Svaalgard’s point does not do that.
Please note that there are other possibilities for the cause(s) of the rise in global temperature. These possibilities include internal variation of the climate system such as variations in ocean heat transport causing redistribution of surface temperatures, and external variations such as the Svensmaark Effect which may alter cloud cover (n.b. this possible effect is galactic and not solar).
Hence, it is not sufficient to assert that the Sun is the cause. It is necessary to admit that nobody knows the true cause and to move on from there to assess each possibility on its merits.
Richard
The sun, the moon & the stars:
http://www.space.com/19786-cosmic-rays-origins-star-explosion.html
I didn’t know that the origin of GCRs was such a mystery, but a colleague of Dr. S’s at Stanford has solved it.
And let us not forget the planets & lesser bodies in orbit around the sun.
The terrestrial & extraterrestrial phenomena possibly or definitely affecting weather & climate to some extent haven’t all even been recognized yet, nor the relative importance of those which have been.
Nevertheless IPeCaC imagines its minions can realistically model the earth’s systems & make predictions (or projections) reliable enough for policy makers to base trillion-dollar decisions & risk the life, health & wealth of billions upon them. It would be to laugh were it not such a man-made catastrophe.
I’m reminded of the bootless War on Cancer waged in the 1970s before science knew very much at all about the disease(s). Arguably the greatest discovery in climatology in the shameless CO2-dominated sham paradigm period was the PDO, found accidentally in 1997 by a PNW fisheries researcher. Trillions of dollars wasted on worse than worthless “research” & the economy-destroying, deadly results of this anti-scientific fraud.
Whatever the faults of papers like Dr. Robertson’s may be, if any, at least it indicates that climate science might be waking up from its tax-funded binge since the 1980s. Alternative means of publishing scientific results or speculation such as this blog help revive real science, IMO, however out there some of the material posted here may be (often done so in order to subject it to ridicule, a point AW’s CACA critics often miss).
lsvalgaard says:
October 10, 2013 at 4:35 pm
Joe says:
October 10, 2013 at 4:27 pm
Because the measurements are at different places. TSI is measured at the top of the atmosphere, the energy “entering” the climate system is (essentially) at the bottom of it.
The article says explicitly: “Thus the average amplitude of TSI reaching the earth surface in all wavelengths would be about 0.09 watt/m2″ so is at the ‘bottom’
—————————————————————————————————————————–
That’s something I’d take issue with in the article. That figure is derived from TOA measurement using an implicit and unsupported (at least, within the article) assumption that the transmission efficiency remains constant as TSI varies.
That’s a massive assumption to be making in such a complex system, especially one where it’s so widely claimed that variations of a few hundreths of a percent in composition can have such profound effects on energy transmission.
Sauce for the goose & all that jazz 😉
Louis says:
October 10, 2013 at 4:20 pm
“How good are we at measuring total TSI? ”
Early satellites read absolute near 1367-8 and now it is accepted to be near 1361-2. Specs on these radiometers are (or were) available in user manuals on NASAs site with spec plates of 1% absolute accuracy with a much better repeatability. I have often wondered the same Louis. Let’s just say all of those readings that we have were adjusted to level the TSI (right or wrong). See TIM site at NASA I belive to show each satellite and what they were reporting.
Well how come CO2 is supposed to warm our planet, when it does not add even as much as 0.09wm/m2 to the budget
richardscourtney says:
October 10, 2013 at 4:48 pm
Rich, who made you the referee?
(Just funning, love your intelligent comments, just don’t get to “high and mighty” for us low-lifes.)
“””””…..@magicjava
If the heat is not originating from the sun, where is it coming from? The Earth’s core?……..”””””
We get NO HEAT from the sun’ there being no substantial physical medium connecting us together.
And even a type IIa diamond conduit between us would conduct a totally negligible amount of “heat”.
We make ALL of our heat, right here on earth by simply wasting the majority of the perfectly good Solar electromagnetic radiant energy that old Sol provides for our use.
We also get no LIGHT from the sun; ALL of that is made inside the human eye and brain, from a single octave sliver of the solar EM radiant energy spectrum.
Light is measured in “lumens” and “candelas” and such, which is quite different from the “Watts” and Joules etc that the sun sends us as EM radiation.
kent Blaker says:
October 10, 2013 at 4:36 pm
Does TSI include the energy of the solar wind? What about coronal mass ejections?
The energy in the solar wind is a million times smaller than TSI.
GlynnMhor says:
October 10, 2013 at 4:38 pm
cosmic ray flux) is needed to obtain an additional twice as much energy imbalance.
The energy of the cosmic rays is comparable to that of star light [from all the visible stars].
geran says:
October 10, 2013 at 4:47 pm
Solar wind and CMEs are mass (particles) with high energy, but does not translate easily to heat
They do. energy is energy. A piece of Radium is hot to hold in your hand [not to say dangerous].
george e. smith says:
October 10, 2013 at 4:57 pm
We get NO HEAT from the sun’ there
That explains why it takes so long to BBQ my steak. It gets no heat from the glowing coals…
geran says:
October 10, 2013 at 4:47 pm
Solar wind and CMEs are mass (particles) with high energy, but does not translate easily to heat
They do. energy is energy. A piece of Radium is hot to hold in your hand [not to say dangerous].
>>>>>
I think I dated her a few times back in college. Randy, Raney, Radium…something like that….
Since only about 160 watt/m of 1365 watt/m of incoming solar radiation at wavelengths less than 2
micron reaches the earth surface, the amplitude of short wavelength TSI reaching the earth surface would be only (160/1365)x0.6 = 0.07 watt/m .
A proper number would be 1000 w/m2 not 160. So 1000/1365 x .6 = .44 so more than enough.
My comment on all fuels burned daily worldwide and daily heat released. Mans heat release is a 24/7 operation into the air and waterways and does not stop and only slows when the economy does. Also mans world wide change of the landscape from water vapur emiting cooling forest to pavement and roof tops in and around growing cities worldwide.
I have never run the numbers on total Heat BTU’s released by man ever day from fuels and heat absorbing landscapes and what it would equal to in comparison to a volcano’s heat. There has to be someone with that info since I have made several attempts at searching for it.
I do know that most land surface temperature gauge sites are located near where most of mans heat energy is released.
So is mans daily heat release into the atmospher and waterways from all fuels really a factor on the atmosphere or just localized heat island effects.
Seems to me that Svenmarks cosmic ray theory fits in re cloud cover due solar activity sun. We all know that temperatures decrease with increased cloud cover in the tropics during the day. In any case lest we forget, there is no global warming All the datasets except CET and Satellite RSS data have been adjusted to show AGW. The whole conversation is pointless.