 (Perturbation Calculations of Ocean Surface Temperatures.)
Guest essay by Stan Robertson, Ph.D., P.E.
1. Introduction
It is generally conceded that the earth has warmed a bit over the last century, but it is not clear what has caused it, nor whether it will continue and become a problem for humanity. There is a possibility that some of the warming has been caused by anthropogenic greenhouse gases, but it is also likely that the sun has been partially responsible. The arguments that are advanced to say that humans caused it and that it will become a serious problem rely on models that have not been validated and positive feedback effects that have not been shown to exist, at least at the hypothesized levels of effectiveness. The apparent weakness in the argument that the sun has been a major contributor is that satellite measurements of Total Solar Irradiance (TSI) have not shown changes large enough to have directly produced the warming of the earth over the last half century. But what about indirect effects? Is it possible that the sun exerts control in some indirect way? In these notes I recapitulate the evidence that this is the case by showing that the variations of TSI cannot provide the energy that is necessary to account for the warming of the oceans during solar cycles.
TSI, as measured above the earth’s atmosphere varies by about 1.2 watt/m2 over a nominal eleven year solar cycle (h/t Leif Svaalgard) primarily at wavelengths shorter than 2 micron. The dominant harmonic variation of TSI would thus have an amplitude half this large, or about 0.6 watt/m2. About 70% of this enters the earth atmosphere. Averaged over latitudes and day/night cycles, about one fourth of this 70%, or ~0.11 watt/m2, on average, enters the upper atmosphere. Since only about 160 watt/m2 of 1365 watt/m2 of incoming solar radiation at wavelengths less than 2 micron reaches the earth surface, the amplitude of short wavelength TSI reaching the earth surface would be only (160/1365)x0.6 = 0.07 watt/m2. However, about half of the difference between 0.11 and 0.07 watt/m2 eventually reaches the earth surface as scattered thermal infrared radiation at wavelengths greater than 2 micron. Thus the average amplitude of TSI reaching the earth surface in all wavelengths would be about 0.09 watt/m2. So the question is, just how much sea surface temperature variation can this produce?
Several researchers, including Nir Shaviv (2008), Roy Spencer (see http://www.drroyspencer.com/2010/06/low-climate-sensitivity-estimated-from-the-11-year-cycle-in-total-solar-irradiance/) and Zhou & Tung (2010) have found that ocean surface temperatures oscillate with an amplitude of about 0.04 – 0.05 oC during a solar cycle. (In fact, all of the ideas that I am presenting here were covered in Shaviv’s work, but it has not gotten the attention that it deserves.) Using 150 years of sea surface temperature data, Zhou & Tung found 0.085 oC warming for each watt/m2 of increase of TSI over a solar cycle. Although not strictly sinusoidal, the temperature variations can be approximately described in terms of a dominant sinusoidal component of variation with an 11 year period. Thus the question to be answered at this point is, can 0.09 watt/m2 amplitude of variation of TSI entering the oceans produce temperature oscillations with an amplitude of 0.04 – 0.05 oC?
The answer to this question depends on the average thermal diffusivity of the upper oceans. That is an unknown, but not unknowable, quantity. Thermal diffusivity is the ratio of thermal conductivity to heat capacity. The upper 25 to 100 meters of oceans are well mixed by waves and shears. These are mixing zones with high thermal diffusivity and correspondingly small temperature gradients. Diffusivities are lower at greater depths. Bryan (1987) has found that thermal diffusivities ranging from 0.3 to 5 cm2/s are needed to account for the temperature profiles below the mixing zone. In my first trial calculations of the energy flux necessary to account for the temperature variations, I tried values of thermal diffusivity in the range 0.1 – 10 cm2/s and found that the TSI variations were generally inadequate to produce the sea temperature variations over a solar cycle. But there was wide variation of calculated energy flux. Larger values of thermal diffusivity required more heat because more was able to penetrate to the depths, but even for 0.1 cm2/s, the required input was double the TSI variations that reach the earth surface. Fortunately, there is a way to constrain both the value of the thermal diffusivity and the heat input. It consists of first matching the measured trends of surface temperatures and ocean heat content over time. Measurements of these were reported by Levitus et al. (2012) and are available from http://www.nodc.noaa.gov/OC5/3M_HEAT_CONTENT/ .
In the calculations described below, I have used the data from 1965 to 2012 for ocean depths to 700 meters. Sea surface temperatures and ocean heat content began to increase after 1965. Only about a third of the increase of heat content occurred at depths below 700 meter. Since little heat migrates below this depth over 11 year solar cycles, it is preferable to use the 0 – 700 m data for the purpose of calibrating the thermal diffusivity
2. Heat Transfer Perturbation Calculations
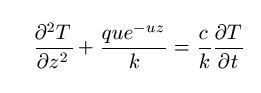
For the calculation of sea surface temperature and sea level changes, we can treat the variations of radiations entering and leaving atmosphere, lands and oceans as minor perturbations on an earth essentially in thermal equilibrium. Ocean mixing zones, thermoclines and other features of the temperature profiles remain largely as they were while small radiant disturbances produce minor variations of temperature starting from zero, and imposed at each depth. Thus the effects of these disturbances can be modeled as one-dimensional energy flows into a medium at uniform temperature. Such “perturbation calculations” are among the most powerful analysis techniques used by physicists and engineers and are widely used. The energy equation to be solved in this case is:
http://i1244.photobucket.com/albums/gg580/stanrobertson/equation_zpscea297ad.jpg

Where T is the temperature departure from equilibrium at depth , z, and time, t. q is a perturbing radiant flux entering the surface, u the absorption coefficient, c is absorber heat capacity and k its thermal conductivity. The rate of heat transfer by conduction processes is controlled by the thermal diffusivity, which is the ratio k/c.
As a one dimensional heat flow problem, it is straightforward undergraduate level physics or engineering to numerically solve the equation above for the expected changes of surface temperature as surface radiant flux varies. In my calculations, temperature changes were calculated for 1.0 meter increments of depth in the oceans. Two cases were considered. In one
case the surface radiation perturbation was assumed to increase linearly with time. This corresponds to the ocean conditions for the period 1965-2012. In the second case, it was assumed to vary as a cosine function of time with the 11 year period of the solar cycle. The cosine function provides both some positive and some negative variation in the first half cycle, which helps to minimize the transients of the first few years.
I treated q and thermal diffusivity, (k/c), as input parameters that were chosen to provide agreement with the observed sea surface temperature variations and ocean heat content measurements (https://www.ncdc.noaa.gov/ersst/ ). The absorption coefficient, u, was entered in piecewise fashion. Only the deep UV radiations penetrate to depths below 10 meter, but conduction takes energy to much greater depths. For the values of u chosen, only 44.5% of the surface energy flux goes deeper than 1 meter, 22.5% below 10 meter and 0.53% to 100 meter (h/t Leif Svalgaard). Thermal diffusivity of oceans was assumed to be 0.3 cm2/s below 300 m. This accords with Bryan’s estimates below the mixing zone, but little change of results occurred for values as low as 0.1 cm2/s. The required heat inputs are relativity insensitive to the thermal diffusivity below 300 meter. For the shallower depths, thermal diffusivity was varied until trends in accord with observed temperatures and heat content were produced.
It is necessary to maintain an energy balance at the sea surface in approximate equilibrium with the incoming solar radiation. As estimated by Trenberth, Fasullo and Kiehl (2009), about 160 watt/m2 enters the surface, on average. At a mean temperature of 288 oK, the sea surface will emit about 390 watt/m2 of surface thermal infrared radiation at wavelengths longer than about 2 micron, however, about 84% of that is returned as back scattered radiation. The rest of the energy balance is provided by evaporation and thermal convection, which remove about 59% of the heat from the surface. From the standpoint of merely wanting to know how much heat is required to change the ocean surface temperature, it is possible to maintain a proper energy balance without delving into the messy details of evaporation, convection and infrared absorption in the first few millimeters of water. The temperature variations at one meter depth will not be measurably different from those at the surface for the thermal diffusivities of interest here. If we merely want to know what net energy flux entering the surface is required to make the water temperature at one meter depth oscillate with an amplitude of 0.04 – 0.05 oC , then all we need to do is account for the outgoing surface infrared emission and let 41% (160 watt/m2 / 390 watt/m2 = 0.41) escape. At the present 288 oK, the earth radiates an additional 5.42 watt/m2 for each 1 oC increase of surface temperature. In the case of surface temperature being perturbed by 0.04 oC, an outgoing additional 0.22 watt/m2 would be generated and 0.09 watt/m2 was allowed to escape. This nicely balances the amplitude of TSI variations that reach the earth’s surface.
3. Linear heating:
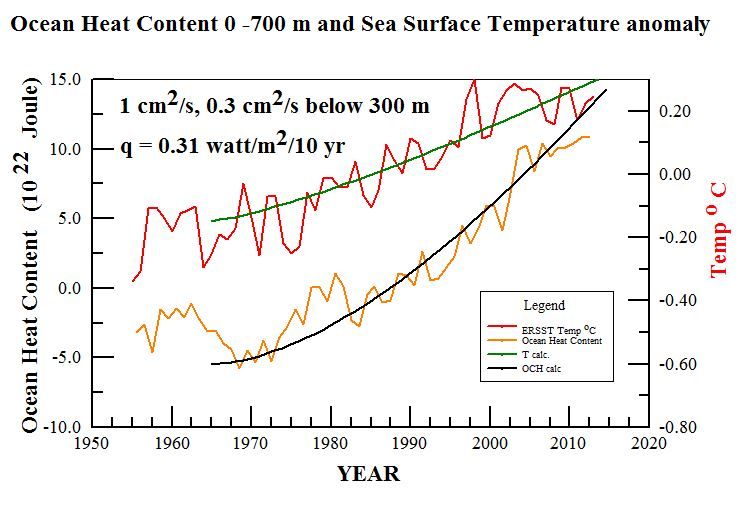
In these calculations, the aim was to find the heat input and thermal diffusivities necessary to account for the observed surface temperature increase (http://www.nodc.noaa.gov/OC5/3M_HEAT_CONTENT/ )Extended Reconstructed Sea Surface Temperature) and the increased ocean heat content (OHC 700) that have been reported by NOAA. Since surface temperatures had not been increasing in the early 1960s, but began to increase in the last half of that decade, I chose to start calculations with linearly increasing heating in 1965. I found that the ocean heat content to a depth of 700 meters was quite sensitive to the thermal diffusivity used. The best results that I have been able to obtain were for a thermal diffusivity of 1 cm2/s to 300 meter depth and surface heat input increasing at a rate of 0.31 watt/m2 per decade. These are shown on the graph below with calculated trends shown by the green and black lines. On a time scale of 50 years, most of the heat accumulates at relatively shallow depths. To better reflect a realistic thermal diffusivity for greater depths, I used a lower value of 0.3 cm2/s below 300 meter. That has little practical effect on a 50 year times scale, but would be necessary if one wanted to extend the calculations for several centuries while surface heating perturbations had time to penetrate to much greater depths.
http://i1244.photobucket.com/albums/gg580/stanrobertson/OHC700_zpsb9e34e91.jpg

Figure 1. Ocean heat content 0 – 700 meter and surface temperature trends according to NOAA. Blue and green lines show trends calculated for the parameters shown.
These calculations establish some parameters that do a good job of representing the thermal behavior of the upper oceans, however, if one looks closely at the data trends in the graph, it is apparent that both surface temperature and ocean heat content have considerably slowed their rates of increase in the last decade. This makes it unlikely that greenhouse gases are the cause of the rate of heating needed to explain the previous trends because their effects should have become enhanced rather than diminished. It might also be noted that a similar warming trend occurred in the first half of the previous century before anthropogenic greenhouse gases could have contributed significantly. Thus it is more likely that both warming periods had natural origins.
Obtaining simultaneous fits to the ocean heat content and sea surface temperature trends with only two free parameters, thermal diffusivity and surface heating rate, is quite confining. Acceptable, but noticeably worse, fits than shown above, were obtained with thermal diffusivities ranging from 0.8 to 1.2 cm2/s and heat inputs ranging from 0.29 to 0.33 watt/m2. Based on previous calculations for sea level data, I was initially inclined to think that larger thermal diffusivities would be necessary, but larger values let more heat penetrate to greater depths than the amounts of heat reported by Levitus et al. In addition, I was chagrined to learn that most of the variation of sea level that accompanies solar cycles is caused by evaporation rather than thermal expansion.
Solar Cycles:
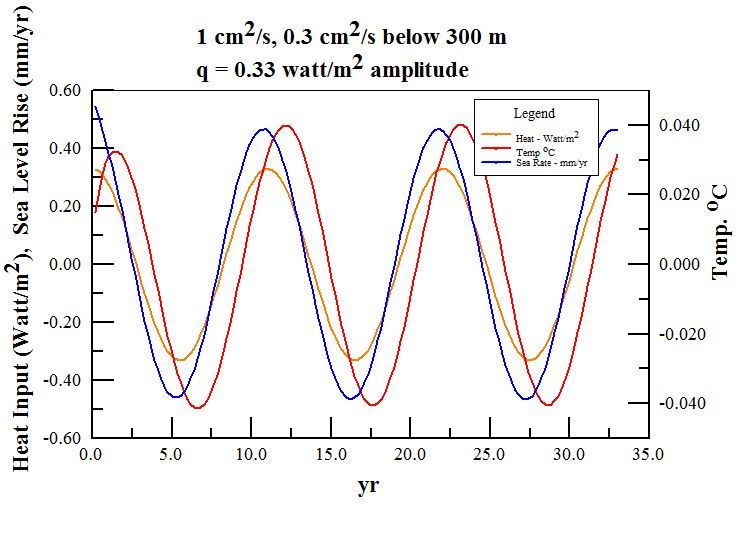
The process of choosing thermal diffusivity and surface heating rates to accord with observations provides a sound basis for calculating what to expect for the temperature variations during solar cycles. In this case we can use the thermal diffusivity of 1 cm2/s that is required of the ocean heat content results as an input parameter and choose the heat input that is required to produce temperature variations of 0.04 – 0.05 oC amplitude. Producing sea surface temperature variations with an amplitude of 0.04 oC requires a surface heat input of 0.33 watt/m2, as shown below:
http://i1244.photobucket.com/albums/gg580/stanrobertson/solarcycle10_zpsa3b8b0ee.jpg

Figure 2. Radiant flux, ocean temperature oscillations, and sea level variations for three solar cycles of eleven years each. The entering flux shown here is the value of q = 0.33 watt/m2 needed to drive the variations of surface temperature of 0.04 oC with ocean thermal diffusivity of 1.0 cm2/s to depth of 300 m. The amplitude of thermosteric rate of change of sea level was 0.47 mm/yr. Temperature lags the driving energy flux by 15 months. The thermal expansion coefficient of sea water used here was 2.4×10⁻⁴/ oC.
I believe that this settles the issue of what is required to produce sea surface temperature oscillations with an amplitude of 0.04 oC. The solar TSI variations that reach the earth’s surface are smaller than the 0.33 watt/m2 needed to account for sea surface temperature variations by a factor of 3.6 for this smallest estimate of sea surface temperature variability.
Although the estimated 0.33 watt/m2 that is required to explain the surface temperature variations is large compared to the amplitude of TSI variations that reach the surface, it is still only about two parts per thousand of the 160 watt/m2 of solar UV/VIS/NIR that reaches the earth surface. There are many possible ways in which the sun might modulate the surface energy flux to this extent. These include modulation of cloud cover and small spectral shifts in the energetic UV that might modulate ozone absorption or produce shifts of the effective sea surface albedo. It would seem to be a fairly direct radiative effect, rather than feedback, since it must vary in phase with the solar cycle.
In summary, my calculations based on energy conservation considerations imply that the sun modulates the ocean temperatures to a much greater extent than can be provided solely by its TSI variations. The great question that desperately needs an answer is how does it do it? It should be easily understood that solar effects would not necessarily be confined to cycles. More likely, the sun has been the driver of the large changes of temperatures of the Roman and Medieval warm period, the Little Ice Age, and the recent recovery from it without requiring large changes of its own irradiance. When we understand how the sun does this, we will have begun to understand the earthly climate.
###
Biographical note:
Stan Robertson, Ph.D, P.E, retired in 2004 after teaching physics at Southwestern Oklahoma State University for 14 years. In addition to teaching at three other universities over the years, he has maintained a consulting engineering practice for 30 years.
References:
Bryan, F., 1987: Parameter Sensitivity of Primitive Equation Ocean General Circulation Models. Journal of Physical Oceanography, 17, 970-985. (PDF available here http://journals.ametsoc.org/doi/abs/10.1175/1520-0485%281987%29017%3C0970%3APSOPEO%3E2.0.CO%3B2
Levitus, S. et al., 2012 World ocean heat content and thermosteric sea level change (0–2000 m), 1955–2010, Geophysical Research Letters, 39, L10603, doi:10.1029/2012GL051106, 2012 http://onlinelibrary.wiley.com/doi/10.1029/2012GL051106/abstract
Shaviv, Nir 2008, Using the oceans as a calorimeter to quantify the solar radiative forcing, Journal of Geophysical Research, 113, A11101 http://www.sciencebits.com/files/articles/CalorimeterFinal.pdf
Trenberth, K., Fasullo, J., Kiehl, J. 2009: Earth’s Global Energy Budget. Bull. Amer. Meteor. Soc., 90, 311–323. doi: http://dx.doi.org/10.1175/2008BAMS2634.1 www.cgd.ucar.edu/staff/trenbert/trenberth.papers/TFK_bams09.pdf , Fig. 1
Zhou, J. and Tung, K. ,2010 Solar Cycles in 150 Years of Global Sea Surface Temperature Data, Journal of Climate 23, 3234-3248 http://journals.ametsoc.org/doi/abs/10.1175/2010JCLI3232.1
So, you are saying the 2010 paper is faulty rather than the 2012 paper, or both?
The problem you have with it is the “deep excursions” to zero or negative? If so, that is irrelevant to discussion of the higher values, and once again, the data shows an increase of solar activity over the past ~500 years to some of the highest levels of the past 9000 years.
And your quote “agreement between solar forcing and Asian climate is good” is curious because of the restriction to Asian [and not global] climate
Obviously, the authors wrote that because they compared the solar record to an Asian speleothem climate proxy. Obviously, the authors cannot comment on global climate because they didn’t obtain multiple climate proxies from around the globe for comparison.
“Recent 10Be values are low; however, they do not indicate unusually high recent solar activity compared to the last 600 years”
Well, in fact figure 1 in that paper shows 10Be values at the end of the record are indeed low and at some of the lowest levels of the last 600 years, therefore the above statement is a non-sequitur or at least misleading.
It appears Dr. S. that you are the one doing the cherry-picking, neglecting to mention the more comprehensive 2012 paper, claiming the 2010 paper from those authors is the most recent until an update is published, citing a 2009 paper that only has data from one site instead of the 2012 paper, and contains a quote which contradicts the data published within the same paper, etc. etc.
milodonharlani says:
October 11, 2013 at 2:06 pm
lsvalgaard says:
October 11, 2013 at 12:50 pm
Thanks. That’s a good hypothesis. I’ve corresponded with Dr. Clark regarding Heinrich Events.
However it remains to be shown what might cause variability of the AMOC, which could be comparable to the oceanic drivers of Bond Cycles referred to above.
—————————————–
This paper from way back in 2004 shows ENSO associated with D-O cycles in the North Atlantic record. If teleconnections exist between Pacific circulation & the AMOC, that could help answer the question I posed about what drives or affects the latter in producing the results your cited paper found, ie the impact of the AMOC on sea & land ice:
http://www.nature.com/nature/journal/v428/n6980/abs/nature02386.html
The El Niño/Southern Oscillation (ENSO) phenomenon is believed to have operated continuously over the last glacial–interglacial cycle1. ENSO variability has been suggested to be linked to millennial-scale oscillations in North Atlantic climate during that time2, 3, but the proposals disagree on whether increased frequency of El Niño events, the warm phase of ENSO, was linked to North Atlantic warm or cold periods. Here we present a high-resolution record of surface moisture, based on the degree of peat humification and the ratio of sedges to grass, from northern Queensland, Australia, covering the past 45,000 yr. We observe millennial-scale dry periods, indicating periods of frequent El Niño events (summer precipitation declines in El Niño years in northeastern Australia). We find that these dry periods are correlated to the Dansgaard–Oeschger events—millennial-scale warm events in the North Atlantic climate record—although no direct atmospheric connection from the North Atlantic to our site can be invoked. Additionally, we find climatic cycles at a semiprecessional timescale (approx11,900 yr). We suggest that climate variations in the tropical Pacific Ocean on millennial as well as orbital timescales, which determined precipitation in northeastern Australia, also exerted an influence on North Atlantic climate through atmospheric and oceanic teleconnections.
Hockey Schtick says:
October 15, 2013 at 2:45 pm
So, you are saying the 2010 paper is faulty rather than the 2012 paper, or both?
I’m saying that the whole issue is under vigorous investigation at the moment and the preliminary conclusion is that solar activity in the 20th century was not the highest in the past 10,000 years. Activity in the 18th century was just as high, and in the 19th almost as high. And the cosmic ray record has many excursions just as high [actually ‘low’ because of the inverse correlation]. I grant that the cosmic ray people are thrashing around on this issue, but they are in the process of cleaning up their act.
But whether is were is irrelevant for the lack of correlation between the integral of solar activity and the temperature anomalies.
You misquote the paper. The statement is “Though generally the agreement between solar forcing and Asian climate is good, there are also periods without any coherence, pointing to other forcings like volcanoes and greenhouse gases and their corresponding feedbacks.” It seems you must agree with that as you take the paper as support for your ideas.
I did not misquote the paper by quoting the main point i.e. “generally the agreement between solar forcing and Asian climate is good,” which remains true even if there are a minority of periods without any coherence. Hand-waving explanations for the minority of periods without coherence are suggested, but have not been investigated by this paper and thus are mere speculation. They could have also added ocean & atmospheric oscillations to the list of possible explanations.
I’m saying that the whole issue is under vigorous investigation at the moment and the preliminary conclusion is that solar activity in the 20th century was not the highest in the past 10,000 years. Activity in the 18th century was just as high, and in the 19th almost as high.
Where is the data supporting this assertion [besides your own sunspot re-count]? The data in the 2009, 2010, 2012 papers cited above, as well as others, do not support your assertion that “Activity in the 18th century was just as high, and in the 19th almost as high.”
Hockey Schtick says:
October 15, 2013 at 3:28 pm
I did not misquote the paper by quoting the main point i.e. “generally the agreement between solar forcing and Asian climate is good,”
You left out the caveat “Although” that counts as a misquote in my book.
Where is the data supporting this assertion [besides your own sunspot re-count]? The data in the 2009, 2010, 2012 papers cited above, as well as others, do not
You did not take the trouble to read my link http://www.leif.org/research/Svalgaard_ISSI_Proposal_Base.pdf
If you had you might have seen Figure 2 that shows Steinhilber’s reconstructions [purple, green, black] compared to ours [red] and the some of the papers claiming the ‘biggest in 10,000 years’ thing [orange].
If you actually READ the link [and note the team members] you will see that the workshop was approved [and is now concluded]. The result is a revision of the cosmic ray data that resolves the discrepancy and removes the notion of the huge 20th century grand maximum [that never was]. Because this result is at variance with cherished ideas [including yours] it is only natural that there will be rear-guard action to preserve the old, obsolete, and faulty notions. You are in good company.
Is the adjusted data from the workshop available & do you have a chart showing the “integral” of the adjusted data?
Hockey Schtick says:
October 15, 2013 at 4:28 pm
Is the adjusted data from the workshop available & do you have a chart showing the “integral” of the adjusted data?
The data is still under embargo [sorry] until the final report is published [later this year, we hope], and I don’t have a chart. However, most of the changes are to recent data [the past 400 years], and will only have little impact. You can get a feeling for the data from Figure 23 of http://www.leif.org/research/Reflections-on-IDV.pdf there is still some issue with volcanic influence on the cosmic ray counts, but it is being worked on.
Thanks for providing Fig 23, engaging in this discussion, and I look forward to the publication of the paper & data.
However, it’s doubtful that your sunspot data or cosmic ray data would substantially change the correlation of the solar activity “integral” to the global temperature anomaly since the beginning of the record in 1850. [i.e. substantially different from the ~58% correlation in the link I posted above]
Further, some of your co-authors have already stated in the 2012 paper that there is “generally” a “good” correlation between solar activity and Asian climate over the past several millenia. Asian climate also shows a very good correlation to other climate proxies worldwide. I’m well aware you reject the notion that solar activity changes have any significant effect on climate, so perhaps you can hash that out with your co-authors on the new paper. Regards
Hockey Schtick says:
October 15, 2013 at 7:10 pm
I’m well aware you reject the notion that solar activity changes have any significant effect on climate
No, you have that a bit wrong. I don’t ‘reject’ or ‘dismiss’ anything, but I have not been convinced by the meager evidence and lack of plausible mechanism that the Sun is a major driver, even though I in the past was leaning towards a solar influence, e.g. http://www.sciencemag.org/content/180/4082/185.short
so perhaps you can hash that out with your co-authors on the new paper
Part of the resolution of the puzzle might be that the climate is [at least partially – some claim more than half] responsible for some of the long-term variations of the observed concentration of radionuclides, e.g. .http://arxiv.org/abs/1003.4989 and http://arxiv.org/abs/1004.2675
lsvalgaard says:
October 14, 2013 at 7:11 am
“if all the Sun is doing is 0.05C then the Sun is not a major driver of climate, which is really what this whole debate is about.”
doing 0.05C where? – they speak about antiphase forcing at “surface”.
I didn’t mean antiphase forcing, I mentioned it, but that’s misunderstanding that I somehow implied it as sole cause of the above 0.04-0.05C SST amplitude, what I was talking about was UV forcing, which is strongly in-phase. And anyway it would be just one small of more much larger contributors to deconstruct the above analysis top to bottom – the pert absolute omission of latent heat transfer, nonsensical radiative transfer figures – the 390W/m^2 for 288K – LoL – result of thinking perhaps the ocean is more than perfect laboratory blackbody, or it doesn’t matter if it isn’t, perpetuated by endemic groupthink dilettantism in climatology, or the 160W/m^2 irradiation of ocean of which more than half is under 30° latitude, one would wonder where the people get such stuff, but unfortunately the hausfigures are repeated everywhere and nobody bothers with reality check …and when I pointed out the nonsenses suddenly it is a “collection of facts” and nobody cares to put the 1+1 together…
But to the point: It seems that you confuse two quite different relations:
A.* The relation between the solar cycle signal (quasi-periodic, asymmetric) magnitude and the SST amplitude – an intermittent change in SST which in principle gets completely canceled* by the heat dissipation rate change caused by the changed SST – through radiative heat transfer and latent heat transfer, convection…
AND
B. The relation between the solar irradiation trend longer than one cycle and the surface heat content trend, which in principle is not canceled and lasts until the solar irradiation trend direction (upward or downward) lasts and in principle results in persistently rising SST trend so long until the solar irradiation trend direction (upward or downward) persists***.
——–
* more or less the relation of “0.09”W/m^2 (– which I think is grossly underestimated) and not more than 0.04-0.05C SST amplitude the above article is about
** if there’s no solar irradiation trend longer than the solar cycle – due to asymmetric nature of solar cycle signal a linear trend through one cycle is usually downward which leaves more time for the accumulated heat to dissipate.
*** it is not completely simple to tell exactly when the solar irradiation trend direction overturns, (PMOD guys for example claim it overturned 26years ago…so clearly it is not simple 😉 because it is periodically obscured by the solar cycle steep and asymmetric up and down periodicity.
But under the assumption the SSN closely relates to the solar activity and irradiation changes (that’s you who emphasizes the evolution of sunspots into faculae resulting in brightening) I’m able to tell it from the SSN monthly data with less than 1 year exactness and tell you the likely chief and definitely significant cause why there was the recent warming since the 1970s and also why it is not there anymore since beginning of 2000’s – the whole story is more or less told by this graph
(Because you emphasize, there is the needed correction of the SIDC-SSN data before 1947 and although it has nothing to do with the recent warming, I made unanimated though, but using corrected SSN data version of my “wiggle” graph – which uses original, uncorrected SIDC-SSN data). What I changed was, that I didn’t use the tail value of the trends, which are meaningless, but their center value – which is not completely surprisingly equivalent of SSN integral development in time normalized to the data average and scale. The result is just approximation and maybe even a bit underestimated, because the OLS method is not perfect. The step is half of the solar cycle, resulting values exactly centered to cycle minima and maxima – which are the ends of the particular regressions.
– you can see on both (one derived by 75+ years regressions from monthly data!), that the solar activity trend clearly rose significantly since quite exactly the mid-1970’s – and well into the 2000’s
– to confirm it there is the yellow line – the simple 1964.8-2006.13 linear trend (I’ve chosen for sake of demonstration – because it is almost 42 years long and quite telling) is almost perfectly flat – which means the end of the trend-line is the point where the SSN trend since the 1964 solar minimum overturned and it was not sooner than in February 2006! Mind that the line also – at the same time marks the average SSN in the period 1964.8-2006.13 and compare it to the light blue thin line – marking the 1890-2013 SSN average – which is another confirmation. -one simple yellow line with one blue and both prima facie falsify Lockwood&Fröhlich07…
-To help see the relation I plotted the average line (the light blue) of the whole period – average SSN 1890.22-2013.72 and 1964.8-2013.72 are surprisingly both 61.92 – which is nothing I planned or somehow arranged – it just came out by itself and it means the 1890.22-2013.72 SSN trend is also flat – at least with the corrected SSN data using your suggestions.
– In my opinion the change of absolute heat content (which directly and only determines the temperatures) in the whole climatic system from bottom of the ocean mixed zone to top of the atmosphere during a period is determined not by TSI itself, but by surplus TSI integral over average for same period and the signal decay rate say in ocean would be likely related to the length of the rising trend (and although the above article suggest quite fast heat diffusion in ocean, the heat can’t disappear, nor traverse the thermocline in most of the ocean, simply because basic physics doesn§t allow anything like that, so sooner or later it intervenes), also the relation between heat content and temperature is not completely trivial because one must calculate it using absolute temperature – which is not the case of the surface temperature anomalies – so just the simple correlation of SST with TSI in principle never can work well – although it still works better than attempts to correlate the SST with the atmospheric CO2 content..
I don’t have empirical TSI for whole the period, so I tested the method with SSN. It looks like it works fine. Used data and calculations are of course available and suggestions welcome.
lsvalgaard says:
October 14, 2013 at 7:11 am
“if all the Sun is doing is 0.05C then the Sun is not a major driver of climate, which is really what this whole debate is about.”
doing 0.05C where? – they speak about antiphase forcing at “surface”.
I didn’t mean antiphase forcing, I mentioned it, but that’s misunderstanding that I somehow implied it as sole cause of the above 0.04-0.05C SST amplitude, what I was talking about was UV forcing, which is strongly in-phase. And anyway it would be just one small of more much larger contributors to deconstruct the above analysis – the pert absolute omission of latent heat transfer, weird radiative transfer figures – the 390W/m^2 for 288K – LoL – result of thinking perhaps the ocean is more than perfect laboratory blackbody, or it doesn’t matter if it isn’t, perpetuated by endemic groupthink dilettantism in climatology, or the 160W/m^2 irradiation of ocean of which more than half is under 30° latitude, one would wonder where the people get such stuff, but unfortunately the hausfigures are repeated everywhere and nobody bothers with reality check …and when I pointed out the nonsenses suddenly it is a “collection of facts” and nobody cares to put the 1+1 together…
But to the point: It seems that you confuse two quite different relations:
A.* The relation between the solar cycle signal (quasi-periodic, asymmetric) magnitude and the SST amplitude – an intermittent change in SST which in principle gets completely canceled* by the heat dissipation rate change caused by the changed SST – through radiative heat transfer and latent heat transfer, convection…
AND
B. The relation between the solar irradiation trend longer than one cycle and the surface heat content trend, which in principle is not canceled and lasts until the solar irradiation trend direction (upward or downward) lasts and in principle results in persistently rising SST trend so long until the solar irradiation trend direction (upward or downward) persists***.
——–
* more or less the relation of “0.09”W/m^2 (– which I think is grossly underestimated) and not more than 0.04-0.05C SST amplitude the above article is about
** if there’s no solar irradiation trend longer than the solar cycle – due to asymmetric nature of solar cycle signal a linear trend through one cycle is usually downward which leaves more time for the accumulated heat to dissipate.
*** it is not completely simple to tell exactly when the solar irradiation trend direction overturns, (PMOD guys for example claim it overturned 26years ago…so clearly it is not simple 😉 because it is periodically obscured by the solar cycle steep and asymmetric up and down periodicity.
But under the assumption the SSN closely relates to the solar activity and irradiation changes (that’s you who emphasizes the evolution of sunspots into faculae resulting in brightening) I’m able to tell it from the SSN monthly data with less than 1 year exactness and tell you the likely chief and definitely significant cause why there was the recent warming since the 1970s and also why it is not there anymore since beginning of 2000’s – the whole story is more or less told by this graph
(Because you emphasize, there is the needed correction of the SIDC-SSN data before 1947 and although it has nothing to do with the recent warming, I made unanimated though, but using corrected SSN data version of my “wiggle” graph – which uses original, uncorrected SIDC-SSN data). What I changed was, that I didn’t use the tail value of the trends, which are meaningless, but their center value – which is not completely surprisingly equivalent of SSN integral development in time normalized to the data average and scale. The result is just approximation and maybe even a bit underestimated, because the OLS method is not perfect. The step is half of the solar cycle, resulting values exactly centered to cycle minima and maxima – which are the ends of the particular regressions.
– you can see on both (one derived by 75+ years regressions from monthly data!), that the solar activity trend clearly rose significantly since quite exactly the mid-1970’s – and well into the 2000’s
– to confirm it there is the yellow line – the simple 1964.8-2006.13 linear trend (I’ve chosen for sake of demonstration – because it is almost 42 years long and quite telling) is almost perfectly flat – which means the end of the trend-line is the point where the SSN trend since the 1964 solar minimum overturned and it was not sooner than in February 2006! Mind that the line also – at the same time marks the average SSN in the period 1964.8-2006.13 and compare it to the light blue thin line – marking the 1890-2013 SSN average – which is another confirmation. -one simple yellow line with one blue and both prima facie falsify Lockwood&Fröhlich07…
-To help see the relation I plotted the average line (the light blue) of the whole period – average SSN 1890.22-2013.72 and 1964.8-2013.72 are surprisingly both 61.92 – which is nothing I planned or somehow arranged – it just came out by itself and it means the 1890.22-2013.72 SSN trend is also flat – at least with the corrected SSN data using your suggestions.
– In my opinion the change of absolute heat content (which directly and only determines the temperatures) in the whole climatic system from bottom of the ocean mixed zone to top of the atmosphere during a period is determined not by TSI itself, but by surplus TSI integral over average for same period and the signal decay rate say in ocean would be likely related to the length of the rising trend (and although the above article suggest quite fast heat diffusion in ocean, the heat can’t disappear, nor traverse the thermocline in most of the ocean, simply because basic physics doesn§t allow anything like that, so sooner or later it intervenes), also the relation between heat content and temperature is not completely trivial because one must calculate it using absolute temperature – which is not the case of the surface temperature anomalies – so just the simple correlation of SST with TSI in principle never can work well – although it still works better than attempts to correlate the SST with the atmospheric CO2 content..
I don’t have empirical TSI for whole the period, so I tested the method with SSN. It looks like it works fine. Used data and calculations are of course available and suggestions welcome.
tumetuestumefaisdubien1 says:
October 15, 2013 at 9:55 pm
I didn’t mean antiphase forcing, I mentioned it, but that’s misunderstanding that I somehow implied it as sole cause of the above 0.04-0.05C SST amplitude, what I was talking about was UV forcing, which is strongly in-phase.
There is a suggestion [by Jerry Harder] that the SSI measured by SORCE shows that UV and Visible varies in anti-phase, so when UV goes up, Visible goes down by the same amount such as to keep TSI almost constant, see Slide 11 of http://lasp.colorado.edu/sorce/news/2011ScienceMeeting/docs/presentations/6b_Cahalan_Sedona_9-15-2011.pdf
Either with or without that assumption, the solar influence on temperatures at the surface and the sea temperatures at several depths are of the order of 0.05C.
But to the point: It seems that you confuse two quite different relations:
A.* The relation between the solar cycle signal (quasi-periodic, asymmetric) magnitude and the SST amplitude …
B. The relation between the solar irradiation trend longer than one cycle and the surface heat content trend,…
As there has been no upward trend in solar activity the last 300 years it would seen that only A comes into play.
lsvalgaard says:
October 16, 2013 at 3:55 am
As there has been no upward trend in solar activity [and neither in UV] the last 300 years it would seen that only A comes into play.
I forgot to link to the evidence for that. Here it is:
http://www.leif.org/research/The%20long-term%20variation%20of%20solar%20activity.pdf
Especially slides 31 and 37.
lsvalgaard says:
October 16, 2013 at 3:55 am
There is a suggestion [by Jerry Harder] that the SSI measured by SORCE shows that UV and Visible varies in anti-phase, so when UV goes up, Visible goes down by the same amount such as to keep TSI almost constant
Yeah, I know.
There’s just the little petty problem for the above analysis, that Ermolli et al question reliability of the antiphase effect in visible and anyway it doesn’t even much matter whether they’re right or not – the >5 mW/nm variability in UVA, which would put together nice >0.425W/m^2 variability, which – although maybe ofsetted by the 1+ micrometer IR in TOA TSI, would not look so well after passing atmosphere, after which still will persist at least third of the 0.425 figure, 95+% from it get into the ocean, to orders of magnitude higher depths than the >1micrometer IR, or more exactly what left from it, and mix up not only the surface layer, but also the Robertson’s diffusivity figures and in any case the 0.09W/m^2 figure – already quite untenable due to absolute omission of the ocean geographic stratification and reflectivity making the 160W/m^2 figure untenable straight away.
So yes, you’re maybe right with the antiphase offseting of TSI, and surely I didn’t claimed anything else, but it somehow doesn’t help the above article about SST amplitude dependence on the solar cycle magnitude enough.
Concerning the seeming only A comes to play even stated in direct context of the claim “there has been no upward trend in solar activity the last 300 years” I must say that despite I’m not much a fan of modern grand maximum thesis and I never use the SSN data without the correction you suggested to me, I don’t even see there any data for 300 years on the slide 31 and the slide 37 the graph beggins 1750.
And anyway contrary to what you claim what I see at the graph there is SSN ~+4.5/per century trend throughout the whole 1750-2000 period, at least +15/century for 1800-2000 and at least +35 for 1900-2000 and what I remember about the SSN data before 1750 the 300 years 1700-2000 trend would be >5/century and even considerably higher it would be if going before 1700. And in any case I also don’t remember nothing to the sense there would be only one solar cycle since 1713. Of course my eyes and memory can deceive me, but anyway I have strong feeling that they don’t and that this your 300 years no secular trend(s) claim in context of the implicite seeming/claim that B doesn’t come to play is so far the most ridiculous take I’ve heard from you. Are you OK? I’m bit worried.
ok, I maybe overstated it, sometimes I use the SIDC-SSN data without correction at the WFT if I just need quick check and it is about short period in 2nd half of 20th century, but I always bear in mind that the data need correction and because it is nonpractical to correct the data after 1947, so I do before.
tumetuestumefaisdubien1 says:
October 16, 2013 at 10:45 am
and at least +35 for 1900-2000
And at least +180 for 1954-1958…
Allan MacRae says: October 12, 2013 at 11:25 am
I suggest cooling COULD be similar to the Dalton Minimum, which coincided with an average 1 degree C decline in global average temperature and caused significant human suffering.
BUT the Dalton also included the Tambora eruption in 1815, one of the largest volcanoes in the past 2000 years. The year 1816 was called The Year Without a Summer.
lsvalgaard says: October 12, 2013 at 11:33 am
Helped along with the eruption of Mayon in 1814 and another [unnamed] volcano erupting in 1809.
Obviously, I don’t predict a 1C decline [barring similar volcanic eruptions]
Allan says:
OK Leif – that`s why I mentioned Tambora. let’s find some common ground here – we both agree on LESS than 1C of cooling :–}
[Actually, you say no significant temperature change]
But Napoleon’s’ Grande Armée froze to and from Moscow in 1812 – clearly the French had a remarkable and prescient sensitivity to future global cooling events – or was it that un-named 1809 volcano thingy?
By the way, Tambora blew its stack on 10 April 1815, just two months before Napoleon lost for the last time at Waterloo on 18 June 1815. Coincidence? I think NOT!! :–}
____________________
Royal Highness,
Exposed to the factions which divide my country, and to the enmity of the great Powers of Europe, I have terminated my political career; and I come, like Themistocles, to throw myself upon the hospitality (m’asseoir sur le foyer) of the British people. I claim from your Royal Highness the protections of the laws, and throw myself upon the most powerful, the most constant, and the most generous of my enemies.
—Napoleon (letter of surrender to the Prince Regent – translation)
Allan MacRae says:
October 17, 2013 at 8:58 am
I suggest cooling COULD be similar to the Dalton Minimum
And I COULD win the lottery tomorrow.
COULD is not a valid prediction.
But Napoleon’s’ Grande Armée froze to and from Moscow in 1812
And Hitler has similar trouble in 1942. Russian winters can be harsh. But clearly the Russians didn’t die from the cold. It is all a question about proper preparation and logistics, not the weather. And I think the ‘to’ is not correct.
By the way, Tambora blew its stack on 10 April 1815, just two months before Napoleon lost for the last time at Waterloo on 18 June 1815. Coincidence? I think NOT!! :–}
We have different bars on what constitutes coincidence. Yours may be set too low.
Joke Leif!
Joke!
Smile – your face will not break.
:-}
Allan MacRae says:
October 17, 2013 at 10:00 am
Joke!
Many comments on WUWT are such that it is hard to tell the difference…
Better not to act as a comedian and stick to science.
Lighten up my friend, you are a barrel of Leifs! :-}
Re your crusty comment “Better not to act as a comedian and stick to science”:
We’ve already sorted out much of the science; just waiting for the rest of you to catch up. Bada-boom!! :-}
2002
[PEGG, reprinted at their request by several other professional journals , the Globe and Mail and la Presse in translation]
http://www.apegga.org/Members/Publications/peggs/WEB11_02/kyoto_pt.htm
On global warming:
“Climate science does not support the theory of catastrophic human-made global warming – the alleged warming crisis does not exist.”
On green energy:
“The ultimate agenda of pro-Kyoto advocates is to eliminate fossil fuels, but this would result in a catastrophic shortfall in global energy supply – the wasteful, inefficient energy solutions proposed by Kyoto advocates simply cannot replace fossil fuels.”
2002
[Calgary Herald, September 1, 2002, based on a phone conversation with Paleoclimatologist Dr. Tim Patterson]
On global cooling:
“If (as I believe) solar activity is the main driver of surface temperature rather than CO2, we should begin the next cooling period by 2020 to 2030.”
2008
http://icecap.us/index.php/go/joes-blog/carbon_dioxide_in_not_the_primary_cause_of_global_warming_the_future_can_no/
On falsifying the CAGW hypothesis:
The rate of change dCO2/dt varies ~contemporaneously with temperature.
Atmospheric CO2 lags temperature at all measured time scales. CO2 does not drive temperature; temperature drives CO2.
**********
Enjoy your weekend Leif.
Best personal regards, Allan
On the ECS Mainstream Debate
http://wattsupwiththat.com/2013/10/10/the-sun-does-it-now-go-figure-out-how/#comment-1445683
[excerpt]
“Since CO2 clearly LAGS temperature at all measured time scales, this ECS mainstream debate requires that, in total, “the future is causing the past”, which I suggest is demonstrably false…
… In summary, in climate science we do not even agree on what drives what, and it is probable that the majority, who reside on BOTH sides of the ECS mainstream debate, are BOTH WRONG.”
Regards to all, Allan
Epilogue
And all our yesterdays have lighted fools
The way to dusty death. Out, out, brief candle!
Life’s but a walking shadow, a poor player
That struts and frets his hour upon the stage
And then is heard no more. It is a tale
Told by an idiot, full of sound and fury,
Signifying nothing.
Nir Shaviv says:
October 14, 2013 at 2:44 pm
. . .“The author of the article heading this thread, claims 0.33 W/m2.”
If one neglects the mixing layer, one will underestimate the amount of heat that goes into the ocean and with it the forcing.
—————————————–
I do not believe that the neglect of the mixing layer is a problem because the ocean heat content calculation constrained the diffusivity. There are three ways our results differ. One, that regrettably confused some, seems to be that my 0.33 w/m^2 was an amplitude, not a peak to trough variation. A second is that for the purpose of a blog article, I obviously did not take the care that you did. Third, I produced a deliberate minimal estimate by not going into detail about the roles of evaporation, convection and downwelling thermal infrared at the surface. That is the main difference between our results. Evaporation and convection remove heat and thus it will require more than my estimate to produce the observed temperature variations, however, this is also partially compensated by using the same approximation on the ocean heat content data. I was hoping that a clean minimal estimate that was much larger than TSI variations that reach the surface would persuade Leif to take a hard look at calorimetry. Doesn’t seem to have worked.
Stan
bones says:
October 21, 2013 at 3:16 pm
I was hoping that a clean minimal estimate that was much larger than TSI variations that reach the surface would persuade Leif to take a hard look at calorimetry. Doesn’t seem to have worked.It was hard cutting though to the beef. My take-home-message was that you were trying to explain a 0.05 C solar-cycle variation of the Sea Surface Temperature. IMHO the variation of TSI is sufficient for that.
Glad to know that it is an opinion and not based on anything as well established as calorimetry.