 (Perturbation Calculations of Ocean Surface Temperatures.)
Guest essay by Stan Robertson, Ph.D., P.E.
1. Introduction
It is generally conceded that the earth has warmed a bit over the last century, but it is not clear what has caused it, nor whether it will continue and become a problem for humanity. There is a possibility that some of the warming has been caused by anthropogenic greenhouse gases, but it is also likely that the sun has been partially responsible. The arguments that are advanced to say that humans caused it and that it will become a serious problem rely on models that have not been validated and positive feedback effects that have not been shown to exist, at least at the hypothesized levels of effectiveness. The apparent weakness in the argument that the sun has been a major contributor is that satellite measurements of Total Solar Irradiance (TSI) have not shown changes large enough to have directly produced the warming of the earth over the last half century. But what about indirect effects? Is it possible that the sun exerts control in some indirect way? In these notes I recapitulate the evidence that this is the case by showing that the variations of TSI cannot provide the energy that is necessary to account for the warming of the oceans during solar cycles.
TSI, as measured above the earth’s atmosphere varies by about 1.2 watt/m2 over a nominal eleven year solar cycle (h/t Leif Svaalgard) primarily at wavelengths shorter than 2 micron. The dominant harmonic variation of TSI would thus have an amplitude half this large, or about 0.6 watt/m2. About 70% of this enters the earth atmosphere. Averaged over latitudes and day/night cycles, about one fourth of this 70%, or ~0.11 watt/m2, on average, enters the upper atmosphere. Since only about 160 watt/m2 of 1365 watt/m2 of incoming solar radiation at wavelengths less than 2 micron reaches the earth surface, the amplitude of short wavelength TSI reaching the earth surface would be only (160/1365)x0.6 = 0.07 watt/m2. However, about half of the difference between 0.11 and 0.07 watt/m2 eventually reaches the earth surface as scattered thermal infrared radiation at wavelengths greater than 2 micron. Thus the average amplitude of TSI reaching the earth surface in all wavelengths would be about 0.09 watt/m2. So the question is, just how much sea surface temperature variation can this produce?
Several researchers, including Nir Shaviv (2008), Roy Spencer (see http://www.drroyspencer.com/2010/06/low-climate-sensitivity-estimated-from-the-11-year-cycle-in-total-solar-irradiance/) and Zhou & Tung (2010) have found that ocean surface temperatures oscillate with an amplitude of about 0.04 – 0.05 oC during a solar cycle. (In fact, all of the ideas that I am presenting here were covered in Shaviv’s work, but it has not gotten the attention that it deserves.) Using 150 years of sea surface temperature data, Zhou & Tung found 0.085 oC warming for each watt/m2 of increase of TSI over a solar cycle. Although not strictly sinusoidal, the temperature variations can be approximately described in terms of a dominant sinusoidal component of variation with an 11 year period. Thus the question to be answered at this point is, can 0.09 watt/m2 amplitude of variation of TSI entering the oceans produce temperature oscillations with an amplitude of 0.04 – 0.05 oC?
The answer to this question depends on the average thermal diffusivity of the upper oceans. That is an unknown, but not unknowable, quantity. Thermal diffusivity is the ratio of thermal conductivity to heat capacity. The upper 25 to 100 meters of oceans are well mixed by waves and shears. These are mixing zones with high thermal diffusivity and correspondingly small temperature gradients. Diffusivities are lower at greater depths. Bryan (1987) has found that thermal diffusivities ranging from 0.3 to 5 cm2/s are needed to account for the temperature profiles below the mixing zone. In my first trial calculations of the energy flux necessary to account for the temperature variations, I tried values of thermal diffusivity in the range 0.1 – 10 cm2/s and found that the TSI variations were generally inadequate to produce the sea temperature variations over a solar cycle. But there was wide variation of calculated energy flux. Larger values of thermal diffusivity required more heat because more was able to penetrate to the depths, but even for 0.1 cm2/s, the required input was double the TSI variations that reach the earth surface. Fortunately, there is a way to constrain both the value of the thermal diffusivity and the heat input. It consists of first matching the measured trends of surface temperatures and ocean heat content over time. Measurements of these were reported by Levitus et al. (2012) and are available from http://www.nodc.noaa.gov/OC5/3M_HEAT_CONTENT/ .
In the calculations described below, I have used the data from 1965 to 2012 for ocean depths to 700 meters. Sea surface temperatures and ocean heat content began to increase after 1965. Only about a third of the increase of heat content occurred at depths below 700 meter. Since little heat migrates below this depth over 11 year solar cycles, it is preferable to use the 0 – 700 m data for the purpose of calibrating the thermal diffusivity
2. Heat Transfer Perturbation Calculations
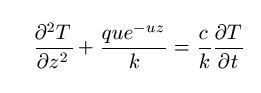
For the calculation of sea surface temperature and sea level changes, we can treat the variations of radiations entering and leaving atmosphere, lands and oceans as minor perturbations on an earth essentially in thermal equilibrium. Ocean mixing zones, thermoclines and other features of the temperature profiles remain largely as they were while small radiant disturbances produce minor variations of temperature starting from zero, and imposed at each depth. Thus the effects of these disturbances can be modeled as one-dimensional energy flows into a medium at uniform temperature. Such “perturbation calculations” are among the most powerful analysis techniques used by physicists and engineers and are widely used. The energy equation to be solved in this case is:
http://i1244.photobucket.com/albums/gg580/stanrobertson/equation_zpscea297ad.jpg

Where T is the temperature departure from equilibrium at depth , z, and time, t. q is a perturbing radiant flux entering the surface, u the absorption coefficient, c is absorber heat capacity and k its thermal conductivity. The rate of heat transfer by conduction processes is controlled by the thermal diffusivity, which is the ratio k/c.
As a one dimensional heat flow problem, it is straightforward undergraduate level physics or engineering to numerically solve the equation above for the expected changes of surface temperature as surface radiant flux varies. In my calculations, temperature changes were calculated for 1.0 meter increments of depth in the oceans. Two cases were considered. In one
case the surface radiation perturbation was assumed to increase linearly with time. This corresponds to the ocean conditions for the period 1965-2012. In the second case, it was assumed to vary as a cosine function of time with the 11 year period of the solar cycle. The cosine function provides both some positive and some negative variation in the first half cycle, which helps to minimize the transients of the first few years.
I treated q and thermal diffusivity, (k/c), as input parameters that were chosen to provide agreement with the observed sea surface temperature variations and ocean heat content measurements (https://www.ncdc.noaa.gov/ersst/ ). The absorption coefficient, u, was entered in piecewise fashion. Only the deep UV radiations penetrate to depths below 10 meter, but conduction takes energy to much greater depths. For the values of u chosen, only 44.5% of the surface energy flux goes deeper than 1 meter, 22.5% below 10 meter and 0.53% to 100 meter (h/t Leif Svalgaard). Thermal diffusivity of oceans was assumed to be 0.3 cm2/s below 300 m. This accords with Bryan’s estimates below the mixing zone, but little change of results occurred for values as low as 0.1 cm2/s. The required heat inputs are relativity insensitive to the thermal diffusivity below 300 meter. For the shallower depths, thermal diffusivity was varied until trends in accord with observed temperatures and heat content were produced.
It is necessary to maintain an energy balance at the sea surface in approximate equilibrium with the incoming solar radiation. As estimated by Trenberth, Fasullo and Kiehl (2009), about 160 watt/m2 enters the surface, on average. At a mean temperature of 288 oK, the sea surface will emit about 390 watt/m2 of surface thermal infrared radiation at wavelengths longer than about 2 micron, however, about 84% of that is returned as back scattered radiation. The rest of the energy balance is provided by evaporation and thermal convection, which remove about 59% of the heat from the surface. From the standpoint of merely wanting to know how much heat is required to change the ocean surface temperature, it is possible to maintain a proper energy balance without delving into the messy details of evaporation, convection and infrared absorption in the first few millimeters of water. The temperature variations at one meter depth will not be measurably different from those at the surface for the thermal diffusivities of interest here. If we merely want to know what net energy flux entering the surface is required to make the water temperature at one meter depth oscillate with an amplitude of 0.04 – 0.05 oC , then all we need to do is account for the outgoing surface infrared emission and let 41% (160 watt/m2 / 390 watt/m2 = 0.41) escape. At the present 288 oK, the earth radiates an additional 5.42 watt/m2 for each 1 oC increase of surface temperature. In the case of surface temperature being perturbed by 0.04 oC, an outgoing additional 0.22 watt/m2 would be generated and 0.09 watt/m2 was allowed to escape. This nicely balances the amplitude of TSI variations that reach the earth’s surface.
3. Linear heating:
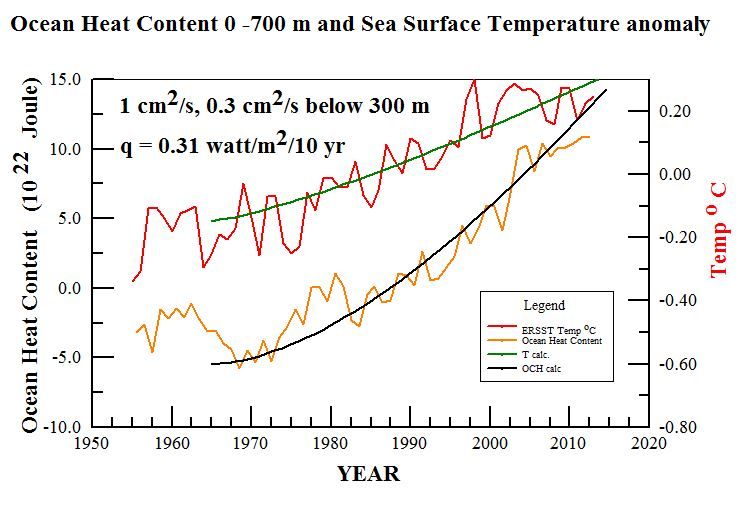
In these calculations, the aim was to find the heat input and thermal diffusivities necessary to account for the observed surface temperature increase (http://www.nodc.noaa.gov/OC5/3M_HEAT_CONTENT/ )Extended Reconstructed Sea Surface Temperature) and the increased ocean heat content (OHC 700) that have been reported by NOAA. Since surface temperatures had not been increasing in the early 1960s, but began to increase in the last half of that decade, I chose to start calculations with linearly increasing heating in 1965. I found that the ocean heat content to a depth of 700 meters was quite sensitive to the thermal diffusivity used. The best results that I have been able to obtain were for a thermal diffusivity of 1 cm2/s to 300 meter depth and surface heat input increasing at a rate of 0.31 watt/m2 per decade. These are shown on the graph below with calculated trends shown by the green and black lines. On a time scale of 50 years, most of the heat accumulates at relatively shallow depths. To better reflect a realistic thermal diffusivity for greater depths, I used a lower value of 0.3 cm2/s below 300 meter. That has little practical effect on a 50 year times scale, but would be necessary if one wanted to extend the calculations for several centuries while surface heating perturbations had time to penetrate to much greater depths.
http://i1244.photobucket.com/albums/gg580/stanrobertson/OHC700_zpsb9e34e91.jpg

Figure 1. Ocean heat content 0 – 700 meter and surface temperature trends according to NOAA. Blue and green lines show trends calculated for the parameters shown.
These calculations establish some parameters that do a good job of representing the thermal behavior of the upper oceans, however, if one looks closely at the data trends in the graph, it is apparent that both surface temperature and ocean heat content have considerably slowed their rates of increase in the last decade. This makes it unlikely that greenhouse gases are the cause of the rate of heating needed to explain the previous trends because their effects should have become enhanced rather than diminished. It might also be noted that a similar warming trend occurred in the first half of the previous century before anthropogenic greenhouse gases could have contributed significantly. Thus it is more likely that both warming periods had natural origins.
Obtaining simultaneous fits to the ocean heat content and sea surface temperature trends with only two free parameters, thermal diffusivity and surface heating rate, is quite confining. Acceptable, but noticeably worse, fits than shown above, were obtained with thermal diffusivities ranging from 0.8 to 1.2 cm2/s and heat inputs ranging from 0.29 to 0.33 watt/m2. Based on previous calculations for sea level data, I was initially inclined to think that larger thermal diffusivities would be necessary, but larger values let more heat penetrate to greater depths than the amounts of heat reported by Levitus et al. In addition, I was chagrined to learn that most of the variation of sea level that accompanies solar cycles is caused by evaporation rather than thermal expansion.
Solar Cycles:
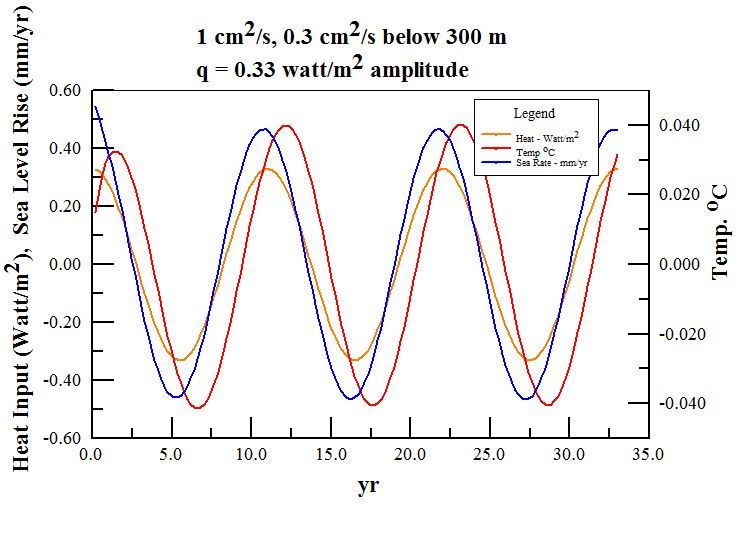
The process of choosing thermal diffusivity and surface heating rates to accord with observations provides a sound basis for calculating what to expect for the temperature variations during solar cycles. In this case we can use the thermal diffusivity of 1 cm2/s that is required of the ocean heat content results as an input parameter and choose the heat input that is required to produce temperature variations of 0.04 – 0.05 oC amplitude. Producing sea surface temperature variations with an amplitude of 0.04 oC requires a surface heat input of 0.33 watt/m2, as shown below:
http://i1244.photobucket.com/albums/gg580/stanrobertson/solarcycle10_zpsa3b8b0ee.jpg

Figure 2. Radiant flux, ocean temperature oscillations, and sea level variations for three solar cycles of eleven years each. The entering flux shown here is the value of q = 0.33 watt/m2 needed to drive the variations of surface temperature of 0.04 oC with ocean thermal diffusivity of 1.0 cm2/s to depth of 300 m. The amplitude of thermosteric rate of change of sea level was 0.47 mm/yr. Temperature lags the driving energy flux by 15 months. The thermal expansion coefficient of sea water used here was 2.4×10⁻⁴/ oC.
I believe that this settles the issue of what is required to produce sea surface temperature oscillations with an amplitude of 0.04 oC. The solar TSI variations that reach the earth’s surface are smaller than the 0.33 watt/m2 needed to account for sea surface temperature variations by a factor of 3.6 for this smallest estimate of sea surface temperature variability.
Although the estimated 0.33 watt/m2 that is required to explain the surface temperature variations is large compared to the amplitude of TSI variations that reach the surface, it is still only about two parts per thousand of the 160 watt/m2 of solar UV/VIS/NIR that reaches the earth surface. There are many possible ways in which the sun might modulate the surface energy flux to this extent. These include modulation of cloud cover and small spectral shifts in the energetic UV that might modulate ozone absorption or produce shifts of the effective sea surface albedo. It would seem to be a fairly direct radiative effect, rather than feedback, since it must vary in phase with the solar cycle.
In summary, my calculations based on energy conservation considerations imply that the sun modulates the ocean temperatures to a much greater extent than can be provided solely by its TSI variations. The great question that desperately needs an answer is how does it do it? It should be easily understood that solar effects would not necessarily be confined to cycles. More likely, the sun has been the driver of the large changes of temperatures of the Roman and Medieval warm period, the Little Ice Age, and the recent recovery from it without requiring large changes of its own irradiance. When we understand how the sun does this, we will have begun to understand the earthly climate.
###
Biographical note:
Stan Robertson, Ph.D, P.E, retired in 2004 after teaching physics at Southwestern Oklahoma State University for 14 years. In addition to teaching at three other universities over the years, he has maintained a consulting engineering practice for 30 years.
References:
Bryan, F., 1987: Parameter Sensitivity of Primitive Equation Ocean General Circulation Models. Journal of Physical Oceanography, 17, 970-985. (PDF available here http://journals.ametsoc.org/doi/abs/10.1175/1520-0485%281987%29017%3C0970%3APSOPEO%3E2.0.CO%3B2
Levitus, S. et al., 2012 World ocean heat content and thermosteric sea level change (0–2000 m), 1955–2010, Geophysical Research Letters, 39, L10603, doi:10.1029/2012GL051106, 2012 http://onlinelibrary.wiley.com/doi/10.1029/2012GL051106/abstract
Shaviv, Nir 2008, Using the oceans as a calorimeter to quantify the solar radiative forcing, Journal of Geophysical Research, 113, A11101 http://www.sciencebits.com/files/articles/CalorimeterFinal.pdf
Trenberth, K., Fasullo, J., Kiehl, J. 2009: Earth’s Global Energy Budget. Bull. Amer. Meteor. Soc., 90, 311–323. doi: http://dx.doi.org/10.1175/2008BAMS2634.1 www.cgd.ucar.edu/staff/trenbert/trenberth.papers/TFK_bams09.pdf , Fig. 1
Zhou, J. and Tung, K. ,2010 Solar Cycles in 150 Years of Global Sea Surface Temperature Data, Journal of Climate 23, 3234-3248 http://journals.ametsoc.org/doi/abs/10.1175/2010JCLI3232.1
jens says: October 11, 2013 at 11:47 pm
Leif, why do you keep harping on the stupid energy arguments?
Allan says:
jens, please consider using words such as “inappropriate” instead of the word “stupid”.
I’ve had interesting discussions with Leif for a long time and am quite certain that he is not stupid. Some adjectives do come to mind, but “stupid” is not one of them.
I would also appreciate it if others would not act in this way – if you are upset by this discussion, please find some other way to vent your frustration.
I suggest that kicking a car door works surprisingly well – but definitely kick someone else’s car, not your own, which would only increase your rancor.
I do think there are objective methods of solving this thorny question, but so far this is the best I’ve come up with:
http://wattsupwiththat.com/2012/09/16/onset-of-the-next-glaciation/#comment-1090817
Allan MacRae says: September 26, 2012 at 3:32 am
So are you saying that the global cooling observed during the Maunder Minimum (circa 1645 to 1715) had nothing to do with reduced solar activity?
Leif Svalgaard says: September 26, 2012 at 5:09 am
Essentially, yes. As the Sun does not vary enough.
Dr Norman Page says: September 26, 2012 at 7:32 am
The Maunder minimum is almost certainly the result of reduced solar activity – specifically reduced solar magnetic field strength which leads to an increase in incoming GCRs and the resulting increase in cloudiness and albedo.
Allan says:
OK…… Glad we cleared that up.
Could possibly resolve this question through a scintillating game of rock, paper, scissors?
🙂
lsvalgaard says:
“It [the thermosphere] has energy to heat 5 feet of troposphere.”
From zero K. With a ~3km winter polar troposphere, and ~240K polar temperature, we are at say a 1/1200 relative energy content rather than your 1/100,000 estimate. And that is with a maximum 2000°C estimate for thermosphere temperature, but is the heating stronger than that in the polar regions?
lsvalgaard:
“Explain how any or all of these can supply 3.6 times MORE energy than the variation of the TOTAL energy received from the sun.”
==================================================
Perhaps part of the answer is time, as in energy residence time. A solar cycle may average 11 years. What is the residence time of that change in TSI which reaches the ocean at various depths. Is some of that energy still there for the next six solar cycles? If those six cycles are all stronger then the previous six cycles, does each cycle add accumulatively to the total increase over 66 years? Is there an 800 year cycle in the oceans heat flows which correlates to CO2 and T?
So we have the thermal inertia of the oceans to consider, with various residence times of energy within the oceans, much of which is not known, as far as I know. And of course we have surface changes in energy received, due to albedo changes, and or changes in disparate albedo locations, (IE jet stream latitude changes) We have dozens of cycles, each cycle being of different length. Atmospheric cycles, ocean cycles, tidal cycles, solar cycles, etc, etc. Over time, simply by chance, some of the positive forcing of numerous changes in energy residence time and total input, will line up in a particular forcing direction, either cooling or warming. When these many disparate factor go in phase, we have major changes in climate.
Due to the many factors, sometime in phase, sometimes opposed and canceling, one would not expect a consistent strong correlation from any one factor.
As an illustration of the above general questions and assertions, a question for anyone. Is the earth gaining or losing energy in the S.H. summer?
Lots of comments, if mentioned before my apologies. Waters warmed by the sun do not stay in one place. The Gulf Stream as it approaches the UK is not warmed by solar energy at that latitude, it was warmed much closer to the tropics. The annual range of SST in the Gulf of Mexico is normally between 55F and 90F (give or take a few degrees). This is solely dependent upon the orbital changes the Earth goes through each year. So, how can we really understand the small temperature changes supposedly caused by solar effects when you have vast ocean circulation and large annual temperature ranges that all happen at different times and places around the Earth and that are caused by things other than the Sun. Just wondering.
Tom in Florida says: October 12, 2013 at 5:27 am
………….
Tom
Agree, absolutely. See my comment above
http://wattsupwiththat.com/2013/10/10/the-sun-does-it-now-go-figure-out-how/#comment-1444342
Forget about the tiny TSI variability. Ocean currents are far from ‘static’ (excuse the pun) as the climate models assume.
Tom in Florida says:
“..vast ocean circulation and large annual temperature ranges that all happen at different times and places around the Earth and that are caused by things other than the Sun.”
Unless of course solar plasma variability effects pressure systems and the jet stream latitude and equatorial winds, then it would be forcing the AMO and ENSO.
lsvalgaard says:
Leif,
Looking for the source of the missing heat, I did a little math regarding the annual energy consumption of the world from various estimates found online and using consumption as production came up with roughly one millionth (1/1,000,000) of the Wh that the sun bequeaths upon the earth each year. Sound like a reasonable number? Not much heat added there.
What about the 70% of the planet covered by water and all of the potential thermal vents we don’t know about? Any estimates available regarding the potential ocean warming from these?
@ur momisugly Allan Mcrae; An argument can be stupid without the person making it being so. It depends on the motivation, upon which one can only speculate. For example, saying that the “sun doesn’t vary enough” to cause climate change is just stupid. One can only say that we don’t really know what causes climate change, but there are many, often-conflicting variables, including the sun, and they depend on whether you are talking short-term or long-term.
… is the energy source from beneath our feet? Why is there such a good correlation between the recent increase in global temperature and the rate of movement of the magnetic north pole?
I completely get the energy mantra Leif is postulating.
The equatorial band is an important place on Earth in terms of variations in SWIR heating. The Sun beams away at the TOA at a steady rate and then must find its way through the changing atmosphere to the surface. In particular, the equatorial atmospheric band is highly variable but also somewhat predictable and could be the source of energy variation needed to produce heating trends.
Why an equatorial band in my thinking? As the angle increases in terms of irradiance at the ocean surface, shortwave infrared is less able to penetrate and is instead reflected away. Therefore irradiance location is an important metric in determining oceanic heating. The width of the “meaningful” equatorial band is of interest to me.
And why a focus on just equatorial clouds? Equatorial cloud formation and variations allow in or reflect away various amounts of SWIR in the place on the globe that matters the most in terms of oceanic heating. Variation in cloud formation within this equatorial band is an important metric in determining in situ oceanic heating in the short term as well as heat available elsewhere as oceanic currents take those waters away from the equatorial band in the long term.
I have said it before. We may not need to know cloud formation and SST everywhere on the globe. My hunch is that extratropical variations in clouds and SST are far more chaotic and unpredictable and could be what we call weather. But the equatorial band may be the “sweet spot” place to study regarding important long term climate trend information. Just how wide the band needs to be before hitting diminishing returns fascinates me.
lsvalgaard, “Taken to its logical conclusion one could [and you could too] dispense with the solar cycle variation of TSI altogether and your question becomes: “can 0.00 watt/m2 amplitude of variation of TSI entering the oceans produce temperature oscillations with an amplitude of 0.04 – 0.05 oC?”.”
Right, TSI variation as determined doesn’t have the energy to produce climate change of any significance as determine. So any correlation of climate with solar has to be either due to “other” solar amplifying effects or human error in making all the assumptions leading to the determinations 🙂
Leif,
Found one:
“The energy available is simply immense, far beyond anything ever before harnessed by mankind. National Geographic estimates the energy escaping from just the known vents to be 17,000,000 MW, an amount that approximates all human consumption on the planet, and there are tens of thousands of kilometers of ridge system that have never even been explored.”
Found an “estimate”. Now we are up to two one millionths. But that does not include all the ones we don’t know about.
Cooler says: “CO2 has nothing to do with warming atmosphere, in contrary it is a good cooler …”
And that statement is perfectly consistent with a systems view of temperature and CO2 in the ice core record. Increasing temperature drives up CO2 levels which then become large enough to first stop the temperature from increasing further and then they persist to cause temperature to decline again ultimately bringing CO2 back down again. The alarmists who perpetually claim that somehow “CO2 later takes over” from ~whatever~ initiated temperature rise cannot explain what enormous decrease in forcing could have caused temperature to start coming back down with so much more CO2 in the air given their religion of “CO2 drives temperature”.
Jim G says:
October 12, 2013 at 7:31 am
What about the 70% of the planet covered by water and all of the potential thermal vents we don’t know about? Any estimates available regarding the potential ocean warming from these?
Some number i have seen puts it at 0.05 W/m2, thus not much [however comparable to Stan’s 0.09 W/m2 🙂 ]
Allan, I did not say that Leif was stupid. Indeed, he appears to be quite bright and certainly knowledgeable. So much more surprising is it that he keeps insisting on these “inappropriate” arguments. I consider this stupid when the “inappropriateness” has been explained i detail in many comments.
jens:
Your post at October 12, 2013 at 7:54 am says in total
But his comments are very appropriate.
I refer you to my comment in this thread at October 10, 2013 at 4:48 pm. This link jumps to it
http://wattsupwiththat.com/2013/10/10/the-sun-does-it-now-go-figure-out-how/#comment-1443729
Richard
PS In that post I said “an order of magnitude” when I should have said “a factor of three” but that does not affect the point being made.
jens says:
October 12, 2013 at 7:54 am
he keeps insisting on these “inappropriate” arguments.
All I’m doing is seeking clarification and guidance. If I have misunderstood [or not understood] something I ask for explanation. Being meet with ‘stupid’ or ‘inappropriate’ is not helpful. When people seek explanation from me I go out of my way to do my utmost to provide some that are on a level that can be understood by the questioner. I ask questions that push the discussions to get to the mushy parts of it. And so far in this thread I have not gotten what I need. If you know better, you can be helpful by enlighten me.
Mike M says:October 12, 2013 at 7:50 am
Cooler says: “CO2 has nothing to do with warming atmosphere, in contrary it is a good cooler …”
And that statement is perfectly consistent with a systems view of temperature and CO2 in the ice core record. Increasing temperature drives up CO2 levels which then become large enough to first stop the temperature from increasing further and then they persist to cause temperature to decline again ultimately bringing CO2 back down again.
Thanks for bringing that up. My first take on looking at the ice core vs. temp reconstructions was ‘how could anyone believe CO2 causes unlimited heating, when every time CO2 gets high, we have another ice age’. It just never computed.
bones says:
October 11, 2013 at 7:59 pm
“The thermal diffusivity you mentioned would apply to a few cm of water in a beaker, but not to the oceans. The thermal diffusivity used to describe ocean temperature profiles is a turbulent mixing average diffusivity that accounts for wave mixing, tides, shears, salinity driven motions, etc. You have to do some reading on mixing length theories and averaging to sort it all out. It is an approximation, but one that was adequate for my purposes.
So there is one “beaker thermal diffusivity” which applies to water in beaker and another “ocean thermal diffusivity” instead applies to oceans, has values impossible for any real material, not speaking water -for the case of the beaker thermal diffusivity and if I understand it well, it is some approximation, which is adequate for falsification purposes of the hypothesis the rising TSI can heat ocean as observed, but instead of sound explaining at least principle I´m referred to to read extensively.
And although I don’t completely understand the way how you came to your conclusions it somehow makes blinking the credibility warning light in my head and again reminds me about certain Trenberth, you also mention, seriously talking about water having allegedly ε=0.9907 according to somebody in his flagship paper, then using ε=1 there anyway for whole surface getting his straighforwardly absolutely impossible 396,4W/m^2 figure for 289,15 K water temperature – itself highly suspicious value, but others are called ignorant when pointing out the obvious and referred to reading.
Just couple of notes which come to my mind:
– 390W/m^2 thermal radiation for 288K water is unrealistic, based on inadmissible assumption of ε=1 which no real material can achieve – even laboratory blackbody barely has ε=0.99 (value, which would already make 286 from the 390 figure in the real world) – and that is moreover for 0° emission angle. For the similar reason the outgoing additional 0.22 W/m^2 value looks to me like rather overestimation for 0.04C temperature change as looks to me being overestimation the 5.42 watt/m2 for each 1C increase of surface temperature – not so much gross as beyond realm of possible.
– 90% of ocean is at latitudes up to 61°, where the average insolation is well over the 160W/m^2. I can add that 70% of ocean is at latitudes up to 42°, and half is up to 29th parallel, implying considerably higher ocean insolation than global average.
– Reflectivity of water at 67° incidence angle is way lower than 6.7% – so the Trenberth´s 23W/m^2 of average surface reflection, even if true, doesn’t apply for ocean between polar circles (94%), which again calls also into question the 160 W/m^2 value itself, at very least when talking about ocean. And here again for similar reasons the 0.07W/m^2 amplitude derived for given spectrum looks to me like underestimation – and even the 1365 figure looks to me overblown several Watts per square meter, when I look into the SORCE-TIM TSI data.
– Although it definitely looks like the solar cycle signal is well prominent in the SST data, the variability of the ocean SST during solar cycle doesn’t seem to me being a sound base for conclusions as it seems to me being impossible to well quantify the temperature amplitude from data which seem to have uncertainty in order comparable to the 0.05C, as looks to me highly dubious the quantification of solar signal amplitude reaching the ocean. Not speaking that in frame of one solar cycle the solar variability largely cancels itself out, especially by the typically longer in time right tails of the signal (let alone its signal is quite different from sinusoid) allowing usually considerably more time for surplus heat dissipation than was there for its creation from the solar radiation during the rising activity period.
For at least this reasons which instaantly come to my mind (even ignorant about the ocean thermal diffusivity and some other stuff you name – and it is not explained in the article, nor discussion below) I doubt the analysis outcome and especially its quantification in the factor 3.6 figure.
Jim G says:
October 12, 2013 at 7:31 am
Undersea volcanism varies over time, of course. Air temperature in the Cretaceous, for instance, was warm, but not enough to heat the oceans to the degree observed in proxy data. Sea level was so high then not just because of lack of ice, but due to thermal expansion of the oceans, thanks to submarine volcanism-driven active seafloor spreading as the continents raced away from each other. They’re still doing that, of course, but not to the same extent as especially in the mid-Cretaceous.
If solar activity goes to the average solar parameters I have mentoined cooling will be the result.
avg solar parameters needed
solar flux sub 90
solar wind sub 350 km/sec
cosmic ray count per min. avg north of 6500
solar irradiance off .015%
euv light avg. sub 100
imf field avg 4.0 nt
ap index avg. sub 5.0
If solar activity stays as it has been for the last year or so expect neutral or no temperature change.
Which has been the case.
jens, bruce et al,
To be clear, I am asking for more courtesy in this dialogue.
And I too have been intemperate at times and have occasionally chosen “inappropriate” words. Mea culpa*3. Sincere apologies to Leif.
The popular debate in climate science suggests that this science is in its infancy. I further suggest that the majority of climate science has taken a giant step backwards in recent decades due to egregious political interference and scientific misbehaviour.
Notwithstanding all the wonderful data available especially since ~1979, we have an “ECS mainstream debate” that ASSUMES THAT CO2 SIGNIFICANTLY DRIVES TEMPERATURE and centres on the question of “climate sensitivity to atmospheric CO2” (“ECS”) that questions whether ECS is greater or less than 1 (that is, are there positive or negative feedbacks to increasing atmospheric CO2).
Since CO2 clearly LAGS temperature at all measured time scales, this ECS mainstream debate requires that, in total, “the future is causing the past”, which I suggest is demonstrably false.
To be clear, I suggest that atmospheric CO2 does NOT significantly drive Earth temperatures, and Earth temperatures clearly drive atmospheric CO2.
This does not preclude the possibility that the observed increase in atmospheric CO2 is primarily caused by some factor (natural and/or humanmade) other than temperatures, but such increase in CO2 is insignificant to Earths’ temperatures.
In summary, in climate science we do not even agree on what drives what, and it is probable that the majority, who reside on BOTH sides of the ECS mainstream debate, are BOTH WRONG.
It is also possible that I am wrong on this point ( possible, but not probable :-} ).
Next there is the subject of this thread – does the variability of the Sun significantly drive Earth’s climate?
Again, people of more-than-average intelligence sit on opposite sides of this question.
In their frustration to make their point, they call the argument of the other side “stupid”. I suggest that this sort of comment does little to bolster the credibility of the commenter’s argument.
So perhaps a little courtesy and forbearance is appropriate while we sort all this out.
***
Pamela Gray says:
October 12, 2013 at 7:38 am
***
I think you’re on the right track. Look at this pdf on D-O events Dr S provided. I think you’ll find it interesting:
http://www.leif.org/EOS/palo20005-D-O-Explanation.pdf
The most obvious question for an ignorant, non-physicist to ask is this:
Are there any wavelengths within the TSI which alter radically depending on the strength of the solar cycle??
After all, if you posit that solar effects can impact on ocean warming and that the amplitude of the sunspot cycle determines how much effect there is, then presumably the key is finding some specific solar irradiation which reaches earth in a manner which is somewhat proportional to the ‘strength’ of the solar cycle.
The 10.7cm radio flux is clearly one, but presumably there might be others also??
The next question is ‘what particular wavelengths does seawater absorb effectively? Are any of these radically altered during different solar cycle strengths?’
The third question is: ‘can algae, plankton species etc affect ocean temperature through harvesting sunlight and transmitting heat to the ocean in a manner which is proportional to the strength of the solar cycle?’
I”m sure there are others and it may well be that others have already asked these questions and answered them………