
Here’s an interesting Q&A on issues with trying to determine the SAT of the Earth that I have not seen before. There’s a surprise at the end as to who wrote it.
Q. What exactly do we mean by SAT ?
A. I doubt that there is a general agreement how to answer this question. Even at the same location, the temperature near the ground may be very different from the temperature 5 ft above the ground and different again from 10 ft or 50 ft above the ground. Particularly in the presence of vegetation (say in a rain forest), the temperature above the vegetation may be very different from the temperature below the top of the vegetation. A reasonable suggestion might be to use the average temperature of the first 50 ft of air either above ground or above the top of the vegetation. To measure SAT we have to agree on what it is and, as far as I know, no such standard has been suggested or generally adopted. Even if the 50 ft standard were adopted, I cannot imagine that a weather station would build a 50 ft stack of thermometers to be able to find the true SAT at its location.
Q. What do we mean by daily mean SAT ?
A. Again, there is no universally accepted correct answer. Should we note the temperature every 6 hours and report the mean, should we do it every 2 hours, hourly, have a machine record it every second, or simply take the average of the highest and lowest temperature of the day ? On some days the various methods may lead to drastically different results.
Q. What SAT do the local media report ?
A. The media report the reading of 1 particular thermometer of a nearby weather station. This temperature may be very different from the true SAT even at that location and has certainly nothing to do with the true regional SAT. To measure the true regional SAT, we would have to use many 50 ft stacks of thermometers distributed evenly over the whole region, an obvious practical impossibility.
Q. If the reported SATs are not the true SATs, why are they still useful ?
A. The reported temperature is truly meaningful only to a person who happens to visit the weather station at the precise moment when the reported temperature is measured, in other words, to nobody. However, in addition to the SAT the reports usually also mention whether the current temperature is unusually high or unusually low, how much it differs from the normal temperature, and that information (the anomaly) is meaningful for the whole region. Also, if we hear a temperature (say 70°F), we instinctively translate it into hot or cold, but our translation key depends on the season and region, the same temperature may be ‘hot’ in winter and ‘cold’ in July, since by ‘hot’ we always mean ‘hotter than normal’, i.e. we all translate absolute temperatures automatically into anomalies whether we are aware of it or not.
Q. If SATs cannot be measured, how are SAT maps created ?
A. This can only be done with the help of computer models, the same models that are used to create the daily weather forecasts. We may start out the model with the few observed data that are available and fill in the rest with guesses (also called extrapolations) and then let the model run long enough so that the initial guesses no longer matter, but not too long in order to avoid that the inaccuracies of the model become relevant. This may be done starting from conditions from many years, so that the average (called a ‘climatology’) hopefully represents a typical map for the particular month or day of the year.
Q. What do I do if I need absolute SATs, not anomalies ?
A. In 99.9% of the cases you’ll find that anomalies are exactly what you need, not absolute temperatures. In the remaining cases, you have to pick one of the available climatologies and add the anomalies (with respect to the proper base period) to it. For the global mean, the most trusted models produce a value of roughly 14°C, i.e. 57.2°F, but it may easily be anywhere between 56 and 58°F and regionally, let alone locally, the situation is even worse.
Source is here
h/t to: Nick Boyce
Gavin:
“Q. What exactly do we mean by SAT ?
A. I doubt that there is a general agreement how to answer this question.”
I’ll help out. Whatever we can feed the journalists so that they can write a piece of propaganda as ordered by GLOBE.
Unfortunately, starting in September, nobody will listen anymore to what the propaganda apparatus of the Western World says; as the West is broke and corrupt. (G20 meeting in Russia)
Any measure of “surface air temperature” can’t be done without defining the surface to air interface. The ocean surface has a thermal heat capacity thousands of times higher than the air above it. Seawater is 800 times the density, and has 4 times the specific heat capacity.
Just study http://www.eoearth.org/view/article/152458/
Or just put a thermometer on the ground and read the temp.
If you want to know the global temperature trend, just put a thermometer in every 100 meter square around the Earth and read them all at the same time. If you can’t do that, then just a few around Antarctica for a few decades. No heat islands there. By the way, those Antarctic thermometers at Amundsen-Scott, Halley, Davis and Vostoc science stations all show zero warming since 1958
Gavin Schmidt, BTW, is a criminal. He continues the perversion of the temperature record.
http://suyts.wordpress.com/2013/07/23/really-giss-dishonesty-continues-in-post-hansen-era/
Probably he hopes to get prices by European royalty and book sales like Hansen.
Yes. The ever changing GISS data is as about as useful as a fur lined syrup pitcher. If the dolts ever got to where they quit playing computer games and left the historical temps alone, they could move on to some thing else like energy calculations without the ever changing base. Then, they just may come to realize exactly how useless a global temperature average is.
Temps from different base temps, put in anomaly form are averaging unlike values. The hotter the base temp is, the more energy it takes to raise it X amount degrees. The cooler the temps, the less energy to warm the same space with same content the same X amount of degrees. A global average temp anomaly is a nonsensical metric. It’s like averaging stamp prices with the rpm of your fan.
More than that, even if they ever got to the point of actually measuring temps, it says nothing about the direction. SSTs are my fav!!! Is that measuring energy change going up or down?
If anyone is interested, I just finished a comparison to once was the GISS iteration of the first 30 years of our temp record to what it is today. It’s kinda funny all by itself.
Cool – this looks a lot like what I’ve been saying all along… there is no actual SAT, and the definition of same is fluid and depending on the person and purpose.
Now, let’s hear a sane discussion about the usefulness of Arctic sea ice extent, where people start to admit that it’s essentially meaningless as well…
Ohhh No…. You mean I’ve been under the assumption that they knew what the SATs were?
The ever changing GISS data is as about as useful as a fur lined syrup pitcher.
================
roaring laughing………………
“the usefulness of Arctic sea ice extent”
dumbest thing I’ve ever seen………..
Folks: We have here a WA Guesstimate. But trust us!
If I was a modeler…I’d be pissed as hell!
Jiggle the past temps that I’m trying to tune to…..it’ll never be right
“””””……Leif Svalgaard says:
August 14, 2013 at 11:10 am
One way of getting at a climate-significant temperature is to measure from a satellite far away in space the amount of radiation [Earth Total Irradiance if you will] received from the Earth [by ‘staring at the Earth’]. From that, an ‘effective’ temperature can be calculated and its variation monitored. There have been such proposals, but they have come to naught…….””””””
Well the earth as seen from space, would have radiating areas, with (surface) Temperatures ranging from near -90 deg C up to at least + 60 deg C all at the same time in northern summers. Then there would be the various radiating atmospheric strata; not to mention simple and not so simple scattering of solar spectrum energy by clouds et al.
So there is no way that such an energy source would have a Planck spectrum like a single Temperature near black body source.
Well you could always define the Temperature as being that Temperature of a single Temperature BB source emitting the same total spectral radiance, as the real earth.
But does even that have any valuable physical meaning ?
Mother Gaia knows the correct Temperature of the earth; but she ain’t telling us what it is.
The Q&A is useful and surprisingly scientific, given its authorship.
It’s not as useful, say, as Essex and McKitrick’s dissection of the very idea of global mean temperature, but it is nice to read nonetheless.
I’m increasingly amazed that temperature, of any kind — local, regional, or “global” — has been allowed to stand in for heat/energy in the analysis of the multi-layered, interdependent, chaotic ocean-atmosphere system. Whether the whole vast entity is gaining in energy would require long-term measurements, a century and a half, say, of the following:
all ocean currents
all river systems’ flow
all glacier systems
air chemistry at all locations
ocean chemistry at all points
lightning frequency
potential electric energy in the atmosphere, at all points
wind, at all locations
relative humidity, at all locations
and, oh yeah, temperature, at all locations
Some very immature minds were so intoxicated that the system could be “known” via a single variable, a mishmash b.s. one at that, that they bastardized science in a way that was not necessarily likely at this stage in the game. Bear in mind that objective understanding of the oceans and atmosphere was actually increasing half a century ago. Things did not have to turn out this way.
Q: If SATs cannot be measured, how are SAT maps created?
Ruh roh – somebody left the model running too long – climate predictions don’t follow observed and never have.
there are data and then there is the real world
theories that hold are somewhere in between I guess…
The difference between 57.2 and 56 is 1.2 degrees F. Isn’t that about how much the planet has supposedly warmed over the past century? So, basically this is an admission that the estimated amount of modern global warming falls within the margin of error for measuring global mean temperature. Doesn’t that make it statistically indistinguishable from zero? If so, that’s quite an admission.
It is only one of many horrendous features of climate claims. The venerable book How to Lie with Statistics lists reporting an anomaly, especially an anomaly that cannot be normalized withing error bars greater than the anomaly itself, as a classic method. It works best, of course, if you cherrypick your interval so that it shows whatever you want it to show, and downplay any intervals that don’t show what you want it to show.
Another serious problem with this is that it says “climate models” at all. In other words, when discussing global warming one is comparing the output of one series of models to the output of another! There is literally no way to test either set of models against reality — one takes reality in and returns a synthesized product that is some sort of transformation of the actual data. It extrapolates and infills, takes numbers from a single location and smears it out over an area many times its size whether or not it is representative of that area. It is almost certain that the error resulting from this process is several times larger than the spread in the model means, especially since the model means are, no doubt, adjusted by means of one or more variable parameters to be within range of some value that is believed to be the mean global temperature. The GCMs then turn around and produce values that temporally extrapolate fits not to the actual data but to the extrapolated infilled data. They are literally fitting one model with another model. The error bars associated with such a double fit are, obviously, larger than the error bars associated with each model individually.
Finally, the mean of many models is a mean-ingLESS quantity. The variance of many models around their mutual mean is also a meaningless quantity. The central limit theorem does not apply to the means of multiple, supposedly independent models, it applies to independent and identically distributed samples drawn from a single model. In no possible sense are model parameters and design features random variates drawn from an iid distribution of model parameters and design features.
But the real tragedy, the truly annoying feature of the entire debate, is that not one word of the Q/A session above will make it into the AR5 Summary for Policy Makers, no matter who wrote them. We wouldn’t want to confuse the policy makers that might vote to take our money and other drastic measures designed to save us from a disaster predicted by models of models by telling them explicitly that we have no idea what the surface air temperature produced by the models mentioned above really is, but that WHATEVER it is it cannot be meaningfully be compared to thermometric readings from a century again where we don’t even have the bare possibility of normalizing the “anomalies” of the day to the “anomalies” of the present given that to do so requires begging the question — a prior knowledge of what the mean temperature then versus now really was. We also would not want them to have any chance of noticing that the spread in the model means is as great as the entire warming “anomaly” supposedly observed in the last 140 years.
After all, one of them MIGHT have read the book How to Lie with Statistics, and that person might ask some difficult questions, publicly, and then where would we be? Honestly reporting our lack of “settled science” at a level so fundamental that it leaves the entire debate as:
“We might have warmed a full degree since 1870, give or take pretty much a full degree. Some fraction of that warming — if it warmed at all — might have been our fault. Or, since at least half of that warming preceded any significant increase in atmospheric CO_2, maybe not. But we are certain that we are in enormous danger of an anthropogenic climate catastrophe, because our models, fit to other models for the SAT and repeatedly adjusted (on both sides) until they both produced the same anomalies around mean temperatures that substantially differed between the models, predict catastrophic warming if certain parameters, that we can only guess at because they cannot be measured given that the entire functional process that we claim is going to lead to the warming cannot be measured and they are part of that process, are in fact correct, and we ignore the fact that in SPITE of fitting the models of models so that they worked great during the fit interval, they have essentially no predictive value whatsoever in the 16+ years since they were fit, even predictive value of the models they were designed to fit, even when those models themselves are tweaked as much as we can possibly stand to tweak them.”
I seriously think that AR5 needs to be openly called on the errors of AR4 BEFORE they finally release it, in such a way that it is made clear that they will not get away with them again. It also needs to be pointed out that climate sensitivity is in what amounts to free fall as it becomes more and more constrained by the pesky lack of warming. 2013 sounds like it might well shake down as a year where it substantially cools, especially if the arctic cooling persists. North Carolina had the coolest summer I can remember since back in the late 70s or early 80s — it has rained almost every day over much of the state. Today the high temperature in Durham is going to end up being maybe 77 F. In mid August! I cannot tell you how unusual that is. The high temperature PREDICTED for the rest of the week is 79 F. The low temperature is dropping down to the low 60’s. The Atlantic and Gulf of Mexico are comparatively cool — warm enough for hurricanes, to be sure, but cooler than one might expect in August, and the waters off of the coast of Africa have barely hit 80 F.
This is OCTOBER weather, not August weather. It absolutely could warm up to seasonal norms, but every day spent cool still lowers the averages.
Interesting times. We’ll see if the IPCC AR folks have the pills to release yet another doom and gloom report and yet another deliberately misleading Summary for Policy Makers into the teeth of what could easily end up one of the coolest years in the last 30, a year where Arctic Sea Ice actually recovers fairly substantially towards its “norm”, whatever that might be.
rgb
It is generally assumed that the AMO cycle is 60years long, but I found it varies between 54 – 66 years. It is often said by sceptics that two bursts of the global temperature rise in the 20th century are associated with the AMO.
Here is a test.
I searched for two sections of the 20th century GT with same trend line slope and found them with no trouble each 33 years long (as it happens half of the longest AMO) and 54 years apart (this time the shortest AMO).
http://www.vukcevic.talktalk.net/GT-AMOsx.htm
Common sense is not much good here, so possible alternatives are:
– coincidence (neutral view)
– CO2 sensitivity law of some kind or another (warmists’ view)
– AMO in action (sceptics view)
I have no idea, but I would think probability of a coincidence is not very high.
Some very immature minds were so intoxicated that the system could be “known” via a single variable, a mishmash b.s. one at that, that they bastardized science in a way that was not necessarily likely at this stage in the game. Bear in mind that objective understanding of the oceans and atmosphere was actually increasing half a century ago. Things did not have to turn out this way.

 is some suitable coarse-grain averaging interval and
  is the area of the Earth, that is, the fourth root of the spatiotemporal average of
  . This quantity, times
  , is arguably the outgoing radiative energy flux at the surface (or proportional to that flux in some reasonable way) and one might actually learn something about what the Earth is doing radiatively from this quantity that is completely hidden in:
 itself. The second thing that we could do is take Lief’s excellent suggestion and position enough satellites (perhaps at Lagrange points) that we can measure the Earth’s total (full spectrum!) luminosity on both the illuminated side and the dark side, all of the time. It would have to be done with frightful precision, and would have to be matched with real-time measurements of TOA incoming insolation levels to equal (but easier) precision, but one could then at the very least START to study whether the Earth is indeed in a state of energy imbalance. As it is now, they are looking for “missing heat” when they don’t even know (on the basis of ANY sort of measurement) if there is any missing heat to be found.
Remarkably well said, actually. I agree.
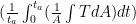
If they were GOING to try to publish a global mean temperature that is ARGUABLY meaningful, they might try publishing:
where
which has literally nothing to do with radiation rates in the specific sense that there is a huge range of positive power (gain) and negative power (loss) consistent with any given value of the latter, depending on the DISTRIBUTION of the former.
But as you say, this would still not be a gold standard of meaning, only better than the mean of
rgb
Meta-comment for Anthony:
I tried the preview button for the math text above. It did let me verify that the latex code was correct, but the previews I’m seeing suck pretty badly — they don’t really look at all like the posted article. This includes the paragraph layout, the fonts, the scaling. It’s like a dim, distorted preview so far.
I totally appreciate the improvement, and the amazing thing about dancing bears is that they can dance at all (not how gracefully they dance) etc, but if in fact this CAN be tweaked until the preview looks exactly like the posted article, that would be fabulous.
A second feature one has on at least some uber-blog websites (such as Goodreads) is the ability to edit one’s posts after they are made. On a site like this one you might or might not want to permit this, but it is really useful in civilized conversations…
rgb
rgb
@RBG Yes this is just one I’m trying out with the new Enterprise service…-Anthony
Oops, I meant the average of , not the fourth root of the average of
  , is proportional to the outgoing term in the Stefan-Boltzmann equation. Sorry.
rgb
george e. smith says:
August 14, 2013 at 1:24 pm
But does even that have any valuable physical meaning ?
Yes it is a measure of what goes out. If we compare with what goes in [TSI] we can do the energy balance. And that is valuable. And meaningful. To wring hands and say that the temperature cannot be measured, or is nonsense, or is useless, etc, is ostrich-science.
rgb writes:
“we don’t even have the bare possibility of normalizing the “anomalies” of the day to the “anomalies” of the present given that to do so requires begging the question — a prior knowledge of what the mean temperature then versus now really was.”
Yep. Their argument is one tight little circle.
Perhaps Mosher could fill us all in (including Gavin) on “what we mean by SAT”
Simple, I’ve explained it a number of times here.
the ‘average’ is the estimate derived from known measurements which minimizes the error.
For example we have 39000 stations. we dont actually compute an average of these.
what we do is compute a field . (x,y,z,t)
now you can integrate this field say at time t. jan 2012. and you get a number
15.2356547654C.
Pick a spot that hasnt been sampled. your best estimate for the temperature at an unobserved location is 15.2356547654C
if you tell me the x,y,z, as well as the t, that estimate will be sensitive to the location.
Think of it this way
you have a pool. the thermometer at one end reads 74F. the other end reads 76F
Estimate the temperature at the center of the pool. ypu decide to average 74 and 76 and get 75.
While you may use averaging to arrive at this estimate, its more accurate to describe ’75F’ as the estimate of temperature at unsampled places which minimizes the error rather than describing it as “the average pool temp” . you might USE averaging to get this number, but the number actually represents your best estimate of the temperature at un sampled places.Folks often get sloppy in their descriptions and call this “the average temperature” but that’s not really what it represents. Its the estimate of measurements at unsampled places.
The nice thing about this formulation ( the way we do it ) is that we avoid averaging over stations, we integrate the field and we can actually test the hypothesis as we get new data. So, for example, I’ve identified a pristine series of data stations that are fully calibrated,
these were not used in the construction of the field.
Now I can test: My field says the temperature value at x,y.z,t should be 12.C
then look and see. is it?
You can actually do this with Giss and Cru as well.
In the grand scheme of global warming what you want is what leif suggests. That’s what you really want. but life is not burger king and you cant have it your way.
Since we dont have that we are left with diagnosing a complex system by looking at a thin slice at 2meters. and a few other slices in the ocean and atmosphere. woefully inadequate, but not uninformative.
also the 2 meter slice is not very robust when it comes to total system characteristics, but that slice is meaningful to the creatures who live there.
deciding whether one can use the data for policy or safely ignore it, is not of much interest to me. it just is what it is. A number that give us a glimpse into a complex system.
Global temperature makes sense only as an imaginary variable of no particular practical value.
Here are two regions of the globe, barely 1000km apart (2.5% of the circumference) with long and relatively accurate temperature recording:
Central England and Central Europe
http://www.vukcevic.talktalk.net/2CETs.htm
Make of it what you may.
Measuring temperature on Earths surface is only relevant during sunlight hours (clouds or not). If the Earth did not rotate the dark side would be -473K and the other side who knows 2000C? or more? The warmness during night is due to the days exposure to the Sun. Or you could say what would happen to the Earths temperature if the Sun dissappeared? The whole surface would be -473K (temperature of Space) stand to be corrected on the exact K figure there. Of course as you dig deeper the temperature will increase due to gravity. This is assuming no atmosphere of course.
So if they know that there are so many uncertainties, then why are they still pushing alarmism?
Eliza says:
August 14, 2013 at 2:52 pm
……
you ment to say – 273.15 + 2C of background radiation