Guest Post by Willis Eschenbach
Supporters of the British Columbia (Canada) carbon-based energy tax that I discussed in my last post have made claims that the data shows this tax was a success … so being a suspicious-type fellow, I thought I’d take a look at the data myself. I didn’t figure the tax was having much effect, but I was prepared to find anything. Reality’s funny that way, I like not knowing which bush hides the rabbit … anyhow, here’s a typical claim:
MOTOR GASOLINE (DRIVING)
The above figures show changes in overall use of all petroleum fuel products (subject to the carbon tax). To gain some insights specifically into how the carbon tax has affected the behaviour of drivers, one can examine just the changes in motor gasoline consumption (one component of the overall fuel use numbers). Since 2008, per capita gasoline use in BC has declined by 7.3% more than in the rest of Canada (Table 4) – a substantial difference. Gasoline use in BC was already declining faster than in the rest of Canada from 2000-2007 (see Figure 4).
The tax covers all carbon-based fuels, heating fuel, jet fuel, kerosene, natural gas, all of them. Data is unavailable for some of them, so I have looked at the consumption of the highway fuels, gasoline and diesel, to see if the tax has any effect on how people are driving up in the frozen North.
Statistics Canada has an excellent website, from which I got most of my data about the fuel use. First, here are the raw changes in per capita diesel and gasoline use (combined) by Province for the years 1993-2011. This analysis is only the gasoline and diesel used on the roads, not the use of those fuel for off-road vehicles and farm tractors and the like. (Note that off-road and farming fuel, and indeed fuels for all purposes and users, are all subject to the BC carbon-based energy tax.)
 Figure 1. Per capita Canadian diesel plus gasoline use by Province. Only fuels used on the highway are counted. Thick red and black lines show British Columbia and Canadian average per capita fuel use. Nunavut and Northwest Territories are not included due to lack of data for the earlier years, before Nunavut was created. DATA SOURCE
Now that’s interesting, but it doesn’t really allow us to look at the subtle year-to-year changes. For that we need to look at the percentage changes in emissions by province, to see who is going up and who is going down.
In looking at a percentage change in anything, the first question of interest is, percentage change from what starting point? Because the tax was instituted in 2008, I looked at the percentage change from that time. Figure 2 shows that result, and given the claims of the proponents of the tax, it’s quite funny … well, it’s funny except if you live in BC, I guess when the joke’s on you it kind of loses its humor. Anyhow, here’s the percentage change in per capita use of highway fuels by province:
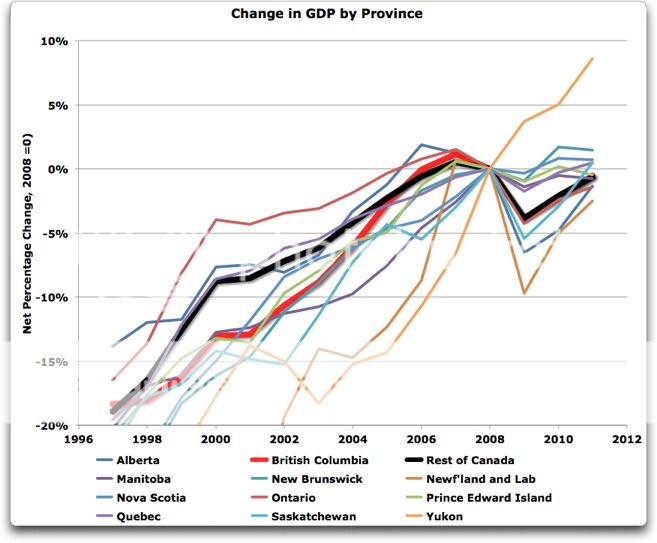
 Figure 2. Percentage change in fuel use, with the year 2008 used as the base from which the percentages are calculated. Blue line shows the corresponding percentage change in the real (inflation-adjusted) Canadian GDP. 2011 is the most recent year for which StatCan has data.
The first thing that stands out is what I found in my analysis of the US driving habits—Americans drive more miles in good economic times, and cut back on the driving in tough economic times. Similarly, the highway fuel used in both British Columbia and also the rest of Canada has moved roughly in parallel with the national economic situation.
The next thing I noticed was that from 1993 to 2008, BC had the slowest growth in highway fuel use of all of the Provinces.
Next, the changes in highway fuel use after the imposition of the tax are interesting. Figure 3 shows a closeup of Figure 2, highlighting the recent period from 2004 to 2011.
 Figure 3. Closeup of Figure 2, showing the post-tax changes in road-fuel use. The BC carbon-based energy tax was instituted in 2008.
So … just like the rest of Canada (thick black line), BC road fuel use dropped from 2004 to 2008, when the BC tax was instituted … except it was dropping faster than the national average.
Again just like the rest of Canada, the BC road fuel use bottomed out in 2009, the year following the imposition of the carbon based energy tax. I can only assume that this is related to the blue line, showing the real GDP for Canada.
And just like the rest of Canada, since then British Columbia road fuel use has risen to the end of the record … except it’s risen faster than the national average.
Now here’s the funny part. From 2004 to the tax year of 2008, BC road fuel use was showing nearly the fastest decrease in fuel use in the country. Fuel use dropped about three times as much as the rest of Canada during that period. That was before the tax.
After the tax, BC road fuel use dropped, but for only one year. So did the rest of Canada, and the US, showing that the drop was at least in part due to the global financial meltdown.
And since 2009, BC is tied with the Yukon territory and Newfoundland/Labrador for the fastest increase in fuel use in the country. Highway fuel use rose five times faster in BC than in the rest of Canada since 2009.
Finally, since 2008 when the carbon-based energy tax was imposed, energy use on the road has risen in BC, not fallen. And not only has it risen, since the tax took effect BC has risen faster than all but three of the other provinces.
Can we say that the carbon-based energy tax hasn’t changed fuel use in BC? Nope, all I’ve looked at is road fuel … but fuel use on the highways of BC sure hasn’t changed. Well, that’s not exactly true.
Before the tax, per capita road fuel use in BC was dropping faster than almost all the provinces.
…
After the tax, per capita road fuel use in BC is increasing faster than almost all the provinces.
…
So actually, yes, I’d say I was wrong, the tax has had an effect on BC road fuel use … but likely not the one expected by the promoters.
w.
PS—you may recall that up top, the promoters extolled the drop in gasoline used for road fuel in British Columbia … why didn’t I find that result? Why do I show an increase?
Well, it’s because I show all the highway fuel used, not just gasoline. And although there was a small decrease in gasoline use in BC, there was a larger increase in diesel use. And as a result, total BC road fuel use is not 7.3% less than the rest of Canada as they would lead you to believe by omitting the diesel figures—BC road fuel use has increased by 4.2% more than the rest of Canada. Like I say, it pays to be really suspicious with statements from folks like that, single issue fanatics.
PPS—In my previous post on the BC carbon-based energy tax, I said I wanted to discuss the (lack of) benefits, the costs, and the results of the tax. That post showed that the maximum possible benefit of the BC tax is a cooling of three thousandths of a degree (0.003°C) after fifty years. This post is about a curious result of the tax, the fact that BC highway fuel use (gas plus diesel) was dropping before the tax, and has increased since then by much more than the rest of Canada. The next post will discuss the costs of the tax, and why “revenue neutral” isn’t.
NOTE: This is one of a four-part series on the BC carbon-based energy tax. The parts are:
British Columbia, British Utopia
Fuel on the Highway in British Pre-Columbia
Why Revenue Neutral Isn’t, and Other Costs of the BC Tax
Figures don’t lie but liars figure! If people would only look at the real data, they would find out how much propaganda we are being fed each day. I for one are tired of the steady diet of BS! Carbon taxes don’t help reduce carbon use they simply are designed to redistribute wealth. Generally line the politicians pockets.
Liars plan and planners lie.
All for the sake of planning more plans so they have something to plan.
These politicians and bureaucrats just can’t help themselves.
And when they get occasionally confronted in their various committees by those who would dissent
the reaction is universal dismissal with the higher mission of contributing to the greater global good.
They need no demonstrations of local accomplishment. We know this to be the case.
They believe their efforts, when combined with the collective actions of others, will ultimately be shown to have been the appropriate thing to have done. What’s best.
However, they will never even approach any juncture when any measurement or assessment
will ever make that judgment.
Perpetual postponement is their friend.
Even these figures are understated quite substantially, because of the fact that many people fill up in the US once a week, with a Nexus pass there is no delay at the border, so I will fill up with 100 liters of high test saving $35 to $50 at least, combine this with a bottle of duty free wine and some groceries and you are saving serious money! Bellingham Washington residents are quite concerned at the number of Canadians who are doing this ( its Chamber of Commerce and Costco iaren’t!)
Good on ya Willis. I am a resident of the People’s Republic of British Columbia, and can certainly confirm that this carbon tax has been a complete and utter boondoggle. The most absurd bit about it is that schools and hospitals have to pay the government exorbitant $$ to offset their carbon consumption – basically, take away money from health care and education and toss it into the green trough. Brilliant!
I see no merit or benefit in either the carbon tax or the reduction in motor fuel use.
The former rips off the taxpayer yet more (twice, first for the cost of the tax itself, and second, for the cost of administering it).
The latter would be indicative of a lower per capita and domestic product.
Both bad, not good; both failures, not successes
There is a big part of the picture missing. The BC population near the US crosses the boarder to purchase dairy products, booze, tobacco, and gasoline driven by high taxes in BC and low prices in US. In the early nineties, BC passes an ‘equalization” tax on goods returning to BC from the US which dampens boarder crossings and eases some laws such as not alcohol service on Sundays in anticipation of hosting the Worlds Fair. As BC continues it’s taxations on specific goods, this has had the effect of a continued market in the US for BC consumers. More so than other US Canada boarder crossing areas. Also, the 9-11-2001 tragedy had an effect on boarder crossings.
What we need and it is hard to get out of the data is the impact of the tax on the GDP for BC. As the recession impacted GDP at the same time as the tax, pulling apart the two events is not easy. What could be tracked is the change in BC GDP vs Canadian GDP. My guess is that increased fuel consumption in the Yukon is associated with increased economic activity. If the BC economy is recovering faster than provinces with less growth in fuel consumption, then this may explain the increased fuel use. Fuel cost is not a major part of the decision to drive. The need to get to work or deliver goods and services is important though. So you pay the price for fuel and move on. Your decision is simple. Only people with marginal income will drive less as fuel price increases. And then you have the choice of public transportation if it exists and if it goes where you need, or carpooling, or not going. If you job depends on it, you drive regardless of the cost.
Cute. I overuse the word. Perhaps “neat”, “tidy”, or “elegant”. Nicely focused on a well-formed proposition.
Thanks again.
Certain follow-up questions suggest themselves, such as, was the slight change in road fuel use caused by the down-turn in the economy? Did it occur in anticipation of the tax, then simply re-adjust as is common?
When attempting to correlate road use with economic times in Canada, you need to be careful. You also may need to look at immigration dynamics as well. Canada’s population tends to be more tightly clustered than in the US. There ‘s an interesting anecdotal observation I’ve noticed in the GTA (Toronto, C of U, MPBUI) and I’d expect this to be true in Vanc, not so much in Montreal: long time immigrants from South Asian and Caribbean cultures especially tend not to travel far in Canada outside of their home city. They will regularly head to the airport though. I started noticing this when talking to long time foreign origin colleagues; they didn’t know the common local geography, even though they’d lived here as much as a dozen years or more. Its not that they don’t travel, it’s that they don’t travel in-country. While there may be a correlation with the economy, the end figures may have other equally significant modifiers, Nonetheless, carbon tax on fuel still isn’t an answer other than for the elites who are in line to profit from it.
But then, BC isn’t called the Left Coast for nothing…
Willis, in addition, everyone living in BC near the border with Alberta will fill up his tank in Alberta. Also everybody from other provinces or countries, including tourists (last year my wife an I included) and especially truck drivers will do the same. You can see the long rows of cars and trucks just over the border in both directions. That also adds to the statistics…
Yet another perspicacious article, Willis.
@Mickeyj ~ “For gawd’s man. That’s almost $6.00/gal. Socialism ain’t cheap.”
Spare a thought for us poor blighters here in New Zealand, Mickey! We have an ETS in place – imposed by a supposedly conservative government – and and most of the people I speak to are unaware that they are paying 4 cents a litre (plus 5% of their power bill) in this government-run grand theft program.
Our petrol price has just gone up to a historic high for 91 octane to NZ$2.28 per litre. Therefore we are forking out US$6.81 per US gallon. Socialist Conservatism ain’t cheap, either!
$2.28 NZ$/litre
$1.80 US$/litre
3.79 litres/US gal.
$8.63 NZ$/US gal.
$6.81 US$/US gal.
I suspect if you looked at year to year sales results at US gas stations in relative proximity to the border you might also be able to find a measurable effect of tax.
The population of BC is 4.1 million. The population of the world is 7.1 trillion. Multiply that 0.001 or 0.003 by the appropriate ratio.
What the carbon tax in BC has shown is that a carbon tax is a workable way to reduce emissions
7.1 billion oops
“What the carbon tax in BC has shown is that
a carbon taxtheft is a workable way toreduce emissionsbloat government.”There. Fixed it for you.
The biggest emitter of CO2 in B.C. are the forests. It’s 600PPM under those canopies.
policycritic says:
July 12, 2013 at 10:37 am
The biggest emitter of CO2 in B.C. are the forests. It’s 600PPM under those canopies.
Finally, it is discovered that forestation begets forestation!
Steve Oregon says:
July 12, 2013 at 7:55 am
Cool, poetry I can read.
Vivian Krause ‘s broadcast on a local community TV in B.C. Uploaded last weekend. Broadcasts tonight, I think. She’s the one who uncovered via US tax returns that the Rockefellers bankrolled Bill McKibben from inception. She accuses large American charities of using environmental issues to save American oil for Americans and American investor profit. [Mod: you should homepage this over the weekend.]
eli rabbet: You miss the point entirely.
BC, with a carbon tax, has highway emissions growing faster than the rest of Canada without a tax.
BCs total emissions, even with a carbon tax, are being reduced less than the rest of Canada without a tax.
BCs carbon tax is doing nothing for emissions. Ergo, it is not affecting global temps, except possibly increasing them.
Dr. Bob says:
July 12, 2013 at 9:16 am
We’re nothing if not a full service website … Statcan has all the data.
w.
Willis, Because the tax was instituted in 2008, I looked at the percentage change from that time.
When in 2008 was the tax instituted? Unless the tax was instituted in December 2008, I’m not sure I would have normalized on the 2008 numbers. Using 2007 might have been a better base year. Particularly if the tax was instituted in the first quarter of 2008.
Another question, when was the tax passed? There might have been an anticipation effect going on.
Eye-balling Fig. 3, if you normalized on 2007, the visual impact of the change to BC looks quite substantial and longer lasting.
Also, I would like to see Alberta in a more distinctive color; it’s confused with Nova Scotia. The increase in oil use from shale-gas development ought to be seen in Alberta. Do we see a significant rise in Saskatchewan? Is that from energy development?
Eli Rabett says:
July 12, 2013 at 10:23 am
Seven point one trillion people on earth? Send the rabbit back to school, he’s embarrassing himself again …
w
Eli Rabett says:
July 12, 2013 at 10:23 an
Yeah, and “carbon tax oops” as well …
w.
Stephen Rasey says:
July 12, 2013 at 11:26 am
Since BC highway fuel use was dropping faster before the tax, if you normalize on 2004 or 2005 or 2006, you get a big drop before the tax. Same with 2007, just smaller.
But we’re not interested (or not as much) in the drop before the tax was implemented, we’re looking at the rise after it was implemented.
In any case, the tax was implemented in mid-year 2008, so centering anywhere but 2008 is special pleading. We want to compare the “before” and “after” snapshots …
w.