Guest Post by Willis Eschenbach
Inspired (as I often am) by either the insights or the foolishness of a guest post at Judith Curry’s always-provocative blog, I decided to take a look at the relationship between fuel price and miles driven. My inspiration came from my amusement at the guest author’s use of the following graph to establish a relationship between fuel cost and how much people use their cars. I think a relationship exists, but the graph used by the author doesn’t show it. Figure 1 shows that graph:
 Figure 1. Per capita fuel use, compared to the fuel price, for the OECD countries. SOURCE
Now, it certainly looks like there’s a clear relationship there, but that’s an illusion. My objection to the graph was, the countries divide into two groups. On the bottom right you have the European OECD countries, plus Japan. Plus one fish.
On the top left, you have the US, Australia, Canada, and New Zealand. What’s not to like?
Well, ignoring fuel price for the moment, who would you think would drive more miles—a citizen of the US, or a citizen of Japan? An Aussie, or a Belgian? A Canadian, or an Italian? So all the guest author has shown in that graph is that the folks in large countries, with miles and miles between cities, drive more than Europeans and Japanese.
But of course, I couldn’t leave it there, so I linked to the following lovely graph of automobile use in the US that I ran across during my research. It shows, year by year since 1956, how many miles Americans have driven, and what the gas price was during that year.
 Figure 2. Miles driven compared to the fuel price. Click to embiggen. SOURCE
Now that shows some very interesting patterns. The main oddity I noticed is that there is what might be termed a price shock effect—in the year of a big jump in prices, for example 1974, the mileage driven drops compared to the previous year. But then look what happens from 1974 to 1978 … the price stays stable, but the number of miles driven each year goes up steadily, without reversal.
But of course, I couldn’t leave it there. I digitized the data, to see what kind of relationships I could understand and reveal through further analysis. And as usual, I was surprised by what I found.
First, taking the data as it is given, there is no statistically significant relationship between the two variables, pump price and miles driven. The R2 is only 0.03. (“R2” is a measure of the relationship between two datasets, where an R2 of 1.0 indicates a perfectly linear relationship between the two, and an R2 of 0.00 indicates no relationship. So an R2 of 0.03 is … well … pathetic. So as far as a direct relationship between prices and miles driven, not happening.
Once I saw that, I wondered, well, what if I include a temporal trend in the linear regression? The way that I usually do that is simply to include the date as a variable. And to my surprise, the R2 went from 0.03 up to 0.98 … Figure 3 shows an emulation (multiple linear regression result) of the number of miles that Americans drive, versus the value estimated based on year and pump price.
 Figure 3. The emulation is a multiple linear regression, using the year and the pump price as independent variables, and the actual average miles driven by Americans as the dependent variable. R2 = 0.98
Dang, sez I … that’s pretty impressive.
But of course, I couldn’t leave it there. A fixed annual increment, a simple trend like I used, is just a way to understand the data. It’s not an explanation involving some plausible mechanism. And more to the point, I also didn’t like those two years up at the top right of Figure 3, which are 2009 and 2010. In those years, Americans drove about a thousand miles less than expected. So I though about why that might be, and even a bear of little brain would go “global financial meltdown, duh”. And that made sense overall as well, because how far I drive doesn’t just depend on the pump price. It also depends in part on how much money I have in my jeans. When I’m flush I drive more, and when times get hard, I drive less regardless of the price of gas.
So I thought that instead of using the year, I’d try using the per-capita GDP as the second independent variable. Figure 4 shows those results.
 Figure 4. The emulation is a multiple linear regression, using the real per capita GDP and the pump price as independent variables, and the actual average miles driven by Americans as the dependent variable. R^2 = 0.98 GDP SOURCE
Yowzah! Now that’s what I call shaving with Occam’s razor. It turns out that pump price and per capita GDP do an excellent job of estimating the number of miles driven, with very little error.
So, what does the magic equation that gives us the excellent results shown in Figure 4 say about the relationship between miles driven on the one hand, and gas price and per capita GDP on the other?
Well, it says that for every twenty-five-cent increase in the pump price of gas, Americans drive about a hundred miles less. Gas price goes up, miles driven go down. Makes sense.
And it says that for every $430 increase in per capita GDP, Americans drive about a hundred miles more. Wealth goes up, miles driven goes up. Also makes sense.
Now, the “carbon taxes” I’ve seen discussed are on the order of $20-$30 per tonne of CO2. And by coincidence, $28 per tonne of CO2 emitted is equal to twenty-five cents per gallon of gasoline. So if a $28/tonne carbon tax is imposed on gasoline, how much less might Americans drive?
Well … a hundred miles less … wow, such a stupendous gain, be still, my beating heart …
And how much actual change in our driving habits is a hundred miles less per year?
Well … since Americans drive about 10,000 miles per year, it’s a gigantic, massive reduction in miles driven of one percent.
And that, dear friends, is all the bang you get for your twenty-five-cent per gallon carbon based energy tax. A one percent reduction in miles driven. One freaking percent, and they want to impoverish the poor for that? Grrrr ….
So … what does this mean for the debate on carbon-based energy taxes?
First, it means that in the American situation, there is no way that the benefits of energy taxes are worth the cost. Why? Because the effect of a typical CO2-based energy tax on miles driven is minuscule, only a 1% reduction for a $28 per tonne of CO2 energy tax.
Next, a very slight increase in per capita GDP will nullify the energy tax entirely. Also by coincidence, it turns out that if the current per capita GDP goes up by about 1% (~$430), that will increase the mileage driven by 100 miles … so a 1% increase in per capita GDP will completely nullify a $28 per tonne of CO2 energy tax. And the GDP goes up by one percent all the time …
Next, it means that in order to have more than a one-year effect, the tax will have to continually rise.
The problem with a carbon based energy tax can be seen by thinking back to Figure 2, where I noted the “shock effect”, and how after the slight reduction in miles driven as a result of the 1974 big jump in pump price, after that one-year reduction the miles driven went right back to increasing year after year, with no change in the gas price.
So a one-time jump in the price will make little difference, just a one-year reduction in the miles driven. But by the next year or two, assuming that the per-capita GDP continues to rise as it has in the past, the miles driven will be rising again.
Next, it means that a carbon-based gasoline tax is wildly regressive. To see why, let me start with a slight digression, by bringing in a concept from accounting, that of “fixed”, “variable”, and “semi-variable” costs.
Fixed costs are those costs you can’t do anything about. The amounts are fixed, you can’t reduce them, you just have to pay them.. Maybe rent. Taxes.
Variable costs are costs that are entirely optional. Think maybe eating at restaurants. You don’t have to spend a penny on that if you don’t want to.
Semi-variable costs are costs that you can change, but you can’t eliminate entirely. These would be things like food costs. You can run them up or down, but you can’t eliminate them.
Now, think about the corresponding concepts as applied to the subject at hand—fixed, variable, and semi-variable miles driven.
Fixed miles are things like a commute to work. Short of changing your job or your residence, you can’t change that. You just rack up those miles every year.
Variable miles are things on the order of visiting Grandma in Arizona. You love to do it, but you don’t have to go.
Semi-variable miles are things like going to the post office to get your mail. You can cut the trips down, but not to zero.
What this graph shows me is that any energy tax on gasoline will hit the hardest on the poorest, the people who mostly use their car to get to work. The problem is not just that more of the wages of the poor go to energy, although that is also a problem.
But in addition to the higher percentage of their wages going to energy, the majority of their miles are fixed miles, so they can’t cut back on them. They have to drive them, so they have to pay the tax.
For the wealthy, on the other hand, lots of their miles driven are variable or semi-variable, so they can just scale down a bit. The energy tax means nothing to them. But for the poor, it can be a budget-buster.
This is one of the many reason why energy taxes are so regressive—because for the poor, fixed costs for everything squeeze them all the time, not just fixed fuel costs but also the other bills they have to pay every month. So when energy prices go up, Al Gore and James Hansen just cut back on visiting the grandchildren they love to talk about, no problem for them.
But the single mom whose gas budget barely covers getting to work, she can’t cut back on her gas use, it’s already cut to the bone. So when she pays the energy tax, she is forced to cut back on something for either the kids or herself.
And all of that for a pathetic 1% reduction in miles driven. That’s criminal.
Now please, folks, don’t insult my intelligence by claiming that it’s OK to harm the poor because of that well-worn fantasy, the fabulous claim that wealth redistribution will make it all OK. It won’t. Anyone who believes it will make it all OK has not spent enough time around government programs.
To start with, even the best-intentioned programs only reach a percentage of those most affected. Next, the poorer that people are, the less likely they are to hear about such programs. Think people living in apartments versus people living in their cars. Next, the paperwork required is all too often complex, confusing, and intrusive. Next, many of the poorest people are mistrustful of government. Also, immigrants are often equally fearful of government, and many don’t speak the language. Next, the people who end up getting the most benefits are often not those who suffered the most losses. Next, administering such a program requires a large expensive workforce of bureaucrats and paper pushers to make it function. And of course, they’re all Union, can’t be fired, plus we’ll be stuck paying these pluted bloatocrats their megabucks in retirement money ’til they shuffle off to a warmer place … and I’m not thinking Florida. Next, as with any government program, waste will consume more than you imagine. Think IRS conferences in Las Vegas and thousand dollar hammers. Next, parasitic rent-seekers like lawyers and consultants will be circling the honey-pot and making off with some of that good honey. And finally, there’s never been a government program that people didn’t scam, game, and cheat, so somewhere between a little and a lot of money will simply be stolen.
So no, wealth distribution will only make things worse, or on the best day with a following wind it might “break even” by taking from one bunch of the poor and giving to another bunch … and meanwhile the people at the bottom of the economic pile are hit the hardest. And whether you are a conservative or a liberal, that should appall you.
And finally … we’re going to create all that pain and create a giant bureaucracy and waste piles of money for a crappy 1% reduction in miles driven, a temporary reduction that will be wiped out by the next 1% increase in per capita GDP?
Really? That’s the brilliant plan? Screw the poor and the economy for a 1% reduction in miles driven?
Spare me. That’s more than foolish, that’s a crime against the indigent and everyone else in the country. Almost any other conceivable response to the imagined horrors of CO2 would be preferable. Taxes on energy are destructive and damaging to individuals, to businesses, to the environment, to the economy, and more than anything to the poor, and to turn it from mindless idiocy to criminal tragedy, there is nothing to show for it at the end of the day but a temporary 1% reduction in miles driven—from an energy tax, there’s no lasting gain, only lasting pain.
w.
DATA: The spreadsheet with the data and graphs is here.
[UPDATE] I just wondered, how much will the $28 per tonne of CO2 gasoline tax cost per year? Average fuel economy of the US fleet, cars and trucks, is about twenty mpg. Average person drives ten thousand miles, at twenty mpg that’s five hundred gallons. The tax at twenty-five cents per gallon on five hundred gallons is $125 per year.
In response to that tax, we can expect people to cut fuel use by 1%, or 5 gallons per year. Gas is around four bucks a gallon, so that’s $20 worth.
So the plan is to charge the average driver $125 per year in gas tax, and in response to that he’ll use $20 less gas, reducing his bill at the pump from $2,000 per year to $1,980 per year and cutting his CO2 emissions by a whacking great 1% … who thinks these plans up, and how can we catch them and stop them?
[UPDATE 2] I also got to wondering, just how much CO2 would a $28 per tonne of CO2 applied to gasoline consumption actually save? There’s 8.9 kg (19.6 pounds) of CO2 in a gallon of gasoline. Crazy but true, it’s the extra weight of the oxygen. So we’d be saving one whole percent of that, or .089 kg per gallon. Multiply that by the number of gallons of gasoline burned in the US, about 134E+9 gallons, and we end up with 0.01 gigatonnes (billion metric tonnes, E+9 tonnes) of CO2 saved.
And compared to a hundredth of a gigatonne, how large are the global CO2 emissions? Well, it’s about 9 gigatonnes of carbon C emitted per year, so as CO2 the mass is (16 + 16 + 12) / 12 of that to allow for the extra weight of the oxygen, or 33 gigatonnes of CO2 per year.
And the $28 carbon based energy tax would reduce that by 0.01 gigatonnes of CO2, which is a reduction of three hundredths of one percent (0.03%) … folks, have we truly gone so mad that such a trivial gain, three hundredth of one percent reduction in CO2 emissions, so small as to be absolutely unmeasurable, is used to justify this crazy tax?
Hello Willis. From your post it appears your conclusion is incorrect – in particular, your statement:
“…we’re going to create all that pain and create a giant bureaucracy and waste piles of money for a crappy 1% reduction in miles driven, a temporary reduction that will be wiped out by the next 1% increase in per capita GDP?”
Introduction of any initiative such as a tax (and we’ll focus on a carbon tax in this instance) is analysed by comparing the growth path of “miles travelled” without a carbon tax with the growth path with a carbon tax. What happens is that the growth path without a carbon tax continues to increase pretty much as it has in the past (noting that this accounts for things such as wealth increases and a range of other factors that impact on miles travelled). The growth path with a carbon tax is ALWAYS going to be less than the growth path without a carbon tax. This is because (as you’ve identified) it increases the cost of travel.
Therefore, there is a PERMANENT reduction in miles travelled (as compared to what would have been the case without a carbon tax). Over a period of 10-20 years the growth paths diverge quite a lot so the impact at the end of 10 years is quite significant (a sort of copm
poinding of the 1% reduction).
Best regards
Mladen
TskTsk: I suppose everyone on this forum is aware of Monckton’s calculations of the cost effectiveness of Australia’s carbon tax?
http://joannenova.com.au/2011/07/gillards-tax-on-carbon-pollution-the-facts/
Like I have been saying; everything about “climate change” policy AND “smart growth” urban planning policy, is really about ideological objectives for which any pretext will do. Actual outcomes, and objective analysis, is irrelevant.
It is more of a new quasi-religion than anything else, and people like us are Galileo.
In fact it is hard to blame religion per se for its past irrationalities, because humanity always seems to have some completely false system, whether religion or politics, on which the ordering of society by megalomaniacs, is based. Was Communism a religion, or politics? Was the Inquisition religion, or politics? It is hard to tell where one ends and the other begins.
One thing I believe, is that it is rare for a megalomaniac mind to also be one that understands basic economics, or as the philosophers called it before it was economics, “dialectics”. That is, “how things work and act and react on each other in the real world”.
I am pretty much new to this forum; my specialty is urban and transport economics. But I am impressed with the economic intuitions displayed by the CAGW skeptics on here – there seems to be a certain inherent soundness of mind in these people.
wodehouselee says: @ur momisugly July 11, 2013 at 5:50 pm
….One thing I believe, is that it is rare for a megalomaniac mind to also be one that understands basic economics, or as the philosophers called it before it was economics, “dialectics”. That is, “how things work and act and react on each other in the real world”…..
>>>>>>>>>>>>>>>>>>>>>
From what I have seen, read and experienced first hand, the megalomaniac mind does not see other humans as anything other than ‘objects’ there for their use. If you are not ‘useful’ to them at best they will drop you like a stone or more typically retaliate because you would not be their slave. They will protect what is ‘theirs’ including other humans but it is from a sense of ownership not from a sense of loyalty or affection.
These people can be quite charming because they know charm is useful for manipulating others. If intelligent they can climb high in corporations, academia, or politics. Lying is just a tool and concern for others is completely outside their understanding and seen as a weakness to be exploited. Power and money are their goals and unfortunately they are often well qualified to reach those goals. Their lack of human warmth makes them very very good at climbing the social/political/corporate ladder and reaching high levels of power. They will often surround themselves with like minded individuals because those are the type they understand. Democide – DEATH BY GOVERNMENT is much too often the result.
Todd Litman says:
July 11, 2013 at 7:25 am
Thanks for your reply, Todd.
You cite a variety of factors such as “demographic and economic factors” and “age, income, employment rates, and the quality of transportation options” and “demographic, economic and geographic trends during the last quarter of the twentieth century which stimulate automobile travel demand” that you claim are important. However, if they truly made a difference, then it would not be possible to estimate the driving habits of Americans with a simple formula using only two variables.
I have no problem with your analyzing all of those other variables. My point is that my analysis clearly shows that you DON’T need to consider a single one of those factors to make an estimate of American driving habits. You can make a very, very accurate estimate by just considering the fuel price and the American per capita GDP.
Given that success with a very simple formula, Occams razor suggests that considering “demographic, economic and geographic trends during the last quarter of the twentieth century” may be interesting, but it is an un-necessary multiplication of causes.
Finally, you say that:
I’m sorry, but that claim is simply not true. Here’s the actual data, as shown in Figure 2:
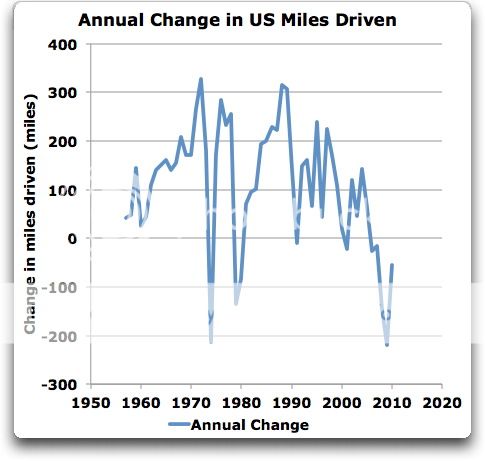
I’d use a lot of different words to describe that historical record, but “nearly constant year-to-year growth” is not among them …
w.
I was surprised that it really is so simple, but accepting it doesn’t turn my world upside down. Obviously the fuel price and GDP per capita is the mechanism by which most of the “demographic” (and other) effects are transmitted into VMT.
It would be possible for another nation with higher petrol prices and lower GDP per capita than the USA, to have very similar demographic factors that were NOT being transmitted into VMT.
For example, the following nations have a higher percentage of women in the workforce than the USA: by Litman’s theory, should this mean a more pronounced VMT effect in those nations?
Angola
Azerbaijan
Benin
Butan
Bolivia
Botswana
It would take too long to go right through the alphabet. Point made, I think?
I think it quite possible for “saturation” to be reached in VMT and the response to rising GDP per capita and falling petrol prices to weaken – but if this point has not been reached yet even in the USA, this finding does not turn my world upside down.
I also agree wholeheartedly with Eschenbach’s point about the absurdly cost-inefficient nature of most of the politicians favourite policy responses to “CAGW” so far, which all goes to show how insincere and/or ignorance-driven the whole racket is anyway. Attempting to change urban form and increase public transport mode share is probably the most absurdly cost-ineffective approach of the lot. Outside of Manhattan, most public transport systems in the USA are less efficient by all measures, than cars with a single occupant. Chicago and Washington are “marginal”. All the tokenist “investments” in public transport in cities like LA and Boston and Atlanta are not just a waste of money, they are a fraudulent waste of money, the actual outcomes being the opposite of the alleged basis for the “investments”.
Furthermore, the zero sum capital gains reaped by well-connected owners of large property portfolios who are endowed with powers of gouging “economic rent” by rigid “urban plans”, are considerable, and are probably a major underlying vested interest driving the whole racket. As I have been saying, there is nowhere that better illustrates all this than the UK’s cities, which have been in the grip of the “planners” for several decades – and the rents charged in CBD’s in nearly ALL UK cities regardless of how small or weak economically, are higher than those charged in Manhattan – the USA’s highest. Even as far back as 1984, Cheshire and Mills suggested that the difference in CBD rents between comparable cities in the UK and USA apart from their planning systems, was a factor of 325 – three hundred and twenty-five. The difference is almost certainly much larger now.
Of course US cities adopting similar planning approaches are tending to converge on the UK cities and diverge from the still relatively un-constrained US cities.
Hmmmmmmmmm? Move along, nothing to see here?
Joe Born says:
July 11, 2013 at 5:39 am
Say what? When you raise the price on caviar, Tesla automobiles, and diamonds, it doesn’t affect the poor more than the wealthy. The same is true about the cost of private schools, orthodontistry, and summer camps, not to mention Manolo Blahnik pumps and ice-skating lessons and car-rental rates … in fact there are hundreds and hundreds of things whose price could triple without affecting the poor in the slightest. They hit the well-off the hardest, and barely touch the poor.
Energy, on the other hand, is the other way around. It hits the poor the hardest, because we all need heat and transportation. For the rich, most of their money is spent on optional purchases. For the poor, a much larger percentage is spent on energy.
So when the price of luxury items rises, it affects the rich more than the poor, more of their money is spent on that.
And when the price of energy rises, it affects the poor more than the rich, more of their money is spent on that.
As a result, your claim that it’s all equal, that “almost any time you raise a price” it affects the poor more, is simply not true. Any price for any given thing affects those that use more of that thing … and for the poor, that’s energy.
Best regards, always good to hear from you,
w.
Todd Litman says:
July 11, 2013 at 7:25 am
I still don’t understand this. I use the average elasticity over the last fifty years. How is that SHORT RUN elasticity?
Also, as I pointed out, since we know the average fuel economy of the US fleet, calculating miles drive is equal to calculating TOTAL FUEL CONSUMPTION.
Effectiveness? The Obama climate plan is supposed to cool the earth by two hundredths of a degree by 2050 … at a cost of billions, even if you could double the effectiveness it’s still a really, really crappy deal. You’re just putting a tutu on a pig—when the maximum possible benefit is hundredths of a degree in fifty years, who cares how it’s dressed?
But don’t worry that I haven’t really discussed this issue. I’m dissecting the BC carbon-based energy tax, and that issue is on the list … and I predict you likely won’t care for what I have to say.
w.
Mladen says:
July 11, 2013 at 5:39 pm
Thanks, Mladen. You seem to be under the impression that a reduction in miles driven is “significant” … see my post on the BC carbon-based energy tax to see how significant it might be. The short answer is … it’s not.
w.
Willis writes “I’d use a lot of different words to describe that historical record, but “nearly constant year-to-year growth” is not among them …”
But that’s because you’re misinterpreting him. He’s not saying the *rate* of growth was constant which is what you want him to be saying, he’s saying *growth* is constant and that is clearly shown in your graph. Most points by far are above the zero line.
Wodehouselee,
There is one light rail system that NY in fares per mile of track – Houston. Granted, almost all of the travel is between a single very large parking lot and the Med Center, but still. Light rail can be effective if it does a very specific thing, and moving the ~60k or so visitors out of the very crowded Med Center to an enormous parking lot ~2-3 miles away and located on a major interstate is one of the areas it works. My commute was almost 20 minutes less taking the rail the last few miles.
Let’s just hope that the leaders of Houston don’t take this as an excuse to build a rail system anywhere else in the city.
Very good point, I like it. I’ll take that on board.