The Guardian has a new blog called Climate Consensus – The 97%. The two primary authors are to be Dana Nuccitelli, a regular contributor at SkepticalScience, and John Abraham, Associate Professor at the University of St. Thomas.
Dana Nuccitelli’s first post at his new blog at The Guardian is titled “Why is Reuters puzzled by global warming’s acceleration?” His article is subtitled, “‘Climate scientists struggle to explain warming slowdown,’ said Reuters. But warming is speeding up, and scientists can explain it.” Nuccitelli’s first post at The Guardian is reminiscent of his posts at SkepticalScience—that is, it’s misleading and full of misinformation.
Data contradict the points Dana Nuccitelli is trying to make. In this post, we’ll briefly discuss ocean heat content data, how Mother Nature—not manmade greenhouse gases—creates warm water during La Niña events, how she releases that naturally created warm water during El Niño events and redistributes it around the oceans afterwards, and we’ll discuss Dana Nuccitelli’s misleading animation called “The Escalator”. Data explains how and why the vast majority of global warming occurred naturally…when it warmed.
OCEAN HEAT CONTENT
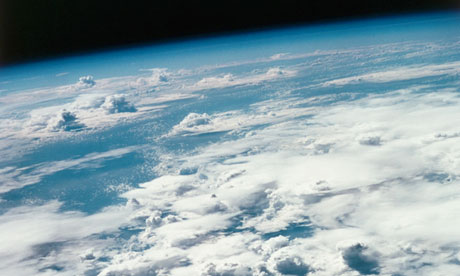
Nuccitelli begins his post with a picture from space of the Pacific Ocean with the caption:
Oceans, such as the Pacific pictured here from space, are absorbing much of the warming the planet is currently experiencing. NASA/ Roger Ressmeyer/ Corbis
Then the first sentence of his post reads:
The rate of heat building up on Earth over the past decade is equivalent to detonating about 4 Hiroshima atomic bombs per second.
Based on Nuccitelli’s opening illustration and statement, we should expect the ocean heat content of the Pacific Ocean to be showing a monumental amount of warming over the past 10 years. But, as shown in Figure 1, the ocean heat content data for the Pacific Ocean from pole to pole (90S-90N, 120E-80W) shows cooling. Right from the get go, data disagrees with Nuccitelli’s representations.

Figure 1
The NODC’s Ocean Heat Content data used in Figure 1 (and in the other ocean heat content graphs in this post) is the only regularly updated dataset of its kind that’s available to the public on a gridded basis through the KNMI Climate Explorer. There, users can select the coordinates of the data they desire. The NODC’s ocean heat content data represents the change in the heat stored in the oceans to depths of 700 meters or about 2300 feet.
The article in The Guardian also fails to describe all of the problems associated with ocean heat content data. Before the ARGO floats were deployed starting in the early 2000s, the temperature observations at depth were so sparse that the data has to be taken with more than a grain of salt, especially when dealing with the data below 700 meters. And the ARGO-era ocean heat content data has been adjusted so many times it’s difficult to keep track of all of them. Many of the problems with ocean heat content data were described in the blog post Is Ocean Heat Content Data All It’s Stacked Up to Be? It’s a long post, I’ll grant you that, but if you’re interested in ocean heat content data, it’s worth a read. Bottom line: even with all of the adjustments to the ARGO-era that added warming to the ocean heat content data, the Pacific data shows cooling over the past 10 years—contrary to what Dana Nuccitelli implied with his opening statement and illustration.
HOW LA NIÑAS CREATE WARM WATER IN THE TROPICAL PACIFIC
Nuccitelli continues:
We often hear from the media that the (surface air) warming has slowed or paused over the past 15 years. This isn’t a puzzle; climate scientists are well aware of several contributing factors, as a recent Reuters article – “Climate scientists struggle to explain warming slowdown” – eventually discussed. The accelerated warming of the oceans is likely the main contributor.
During years with La Niña events, more heat is transferred to the oceans, and surface temperatures are relatively cool as a result. The opposite is true during El Niño years. During the 1990s, there were more El Niño than La Niña events, which resulted in more surface air warming. One of the strongest El Niño events of the century happened in 1998, which not coincidentally was 15 years ago.
Dana fails to explain that Mother Nature, not greenhouse gases, creates ocean heat in the tropical Pacific–where El Niño and La Niña events take place. During La Niña events, the trade winds in the tropical Pacific are stronger. The stronger trade winds reduce cloud cover, which, in turn, allows more sunlight (also known as penetrating solar radiation because it penetrates into the oceans) to warm it. That’s why the long-term warming of the ocean heat content for the tropical Pacific was plainly caused by the 3-year La Niña events of 1954-57, 1973-76 and 1998-01, and during the freakish 1995/96 La Niña. Keep in mind that the 1995/96 La Nina provided the fuel for the 1997/98 El Niño, which was discussed by Nuccitelli. See Figure 2.

Figure 2
To further illustrate the role of La Niñas in the warming of the tropical Pacific, Figure 3, the ocean heat content there would have cooled since the 1950s without the 1973-76 and 1995/96 La Niña events.

Figure 3
Back to Nuccitelli’s statement:
During years with La Niña events, more heat is transferred to the oceans, and surface temperatures are relatively cool as a result. The opposite is true during El Niño years. During the 1990s, there were more El Niño than La Niña events, which resulted in more surface air warming.
That discussion is also misleading for other reasons. Sea surface temperatures (not ocean heat content) in the tropical Pacific cool in response to La Niña events because more cool waters than normal are being upwelled from below the surface of the eastern equatorial Pacific. Marine air temperatures and lower troposphere temperatures cool in response because the tropical Pacific is releasing less heat than normal through evaporation as a result of the cooler surface waters. (That cooler upwelled water is then warmed by the La Niña-caused additional sunlight as it travels from east to west across the tropical Pacific, and it collects in an area east of Indonesia called the west Pacific Warm Pool, where it warms the ocean heat content of the tropical Pacific.)
Note: The sea surface temperature data presented in this post is NOAA’s best: the Optimum Interpolation Sea Surface Temperature data, version 2, also known as Reynolds OI.v2. It’s a combination of observations from satellites, buoys and ship inlets. As noted in the link:
The optimum interpolation (OI) sea surface temperature (SST) analysis is produced weekly on a one-degree grid. The analysis uses in situ and satellite SST’s plus SST’s simulated by sea-ice cover. Before the analysis is computed, the satellite data is adjusted for biases using the method of Reynolds (1988) and Reynolds and Marsico (1993).
EL NIÑO EVENTS
An El Niño event releases that La Niña-created warm water from below the surface of the west Pacific Warm Pool, and an El Niño spreads that warm water eastward across the eastern tropical Pacific. There was so much warm water released by the 1997/98 El Niño that the sea surface temperatures for the entire East Pacific Ocean (from pole to pole or the coordinates of 90S-90N, 180-80W) temporarily warmed 0.5 to 0.6 deg C. See Figure 4. The East Pacific Ocean with those coordinates represents about 33% of the surface of the global oceans, so that was a monumental amount of naturally created warm water that was released by the 1997/98 El Niño. Notice also that the East Pacific sea surface temperature data hasn’t warmed over the 31 years of that dataset, based on the linear trend.

Figure 4
All of that naturally created warm water that’s now on the surface doesn’t simply disappear after a strong El Niño. Ocean currents redistribute that leftover warm water to adjoining ocean basins (which prevents the sea surface temperatures for remote areas, like the North Atlantic, from cooling proportionally during the trailing La Niña). The leftover warm water (and its counteracting effects on the trailing La Niña) is why the sea surface temperatures for the Atlantic, Indian and West Pacific Oceans warmed in a very obvious upward step of about 0.19 deg C, Figure 5, in response to the 1997/98 El Niño. Note that there was also a strong upward shift in response to the 1986/87/88 El Niño and a smaller step in response to the 2009/10 El Niño.

Figure 5
Without those El Niño events, the sea surface temperatures for the Atlantic, Indian and West Pacific Oceans would not have warmed since the early 1980s.
Nuccitelli was right with his statement, “During the 1990s, there were more El Niño than La Niña events, which resulted in more surface air warming.” But he failed to advise his readers:
1. that land surface air temperatures represent only 30% of the global surface temperature record,
2. that sea surface temperature data represent the other 70%,
3. that the satellite-era sea surface temperature data indicate sea surface temperatures warmed naturally in response to the naturally created warm water released from below the surface of the tropical Pacific during strong El Niños, and
4. that the warming of land surface air temperatures is primarily a response to the warming of sea surface temperatures.
For more information, including a discussion of the natural warming of ocean heat content data, refer to my illustrated essay “The Manmade Global Warming Challenge” [42MB]. For even more information, there’s more detail in my ebook Who Turned on the Heat? which was introduced in the blog post here. It’s available in pdf form here for US$8.00.
THE ESCALATOR
Nuccitelli goes on to write:
Reuters didn’t connect the dots between these two articles, telling us one week that oceans help explain the surface warming slowdown, and the next week claiming the slowdown is puzzling climate scientists. However, these ‘slowdowns’ happen on a regular basis. You can find one every 5 to 10 years in the surface temperature data, as illustrated in a graphic I created nicknamed ‘The Escalator‘.
The escalator is included here as Animation 1.
Animation 1
The caption for “The Escalator” reads:
Average of NASA GISS, NOAA NCDC, and HadCRUT4 monthly global surface temperature anomalies from January 1970 through November 2012 (green) with linear trends applied to the timeframes Jan ’70 – Oct ’77, Apr ’77 – Dec ’86, Sep ’87 – Nov ’96, Jun ’97 – Dec ’02, and Nov ’02 – Nov ’12.
Let’s drop back to what Nuccitelli wrote earlier:
One of the strongest El Niño events of the century happened in 1998, which not coincidentally was 15 years ago.
When people say ‘no warming in 15 years’, they’re cherry picking the timeframe to begin in an abnormally hot year.
“The Escalator” by definition is an exercise in cherry picking. Let’s illustrate, with the same data used by Nuccitelli, how global surface temperatures actually warmed without cherry picking the time periods. We’ll simply highlight 3 naturally occurring events, and use them as start and end years for shorter-term data illustrations.
Figure 6 shows the global land surface air temperature plus sea surface temperature anomalies (average of GISS LOTI, HADCRUT4 and NCDC datasets, like The Escalator) before, during and after the 1997/98 El Niño. The data highlighted in red are for the official El Niño months of the 1997/98 El Niño from NOAA’s Oceanic NINO Index. There was little warming during the years leading up to the 1997/98 El Niño and in the years following it. I’ve included period-average temperatures in blue to help highlight that fact. The dip in 1991 and rebound in 1994 is associated with the explosive volcanic eruption of Mount Pinatubo. That cooling is a response to the decrease in penetrating solar radiation caused by the “shading” effects of aerosols spewed into the stratosphere by the explosive volcano—not from a decrease in manmade greenhouse gases. That aside, the vast majority of the warming during the period of March 1988 to February 2013 was caused by the monumental amount of naturally created warm water released from below the surface of the tropical Pacific by the 1997/98 El Niño and redistributed on the sea surface after it–warm water that was created during the 1995/96 La Niña.

Figure 6
You’re probably wondering why I started the graph in Figure 6 at March 1988. That’s the first month after NOAA’s official months for the 1986/87/88 El Niño. If we look at the global surface temperature anomalies from March 1977 to April 1997 (the month before the 1997/98 El Niño), Figure 7, we can see that the 1986/87/88 El Niño caused a similar upward shift in global surface temperatures. The upward steps in Figures 6 and 7 are blatantly obvious when we break the data down into logical shorter time periods before and after the strong El Niño events. (Note: There was also a very strong El Niño in 1982/83, but the eruption of El Chichon in 1982 counteracted the impact on global surface temperatures of all of the warm water it released.)

Figure 7
Now for the period before the 1986/87/88 El Niño: See Figure 8. I’ve started the graph 10 years before The Escalator to show how “flat” global temperatures were leading up to the upward step in global temperatures in 1976. That step is associated with the Pacific Climate Shift, when the sea surface temperatures of the East Pacific ocean suddenly shifted upwards. There are numerous peer-reviewed papers that attempt to explain that natural warming, many with different causes and effects. That shift coincides with the end of the 1973-76 La Niña, which created, as shown Figure 2, the initial warm water used by the trailing El Niño events until the 1995/96 La Niña. Regardless of the cause, there was an obvious upward shift in global surface temperatures in 1976. I’ve highlighted in red the official months of the 1976/77 El Niño as a proxy for the climate shift. The upward step is pretty tough to miss. And again, I’ve used period average temperatures (in blue) before and after the 1976 climate shift to help illustrate its impact on global surface temperatures and to show how “flat” global temperatures were before and after that shift.

Figure 8
Now, if we merge all of the data from Figures 6 through 8, we have a more realistic view on how, when and why global surface temperatures warmed—a more realistic escalator. See Figure 9. There was no cherry picking involved, just a little common sense to highlight the primary causes of global warming since 1960.

Figure 9
CLOSING
Ocean heat content data for the Pacific Ocean contradicts Dana Nuccitelli’s opening statement and illustration. The ocean heat content data for the tropical Pacific show that Mother Nature is responsible for the fuel for El Niño events. Ocean Heat Content data and satellite-era sea surface temperature data also indicate the oceans warmed naturally, but you have to understand that ENSO works as a recharge-discharge oscillator (with La Niña as the recharge mode and El Niño as the discharge mode) to see Mother Nature’s handiwork. And as illustrated, Dana Nuccitelli’s Escalator is simply another way for global warming enthusiasts to hide how global temperatures actually warmed since 1976. In short, data contradicts Dana Nuccitelli’s first post at The Guardian’s new blog.
Feel free to furnish a link to this post at Dana Nuccitelli’s new home at The Guardian. The more the merrier. Unlike SkepticalScience, I don’t believe The Guardian has a track record of deleting comments that disagree with the hypothesis of human-induced global warming. And if Nuccitelli’s posts at The Guardian are similar to his posts at SkepticalScience, he’ll be presenting “The Escalator” again and again, so you can link this post to his future uses of The Escalator at The Guardian, too. And don’t forget the YouTube video On the SkepticalScience Video “Global Warming over the Last 16 Years” when he links that video from SkepticalScience.
@ur momisugly Bob Tisdale and dbstealey
It is OBVIOUS (to this non-scientist) that R. E. is either NOT a scientist or is doing an excellent job of pretending to not be a scientist. Unless R.E. is the victim of a personality disorder (distorting his judgment), then R.E. is almost certainly not his real name, for he has made an UTTER FOOL of himself. His argumentation is weak to the point of absurdity. Because I had read Nucc.’s article (reviewed by Tisdale), I could tell that R.E.’s “arguments” were specious. As I read steadily along above, the childishness of R.E.’s responses when juxtaposed with your cool, rational, reasoning was pitiful.
Until R.E. does his homework and reads the assigned reading, the professors should refuse to join R.E. in his personal B.S. session. His smirking, sophomoric, verbal gymnastics sound just like a 16-year-old boy trying to B.S. his way through an answer in 10 grade physics class because he didn’t do the reading the night before (all the while completely oblivious to what a fool he is making of himself). He does not deserve nor can he (due to his NOT WANTING TO LEARN) benefit from the patient, thorough, well-informed, personal tutoring so GENEROUSLY given by two expert scientists.
The rest of the class learned, though. And this kid, sitting in the back row, says, “Thanks Mr. Tisdale! Thanks Mr. Stealey!”
@ur momisuglyR.E. — You are a clever person. Apply all that intelligence to sincere LEARNING. Until then, you are wasting yours and everyone else’s time. Life is short. Spend it wisely. Yeah, I’m talking to you like you are my teenaged son. That is because: 1) I care (and I can tell the above scientists whose time you wasted do, too) about you as a human being; and 2) you are acting like a teenager. YOU CAN BE BETTER THAN THIS, R. E.! You have been given the gift of intelligence — don’t waste it!
If you were my son, I would end by telling you that I love you. Since you are a complete stranger, I’ll just end by saying: YOU ARE LOVED, for God loves you. Always.
@ur momisugly Janice
You’ve lost me completely!
@dbstealey: “Reich needs to step up and answer the question: why has the very large rise in CO2 not triggered an acceleration in global warming?”
This is the central question, well posited.
@Mike Jowsey
“@dbstealey: “Reich needs to step up and answer the question: why has the very large rise in CO2 not triggered an acceleration in global warming?”
This is the central question, well posited.”
In case you didn’t notice, that was the question that was addressed in Dana’s post! Hilarious discussions here!
The cartoonists lap dog turns out to have no bite and little bark , is anyone surprised .
If it was not for heavy moderation, and dam ‘scared facts ‘, he been taken to bits below the line even more than he was.
The Guardian has fully singed up to ‘the cause ‘ in the most extreme form and it will take the replacement of the whole of its environmental staff , with hopefully some that actual know about science, to change that.
Lost me as soon as I saw the title of the blog, was laughing too much.
Why do people assume there is “extra energy” in the system? Can anyone claim to know the baseline? No, the last 30 or 100 years are NOT a baseline. Where is the stable temperature given atmospheric pressure, gas composition, the area and salinity of the oceans, the orientation of the continents and how that affects ocean circulation, the current activity level of the sun, etc. etc. etc. WHAT IS IT? Nobody knows. If you think you know, then you’re wrong.
Seems to me the assumption of “extra energy” and some sort of mysterious “warming” is a sign of faulty logic. I’d estimate based on observation that the baseline is still slightly – perhaps less than 1K – warmer than current. I’d say it’s a good bet that the ENSO cycle and the rising steps we’re seeing are the mechanism for the planet to move toward the baseline, as has been happening for 150 years. That’s a hypothesis, and it’s mine. I can’t prove it. Can you disprove it? First you’d have to come up with a CREDIBLE cause for the LIA. Got one?
In the same way, reduced Arctic ice coverage is NOT a tragedy, or even a sign of warming. It’s part of the planet’s thermostat. Arctic ice melt scares have happened before, historically.
But overall, it really doesn’t matter. Because once the cooling comes back the prevailing “theory” will be that humans are the cause, and there will be panic and cries to “do something”. Oh… that’s not a hypothesis, that’s a theory. Or might even be a Law now. What the heck, we’re not even in “Science” territory anymore, it’s all sociology.
Anybody believing the ARGO transition is correct?
http://climexp.knmi.nl/data/inodc_heat700_0-360E_-23.4-23.4N_na.png
Dana has been and continues to be in way over his head. He has the academic credentials but falls short in the common sense department. Another example of our educational system whereby students learn how to successfully take exams but are lacking when it comes to practical application.
Dana can easily be made a fool of. He just spouts blinkered rubbish for the consumption of the ever-dwindling labotomised AGW flock. The guardian is a rubbish newspaper, but , having said that there is not a good newspaper left in the UK. They are all full of nonsense. If anything the Guardian is worse than SKS because they pretend to moderate moderately…. which of course they do not. Dana bestest hissy fit with me was when I pointed out the % of the world’s glaciers that has been monitored in sufficient detail to make reasonably accurate extrapolations…. He of course was quickly in a muddle and deleted the debate as soon as I referenced a world renowned expert and peer reviewed material etc etc. Dana is scared of science, which is why he is constant denial of real science. You will get more tight science from Dana Scully……
Jim D says: “Looks like a reading comprehension issue. The Pacific was only mentioned as pictured here because that was the picture, which could equally have been the Atlantic.”
Apparently you only looked at the picture, Jim D, and did not read the accompanying caption, which was very specific with it’s intent, especially when coupled with the opening sentence of the post. That’s why I quoted both.
But, if you’d prefer to see a graph of the ocean heat content for the Atlantic, it’s cooling too–about twice as fast as the Pacific:
http://oi40.tinypic.com/ehs3p.jpg
Seth says: “I wonder why the global ocean heat content under 700m is increasing when the pacific (as per Bob’s figure 1) is decreasing.
http://www.nodc.noaa.gov/OC5/3M_HEAT_CONTENT/”
Because the graphs you linked started in 1955 and are for the global oceans, while the topic at hand is the Pacific over the last 10 years.
Seth says: “It’s worth pointing out that the heat content 0-2000m shows the ocean heating is not slowed.”
Apparently, the topic of ocean heat content is new to you, Seth. That’s why I provided links to some of my earlier posts on this this topic in the text of my post. Here’s one again, Seth:
http://bobtisdale.wordpress.com/2013/03/11/is-ocean-heat-content-data-all-its-stacked-up-to-be/
The raw ARGO data for 0-2000 meters shows a flattening during the ARGO era for the depths of 0-2000 meters.
http://bobtisdale.files.wordpress.com/2013/03/30-ukmo-ohc-0-2000m-v-models-to-750m.png
Then it’s corrected, but it still shows a flattening with the annual data:
http://bobtisdale.files.wordpress.com/2013/03/figure-1.png
So the NODC disappears their 0-2000m data on an annual basis, breaks out their magic wand, and creates “pentadal” data, which not only reduces the flattening but also increases the overall long-term trend by 36%.
http://bobtisdale.files.wordpress.com/2013/03/figure-2.png
That was discussed in this post:
http://bobtisdale.wordpress.com/2013/03/13/nodcs-pentadal-ocean-heat-content-0-to-2000m-creates-warming-that-doesnt-exist-in-the-annual-data-a-lot-of-warming/
The NODC Ocean heat content for the depths of 0-2000 meters is not a credible dataset, and because it’s now only available in pentadal form, it’s useless for research.
Reich.Eschhaus says: “So? Learn to write better! (Brevity is the soul of wit 😉 )”
My posts are intended to be educational, not witty. And because they’re for persons without technical backgrounds, I write as clearly as possible.
Reich.Eschhaus says: “There you say it! You wanted to discuss your pet theory and plug your book! Not at all ashamed to distort someone else’s post in your interpretation and above that telling your reader’s to go there and make fuzz….”
Again, this is not a pet theory. Maybe you can’t read and interpret time-series graphs. Also, if I wanted to sell more books, I would not have written and provided a link to the free essay that’s linked earlier in the same paragraph. And your continued insistence on stating that I have somehow distorted Dana Nuccitelli’s post clearly indicates you have no understanding of the subject matter.
Reich.Eschhaus says: “Bullshit! You presented the theory that during an La Nina the ocean water is warming by additional sunshine (because of a lack clouds caused by trade winds) and that this energy is released to the atmosphere (and also to other oceans) during an El Nino. Is that a theory? An hypothesis? A gut feeling? dbstealy wants to know! ;)”
It’s not a theory; it’s basic ENSO dynamics. I’ve been presenting these ENSO basic processes here at WUWT for years. The fact that you can’t grasp it or haven’t investigated it doesn’t make it a theory. McPhaden 1999 addresses the energy source of the 1997/98 El Niño:
http://lightning.sbs.ohio-state.edu/geo622/paper_enso_McPhaden1999.pdf
McPhaden writes:
“For at least a year before the onset of the 1997–98 El Niño, there was a buildup of heat content in the western equatorial Pacific due to stronger than normal trade winds associated with a weak La Niña in 1995–96.”
Now, here’s Figure 4 from Pavlakis et al (2008) that shows downward shortwave radiation over the central equatorial Pacific varying inversely with NINO3.4 sea surface temperature anomalies:
http://bobtisdale.files.wordpress.com/2013/01/figure-42.png
Link to Pavlakis et al:
http://www.atmos-chem-phys-discuss.net/8/6697/2008/acpd-8-6697-2008-print.pdf
And here’s a graph of total cloud amount data for the two regions illustrated in Figure 4 from Pavlakis et al:
http://bobtisdale.files.wordpress.com/2013/01/figure-52.png
I’ve been presenting that very basic relationship in blog posts for years. A recent example is here:
http://bobtisdale.wordpress.com/2013/01/25/untruths-falsehoods-fabrications-misrepresentations/
Would you also like a graph of trade wind strength and direction?
Reich.Eschhaus says: “Huh? El Nino and La Nina are defined by opposite patterns. What is wrong with that?”
They’re not opposites. That’s the problem. Did you read this post? Clearly you didn’t understand it. The instrument temperature record shows they have different impacts on the ocean heat content and sea surface temperatures.
Reich.Eschhaus says: “Should you not be asking the question if there are less clouds in total instead of asking if a weather pattern has moved geographically to the west?”
I’ve already addressed this in my reply. Addressed it years ago.
Reich.Eschhaus says: “Still waiting for the mechanism putting extra energy in the earth system….”
It’s already been presented to you numerous times on this thread.
Let me make a couple of suggestions, Reich.Eschhaus. You should ask for additional information, instead of attempting to be confrontational. I, personally, find your trolling efforts here tiresome. You may also want to study the subject matter for a couple of years as we’ve been doing here at WUWT. The questions you’re raising are not original. They were asked and answered years ago. Then, after you’re fluent on ENSO, come back to discuss it.
As I wrote in a reply to TLM above, if you’d like to carry your arguments further, please provide links to the climate model-based peer-reviewed studies that explain:
1. Why the sea surface temperatures of the East Pacific haven’t warmed in 31 years.
2. Why the seas surface temperatures of the Atlantic, Indian and West Pacific Oceans only warmed during the strong El Niño events of 1986/87/88, 1997/98 and 2009/10.
3. Why the warming of the ocean heat content data for the tropical Pacific is dependent on the 1973-76 and 1995/96 La Niña events, and without those La Niñas the ocean heat content for tropical Pacific would cool.
4. Why the warming of the ocean heat content of the North Pacific (north of the tropics) is dependent on a 2-year climate shift (1989-90), and without that climate shift, the ocean heat content for the North Pacific would cool.
I’ll save you some time looking. There are no studies that explain why sea surface temperatures and ocean heat content actually warmed as they did.
@ur momisugly Bob Tisdale
Sorry for the delay (busy week)
“Reich.Eschhaus says: “There you say it! You wanted to discuss your pet theory and plug your book! Not at all ashamed to distort someone else’s post in your interpretation and above that telling your reader’s to go there and make fuzz….”
Again, this is not a pet theory. Maybe you can’t read and interpret time-series graphs. Also, if I wanted to sell more books, I would not have written and provided a link to the free essay that’s linked earlier in the same paragraph. And your continued insistence on stating that I have somehow distorted Dana Nuccitelli’s post clearly indicates you have no understanding of the subject matter. ”
Yes, it is and you are! You pick a few convenient quotes from the blog post and then promote your own view.
“Reich.Eschhaus says: “Bullshit! You presented the theory that during an La Nina the ocean water is warming by additional sunshine (because of a lack clouds caused by trade winds) and that this energy is released to the atmosphere (and also to other oceans) during an El Nino. Is that a theory? An hypothesis? A gut feeling? dbstealy wants to know! ;)”
It’s not a theory; it’s basic ENSO dynamics.”
Ah? Is that not a theory? Or a hypothesis? Or whatever you want to call it? You connect data (ocean temperature patterns) with a proposed mechanism (amount of clouds), therefore “And again, I have not presented a theory; I presented data.” doesn’t wash.
“Reich.Eschhaus says: “Huh? El Nino and La Nina are defined by opposite patterns. What is wrong with that?”
They’re not opposites. That’s the problem. Did you read this post? Clearly you didn’t understand it. The instrument temperature record shows they have different impacts on the ocean heat content and sea surface temperatures.”
Heh? They are defined in opposition to one another! What else? Of course they have different impacts as a consequence.
“Reich.Eschhaus says: “Should you not be asking the question if there are less clouds in total instead of asking if a weather pattern has moved geographically to the west?”
I’ve already addressed this in my reply. Addressed it years ago.
Reich.Eschhaus says: “Still waiting for the mechanism putting extra energy in the earth system….”
It’s already been presented to you numerous times on this thread.”
No, you need to show that absence of clouds in (some, apparently) La Ninas would translate into a big enough increase in ocean heat content to cause the uptick in surface temperatures during an El Nino that follows. Numbers please. Additionally, you need to show why the energy that has been accumulated thus is staying in the system, so that each following El Nino rises surface temperatures further. You have not done this.
Once you have done that, you need to explain why this El Nino warming is happening in modern times and has not been happening before, because we would be frying by now if it had been (That was the point I tried to make with ‘How many El Ninos does it take to get unbearable warming? Will the polar bears then die? Is global action required to prevent the occurrence of more El Ninos’).
Regards
Brian says
I don’t think the planet is falsifying or proving anything over a 15 year period. It falsified projections, but not the AGW hypothesis
Henry says
if you had understand of how the GH effect is supposed to work, namely that it causes a delay in cooling, from earth to space, resulting in a warming effect, then it follows that if more CO2 or more H2O or more other GHG’s were to be blamed for extra warming we should see minima rising faster, pushing up the means. That has not happened. If you look at my tables here,
http://blogs.24.com/henryp/2013/02/21/henrys-pool-tables-on-global-warmingcooling/
you will notice that if we take the speed of warming over the longest period, we find a ratio of maxima : means: minima of 0.036:0.014:0.006. That is ca. 6:2:1. So it was maxima pushing up minima and means and not the other way around.
Dana & his friends have wiped all my comments from their (Guardian) slate.
They are crooks. I say let fools stay fools if they want to be.
It is a pity though that humanity could fall in the pit of global cooling not having done enough to safeguard food production for 7 billion people and counting.
‘The climate consensus 97%’
Wow so these two account for 97% of warmist scientists now, we’re doing better than even I thought! I wonder who/what the other 3% is? The little toe of Jones maybe?
Carrie, I believe “Climate Consensus – 97%” has to do with an upcoming paper by the crew from SkepticalScience. They just held a fund raiser to cover publication fees:
http://www.skepticalscience.com/Be-part-of-landmark-citizen-science-paper-on-consensus.html
Oddly, while the rest of the climate science community and the public is coming to terms with the fact that “consensus” is symptom of a political agenda, not a scientific endeavor, and that consensus making has been detrimental to research in climate science, SkepticalScience is promoting it. Go figure.
Bob Tisdale says:
April 25, 2013 at 8:13 am
Olaus Petri says: “Well done Dr. Tisdale!”
Thanks for the kind words and the degree…but I do not have a doctorate.
================================================
Bob,
I would disagree. You have the heart of a teacher. One who teaches at the level of those who need the instruction. WE THE PEOPLE are very appreciative that you share your knowledge and the level at which you do it. You, IMHO are much more than a person with a doctorate, You are someone who cares enough about the truth that you are willing to share it openly. I wish some of those I work with had the respect and knowledge you exude.
You are proof that one does not need a doctorate or any other degree to know what is going on and how to share it with others. You frighten those with degrees who are lieing. Keep the light burning to expose the truth.
Dr Bob… has a nice ring to it.. 🙂
Thanks for all you do!
Bill
In all climactic progressions there is a cyclical pattern. A sign wave. When we look at overall heating or cooling in the oceans we see multiple cyclical patterns. The short ones like the ENSO, ADO, PDO, etc are periods of just 10-40 years on average and their ranges are constant. Short periods of rise (about 3 years) followed by 24 years of status quo..
When we look for the climactic long term sign wave, only about 10% is above the interglacial temperature threshold. That wave is approximately 112,000 years long. If I place that pattern into today’s pattern we should be below that 10% temp threshold by 5-10 years or so.
Yet the upward progression of overall temperature trend continues in short term cycles. We are still within statistical lag time however to begin cooling. I was wondering on the grander scale how the oscillations work when we finally enter the rapid cooling phase? And as an aside how the weakening of the earth magnetic field is affecting those flows?
are the 1-3 degree temp increases inverted? nonexistent? or do the status quo times begin to trend down?
Bob Tisdale says:
April 26, 2013 at 3:12 pm
4. Why the warming of the ocean heat content of the North Pacific (north of the tropics) is dependent on a 2-year climate shift (1989-90), and without that climate shift, the ocean heat content for the North Pacific would cool.
========================================
I wonder if this has much to do with our weakening magnetic field and the fact that as it weakens there is less push and pull on earths oceans. thus less water movement. if the system is slowed cooling is the only thing we can do…
Bill says
I was wondering on the grander scale how the oscillations work when we finally enter the rapid cooling phase? And as an aside how the weakening of the earth magnetic field is affecting those flows?
henry@Bill
Bill, I looked at the energy coming through the atmosphere (maximum temperatures)
Here are some interesting clues
http://blogs.24.com/henryp/2013/04/29/the-climate-is-changing/
Bill H says: “I wonder if this has much to do with our weakening magnetic field and the fact that as it weakens there is less push and pull on earths oceans.”
It’s attributable to a shift in the wind patterns in the North Pacific. There are numerous papers about the shift in sea level pressure and it’s impacts on sea surface temperature on the North Pacific, but I’ve never seen a paper about its impacts on OHC there. I’ve also never seen a paper (haven’t looked for one, truth be told) about the relationship between the magnetic field and sea level pressure.
Bob Tisdale says
It’s attributable to a shift in the wind patterns in the North Pacific. There are numerous papers about the shift in sea level pressure and it’s impacts on sea surface temperature on the North Pacific,
Henry@Bob
That shift probably starts by the reduction of warmth (UV) from the top, getting into the oceans,
SH, mostly.
Anyway, can I ask you a big favor? Could you please have a look at this log:
http://blogs.24.com/henryp/2013/04/29/the-climate-is-changing/
I want to use this as a communication to all (specifically) religious (Christian/Judaism) media
(which is why I added some biblical references – never mind those, that is just as an aside)
but I would prefer to hear your and WUWT opinions about it.
It would be much appreciated if I could have your (honest) opinion about it.
Reich.Eschhaus: I have no need to reply to your continued arguments because you’re simply repeating the points you attempted to make, and to which I have already responded. Have a nice day.
Henry@Reich.Eschhaus
Dana wiped my comment on his Guarded site where I put this to him:
Any (good) chemist knows that there are giga tons and giga tons of bi-carbonates dissolved in the oceans and that (any type of) warming would cause it to be released:
HCO3- + heat => CO2 (g) + OH-.
This is the actual reason we are alive today. Cause and effect, get it? There is a causal relationship. More warming naturally causes more CO2. Without warmth and carbon dioxide there would be nothing, really. To make that what we dearly want, i.e. more crops, more trees, lawns and animals and people, nature uses water and carbon dioxide and warmth, mostly.
The oceans are heated by the UV <0.5 um from the sun, not by the carbon dioxide. If you study the absorbency of water, you might figure out why.
I am awaiting your comments on my article here
http://blogs.24.com/henryp/2013/04/29/the-climate-is-changing/