The Guardian has a new blog called Climate Consensus – The 97%. The two primary authors are to be Dana Nuccitelli, a regular contributor at SkepticalScience, and John Abraham, Associate Professor at the University of St. Thomas.
Dana Nuccitelli’s first post at his new blog at The Guardian is titled “Why is Reuters puzzled by global warming’s acceleration?” His article is subtitled, “‘Climate scientists struggle to explain warming slowdown,’ said Reuters. But warming is speeding up, and scientists can explain it.” Nuccitelli’s first post at The Guardian is reminiscent of his posts at SkepticalScience—that is, it’s misleading and full of misinformation.
Data contradict the points Dana Nuccitelli is trying to make. In this post, we’ll briefly discuss ocean heat content data, how Mother Nature—not manmade greenhouse gases—creates warm water during La Niña events, how she releases that naturally created warm water during El Niño events and redistributes it around the oceans afterwards, and we’ll discuss Dana Nuccitelli’s misleading animation called “The Escalator”. Data explains how and why the vast majority of global warming occurred naturally…when it warmed.
OCEAN HEAT CONTENT
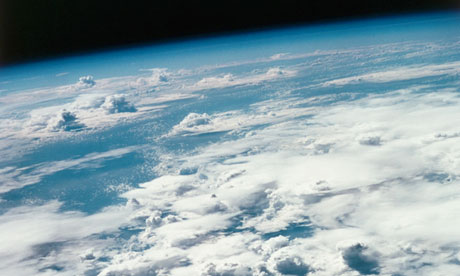
Nuccitelli begins his post with a picture from space of the Pacific Ocean with the caption:
Oceans, such as the Pacific pictured here from space, are absorbing much of the warming the planet is currently experiencing. NASA/ Roger Ressmeyer/ Corbis
Then the first sentence of his post reads:
The rate of heat building up on Earth over the past decade is equivalent to detonating about 4 Hiroshima atomic bombs per second.
Based on Nuccitelli’s opening illustration and statement, we should expect the ocean heat content of the Pacific Ocean to be showing a monumental amount of warming over the past 10 years. But, as shown in Figure 1, the ocean heat content data for the Pacific Ocean from pole to pole (90S-90N, 120E-80W) shows cooling. Right from the get go, data disagrees with Nuccitelli’s representations.

Figure 1
The NODC’s Ocean Heat Content data used in Figure 1 (and in the other ocean heat content graphs in this post) is the only regularly updated dataset of its kind that’s available to the public on a gridded basis through the KNMI Climate Explorer. There, users can select the coordinates of the data they desire. The NODC’s ocean heat content data represents the change in the heat stored in the oceans to depths of 700 meters or about 2300 feet.
The article in The Guardian also fails to describe all of the problems associated with ocean heat content data. Before the ARGO floats were deployed starting in the early 2000s, the temperature observations at depth were so sparse that the data has to be taken with more than a grain of salt, especially when dealing with the data below 700 meters. And the ARGO-era ocean heat content data has been adjusted so many times it’s difficult to keep track of all of them. Many of the problems with ocean heat content data were described in the blog post Is Ocean Heat Content Data All It’s Stacked Up to Be? It’s a long post, I’ll grant you that, but if you’re interested in ocean heat content data, it’s worth a read. Bottom line: even with all of the adjustments to the ARGO-era that added warming to the ocean heat content data, the Pacific data shows cooling over the past 10 years—contrary to what Dana Nuccitelli implied with his opening statement and illustration.
HOW LA NIÑAS CREATE WARM WATER IN THE TROPICAL PACIFIC
Nuccitelli continues:
We often hear from the media that the (surface air) warming has slowed or paused over the past 15 years. This isn’t a puzzle; climate scientists are well aware of several contributing factors, as a recent Reuters article – “Climate scientists struggle to explain warming slowdown” – eventually discussed. The accelerated warming of the oceans is likely the main contributor.
During years with La Niña events, more heat is transferred to the oceans, and surface temperatures are relatively cool as a result. The opposite is true during El Niño years. During the 1990s, there were more El Niño than La Niña events, which resulted in more surface air warming. One of the strongest El Niño events of the century happened in 1998, which not coincidentally was 15 years ago.
Dana fails to explain that Mother Nature, not greenhouse gases, creates ocean heat in the tropical Pacific–where El Niño and La Niña events take place. During La Niña events, the trade winds in the tropical Pacific are stronger. The stronger trade winds reduce cloud cover, which, in turn, allows more sunlight (also known as penetrating solar radiation because it penetrates into the oceans) to warm it. That’s why the long-term warming of the ocean heat content for the tropical Pacific was plainly caused by the 3-year La Niña events of 1954-57, 1973-76 and 1998-01, and during the freakish 1995/96 La Niña. Keep in mind that the 1995/96 La Nina provided the fuel for the 1997/98 El Niño, which was discussed by Nuccitelli. See Figure 2.

Figure 2
To further illustrate the role of La Niñas in the warming of the tropical Pacific, Figure 3, the ocean heat content there would have cooled since the 1950s without the 1973-76 and 1995/96 La Niña events.

Figure 3
Back to Nuccitelli’s statement:
During years with La Niña events, more heat is transferred to the oceans, and surface temperatures are relatively cool as a result. The opposite is true during El Niño years. During the 1990s, there were more El Niño than La Niña events, which resulted in more surface air warming.
That discussion is also misleading for other reasons. Sea surface temperatures (not ocean heat content) in the tropical Pacific cool in response to La Niña events because more cool waters than normal are being upwelled from below the surface of the eastern equatorial Pacific. Marine air temperatures and lower troposphere temperatures cool in response because the tropical Pacific is releasing less heat than normal through evaporation as a result of the cooler surface waters. (That cooler upwelled water is then warmed by the La Niña-caused additional sunlight as it travels from east to west across the tropical Pacific, and it collects in an area east of Indonesia called the west Pacific Warm Pool, where it warms the ocean heat content of the tropical Pacific.)
Note: The sea surface temperature data presented in this post is NOAA’s best: the Optimum Interpolation Sea Surface Temperature data, version 2, also known as Reynolds OI.v2. It’s a combination of observations from satellites, buoys and ship inlets. As noted in the link:
The optimum interpolation (OI) sea surface temperature (SST) analysis is produced weekly on a one-degree grid. The analysis uses in situ and satellite SST’s plus SST’s simulated by sea-ice cover. Before the analysis is computed, the satellite data is adjusted for biases using the method of Reynolds (1988) and Reynolds and Marsico (1993).
EL NIÑO EVENTS
An El Niño event releases that La Niña-created warm water from below the surface of the west Pacific Warm Pool, and an El Niño spreads that warm water eastward across the eastern tropical Pacific. There was so much warm water released by the 1997/98 El Niño that the sea surface temperatures for the entire East Pacific Ocean (from pole to pole or the coordinates of 90S-90N, 180-80W) temporarily warmed 0.5 to 0.6 deg C. See Figure 4. The East Pacific Ocean with those coordinates represents about 33% of the surface of the global oceans, so that was a monumental amount of naturally created warm water that was released by the 1997/98 El Niño. Notice also that the East Pacific sea surface temperature data hasn’t warmed over the 31 years of that dataset, based on the linear trend.

Figure 4
All of that naturally created warm water that’s now on the surface doesn’t simply disappear after a strong El Niño. Ocean currents redistribute that leftover warm water to adjoining ocean basins (which prevents the sea surface temperatures for remote areas, like the North Atlantic, from cooling proportionally during the trailing La Niña). The leftover warm water (and its counteracting effects on the trailing La Niña) is why the sea surface temperatures for the Atlantic, Indian and West Pacific Oceans warmed in a very obvious upward step of about 0.19 deg C, Figure 5, in response to the 1997/98 El Niño. Note that there was also a strong upward shift in response to the 1986/87/88 El Niño and a smaller step in response to the 2009/10 El Niño.

Figure 5
Without those El Niño events, the sea surface temperatures for the Atlantic, Indian and West Pacific Oceans would not have warmed since the early 1980s.
Nuccitelli was right with his statement, “During the 1990s, there were more El Niño than La Niña events, which resulted in more surface air warming.” But he failed to advise his readers:
1. that land surface air temperatures represent only 30% of the global surface temperature record,
2. that sea surface temperature data represent the other 70%,
3. that the satellite-era sea surface temperature data indicate sea surface temperatures warmed naturally in response to the naturally created warm water released from below the surface of the tropical Pacific during strong El Niños, and
4. that the warming of land surface air temperatures is primarily a response to the warming of sea surface temperatures.
For more information, including a discussion of the natural warming of ocean heat content data, refer to my illustrated essay “The Manmade Global Warming Challenge” [42MB]. For even more information, there’s more detail in my ebook Who Turned on the Heat? which was introduced in the blog post here. It’s available in pdf form here for US$8.00.
THE ESCALATOR
Nuccitelli goes on to write:
Reuters didn’t connect the dots between these two articles, telling us one week that oceans help explain the surface warming slowdown, and the next week claiming the slowdown is puzzling climate scientists. However, these ‘slowdowns’ happen on a regular basis. You can find one every 5 to 10 years in the surface temperature data, as illustrated in a graphic I created nicknamed ‘The Escalator‘.
The escalator is included here as Animation 1.
Animation 1
The caption for “The Escalator” reads:
Average of NASA GISS, NOAA NCDC, and HadCRUT4 monthly global surface temperature anomalies from January 1970 through November 2012 (green) with linear trends applied to the timeframes Jan ’70 – Oct ’77, Apr ’77 – Dec ’86, Sep ’87 – Nov ’96, Jun ’97 – Dec ’02, and Nov ’02 – Nov ’12.
Let’s drop back to what Nuccitelli wrote earlier:
One of the strongest El Niño events of the century happened in 1998, which not coincidentally was 15 years ago.
When people say ‘no warming in 15 years’, they’re cherry picking the timeframe to begin in an abnormally hot year.
“The Escalator” by definition is an exercise in cherry picking. Let’s illustrate, with the same data used by Nuccitelli, how global surface temperatures actually warmed without cherry picking the time periods. We’ll simply highlight 3 naturally occurring events, and use them as start and end years for shorter-term data illustrations.
Figure 6 shows the global land surface air temperature plus sea surface temperature anomalies (average of GISS LOTI, HADCRUT4 and NCDC datasets, like The Escalator) before, during and after the 1997/98 El Niño. The data highlighted in red are for the official El Niño months of the 1997/98 El Niño from NOAA’s Oceanic NINO Index. There was little warming during the years leading up to the 1997/98 El Niño and in the years following it. I’ve included period-average temperatures in blue to help highlight that fact. The dip in 1991 and rebound in 1994 is associated with the explosive volcanic eruption of Mount Pinatubo. That cooling is a response to the decrease in penetrating solar radiation caused by the “shading” effects of aerosols spewed into the stratosphere by the explosive volcano—not from a decrease in manmade greenhouse gases. That aside, the vast majority of the warming during the period of March 1988 to February 2013 was caused by the monumental amount of naturally created warm water released from below the surface of the tropical Pacific by the 1997/98 El Niño and redistributed on the sea surface after it–warm water that was created during the 1995/96 La Niña.

Figure 6
You’re probably wondering why I started the graph in Figure 6 at March 1988. That’s the first month after NOAA’s official months for the 1986/87/88 El Niño. If we look at the global surface temperature anomalies from March 1977 to April 1997 (the month before the 1997/98 El Niño), Figure 7, we can see that the 1986/87/88 El Niño caused a similar upward shift in global surface temperatures. The upward steps in Figures 6 and 7 are blatantly obvious when we break the data down into logical shorter time periods before and after the strong El Niño events. (Note: There was also a very strong El Niño in 1982/83, but the eruption of El Chichon in 1982 counteracted the impact on global surface temperatures of all of the warm water it released.)

Figure 7
Now for the period before the 1986/87/88 El Niño: See Figure 8. I’ve started the graph 10 years before The Escalator to show how “flat” global temperatures were leading up to the upward step in global temperatures in 1976. That step is associated with the Pacific Climate Shift, when the sea surface temperatures of the East Pacific ocean suddenly shifted upwards. There are numerous peer-reviewed papers that attempt to explain that natural warming, many with different causes and effects. That shift coincides with the end of the 1973-76 La Niña, which created, as shown Figure 2, the initial warm water used by the trailing El Niño events until the 1995/96 La Niña. Regardless of the cause, there was an obvious upward shift in global surface temperatures in 1976. I’ve highlighted in red the official months of the 1976/77 El Niño as a proxy for the climate shift. The upward step is pretty tough to miss. And again, I’ve used period average temperatures (in blue) before and after the 1976 climate shift to help illustrate its impact on global surface temperatures and to show how “flat” global temperatures were before and after that shift.

Figure 8
Now, if we merge all of the data from Figures 6 through 8, we have a more realistic view on how, when and why global surface temperatures warmed—a more realistic escalator. See Figure 9. There was no cherry picking involved, just a little common sense to highlight the primary causes of global warming since 1960.

Figure 9
CLOSING
Ocean heat content data for the Pacific Ocean contradicts Dana Nuccitelli’s opening statement and illustration. The ocean heat content data for the tropical Pacific show that Mother Nature is responsible for the fuel for El Niño events. Ocean Heat Content data and satellite-era sea surface temperature data also indicate the oceans warmed naturally, but you have to understand that ENSO works as a recharge-discharge oscillator (with La Niña as the recharge mode and El Niño as the discharge mode) to see Mother Nature’s handiwork. And as illustrated, Dana Nuccitelli’s Escalator is simply another way for global warming enthusiasts to hide how global temperatures actually warmed since 1976. In short, data contradicts Dana Nuccitelli’s first post at The Guardian’s new blog.
Feel free to furnish a link to this post at Dana Nuccitelli’s new home at The Guardian. The more the merrier. Unlike SkepticalScience, I don’t believe The Guardian has a track record of deleting comments that disagree with the hypothesis of human-induced global warming. And if Nuccitelli’s posts at The Guardian are similar to his posts at SkepticalScience, he’ll be presenting “The Escalator” again and again, so you can link this post to his future uses of The Escalator at The Guardian, too. And don’t forget the YouTube video On the SkepticalScience Video “Global Warming over the Last 16 Years” when he links that video from SkepticalScience.
Discover more from Watts Up With That?
Subscribe to get the latest posts sent to your email.
Richard, I don’t understand why you think I’m a troll. I’m simply filling a void of commenters who acknowledge that AGW has even a possibility of being somewhat true. There is a difference bwtween a dissenting opinion and a troll. I think Bob Tisdale would agree, since he responded to my questions.
Richard, you should have included the very next sentence after your quotation: “You may be pointing out that AGW is a non-falsifiable theory, but that’s much different than saying the theory doesn’t use measurements.” I acknowledged the idea of a non-falsifiable theory. You quoted me out of context, then proceeded to call me a troll.
Brian says:
Regardless of what has happened in the past 16 years, the question was ‘How many more years of rising global temperatures would it take for you to admit that Nuccitelli is right?’ So from this point forward, how many years of warming would be required for you to acknowledge AGW?
First off, why “regardless”? The planet is clearly falsifying the catastrophic AGW conjecture. But to be fair, I’ll play your game:
I would admit that Nuccitelli is right when/if verifiable measurements of AGW are produced, tested, and found to be attributable specifically to human activity. So far, no such measurements exist.
The scientific method is how science works. But instead, the alarmist crowd demands that we all must accept their measurement-free conjecture. I’m sure witch doctors had the same attitude toward the scientific method, which is based on testable measurements and observations.
I don’t understand your reluctance to accept the scientific method. The onus is upon those making the AGW assertion, not on skeptics questioning it. The ball is in your court regarding AGW. So far, there is no proof that it even exists.
I happen to think AGW exists, but that it is such a minuscule effect that it should be completely disregarded when making policy. I also think that a warmer world is a better world, and that the rise in CO2 is entirely beneficial.
Here is my testable hypothesis for you to try and falsify. I have posted it for years, but no one has made the attempt. Rather, their response is a series of excuses. But as stated, it is a simple, testable hypothesis:
At current and projected concentrations, CO2 is harmless, and beneficial to the biosphere
Have at it.
Brian:
OK. I will feed the troll this once because failure to answer your goading could mislead onlookers.
Your post at April 25, 2013 at 1:43 pm says in its entirety
A rational poster makes points which add information, accepts when s/he has made a mistake or has been shown to be wrong, and takes note of comments of others.
A troll promotes an agenda, posts anything which promotes the agenda (be it true or not), never admits being wrong, and deliberately distorts the words of others.
Clearly, your posts in this thread provide a textbook demonstration of trolling. I could fill the page with examples but that would be as big a waste of space on the thread as your posts because anybody reading the thread can see it for themselves.
Of course AGW “has even a possibility of being somewhat true”. Your implication that I would say otherwise is trolling because I have often said that on WUWT and in many other places. Indeed, this very day I have made two posts on WUWT which explain how and why AGW IS “somewhat true” but cannot possibly be discernibly true. See
http://wattsupwiththat.com/2013/04/24/some-sense-about-sensitivity/#comment-1286120
and
http://wattsupwiththat.com/2013/04/24/some-sense-about-sensitivity/#comment-1287007
I enjoy debating with dissenting opinions: I learn from it.
I revile trolls because they try to supplant the possibility of learning with their agendas.
And Bob Tisdale is the Guest Contributor of this thread and your “questions” cast doubt upon his thesis so he was obligated to answer them.
At present your contributions are trolling. Your future posts need not be.
Richard
Reich.Eschhaus says: “I am afraid it is you who misleads and misinforms here by quoting very selectively from Dana’s blog. Why O Why do you use a few select quotes and then try to make your point, but do not -by ignoring many relevant paragraphs- give a fair description of the blog piece that includes references to published research (Nuccitelli et al 2012; Balmaseda et al 2013; Guemas et al 2013). Show us what is wrong with those publications instead…”
You must be new to WUWT. My apologies for not including the links to past posts, but my posts are too long if I attempt to anticipate and address every question newcomers might have. I discussed Balmaseda et al 2013 here:
http://bobtisdale.wordpress.com/2013/03/25/trenberth-still-searching-for-missing-heat/
And here:
http://bobtisdale.wordpress.com/2013/04/15/more-on-trenberths-missing-heat/
I discussed Guemas et al 2013 here:
http://bobtisdale.wordpress.com/2013/04/08/on-guemas-et-al-2013-retrospective-prediction-of-the-global-warming-slowdown-in-the-past-decade/
If memory serves, Nuccitelli et al 2012 relied on the NODC’s pentadal ocean heat content data which were discussed here:
http://bobtisdale.wordpress.com/2013/03/11/is-ocean-heat-content-data-all-its-stacked-up-to-be/
and here:
http://bobtisdale.wordpress.com/2013/03/13/nodcs-pentadal-ocean-heat-content-0-to-2000m-creates-warming-that-doesnt-exist-in-the-annual-data-a-lot-of-warming/
Reich.Eschhaus says: “…and why Dana is wrong that El Nino / La Nina influence relative energy uptake by the oceans and the atmosphere?”
I believe I provided a reasonable explanation of why his portrayal of ENSO was misleading.
Reich.Eschhaus says: “From your piece it actually appears you agree???”
I believe you should read my post again.
Reich.Eschhaus says: “If I understand your theory correctly, it gets warmer after each El Nino.”
I don’t present a theory. I present data. And you missed a point; the satellite-era sea surface temperature record indicates the Atlantic, Indian and Pacific sea surface temperatures warm after specific strong El Niño events, not all El Niños.
Reich.Eschhaus says: “Do you have a reference that explains to me the mechanism for less clouds during La Ninas and the amount of extra energy put into the earth system as a result?”
ENSO must be new to you. You should find it to be a very interesting process. For the interaction between convection/cloud cover/precipitation, trade wind strength, sea surface temperature, etc., I would suggest you take a look at the very basic ENSO discussions from NOAA. Example:
http://www.srh.noaa.gov/jetstream/tropics/enso_patterns.htm
Bill Kessler’s FAQ webpage is also a good place to start:
http://faculty.washington.edu/kessler/occasionally-asked-questions.html
For the amount of energy, are you looking for a data-based estimate? There are none as far as I know. Do you recall Trenberth’s travesty email? In a follow-up email, Trenberth wrote: “Where did the heat go? We know there is a build up of ocean heat prior to El Nino, and a discharge (and sfc T warming) during late stages of El Nino, but is the observing system sufficient to track it?”
In other words, there is no system in place capable of measuring it–the travesty.
If you’re looking for climate model-based studies, there are none as far as I know, because climate modelers haven’t figured out how to model ENSO yet—even after decades of modeling efforts. Refer to Guilyardi et al (2009):
http://www.knmi.nl/publications/fulltexts/guilyardi_al_bams09.pdf
My favorite quote from that paper is:
“Because ENSO is the dominant mode of climate variability at interannual time scales, the lack of consistency in the model predictions of the response of ENSO to global warming currently limits our confidence in using these predictions to address adaptive societal concerns, such as regional impacts or extremes (Joseph and Nigam 2006; Power et al. 2006).”
Regards
@Bob Tisdale
Thanks for the long reply.
“You must be new to WUWT.”
relatively.
Then you give a bunch a links, thanks, I’ll take a look. Still doesn’t explain my main complaint that you didn’t give a fair representation of Dana’s post (about Reuters conflicting reporting), but instead used only a few of the paragraphs to hang your on theory on and to pretend that anything else was rubbish.
“Reich.Eschhaus says: “…and why Dana is wrong that El Nino / La Nina influence relative energy uptake by the oceans and the atmosphere?”
I believe I provided a reasonable explanation of why his portrayal of ENSO was misleading.”
No, I don’t think so. What’s misleading about that? As I said you seem to agree. After an El Nino surface temperatures rise.
“Reich.Eschhaus says: “If I understand your theory correctly, it gets warmer after each El Nino.”
I don’t present a theory. I present data. And you missed a point; the satellite-era sea surface temperature record indicates the Atlantic, Indian and Pacific sea surface temperatures warm after specific strong El Niño events, not all El Niños. ”
Except for the “specific” (what does that mean?) that is exactly what I just said, you agree surface temperatures rise after (some?) El Ninos. There is a question here though, how soon after an El Nino are “Atlantic, Indian and Pacific sea surface temperatures” affected and can this all be explained by ocean conveyors in the right time frame (not saying it can’t).
“ENSO must be new to you. You should find it to be a very interesting process. For the interaction between convection/cloud cover/precipitation, trade wind strength, sea surface temperature, etc., I would suggest you take a look at the very basic ENSO discussions from NOAA. Example:
http://www.srh.noaa.gov/jetstream/tropics/enso_patterns.htm”
No, not new. The link doesn’t say anything about wetter patterns allowing additional energy take-up by the oceans than usual.
“Bill Kessler’s FAQ webpage is also a good place to start:
http://faculty.washington.edu/kessler/occasionally-asked-questions.html”
Too much to read for now, will take a look. Not convinced yet 🙂
“For the amount of energy, are you looking for a data-based estimate? There are none as far as I know.”
So, it is only conjecture. Glad we cleared that!
“If you’re looking for climate model-based studies, there are none as far as I know, because climate modelers haven’t figured out how to model ENSO yet”
Yes, everybody agrees on that! That’s why you cannot compare modeled sea surface temperatures with actual sea surface temperatures at a time that a specific La Nina / El Nino is taking place.
Greetings
dbstealey, the scientific method is exactly what I’m trying to promote, I’m trying to discourage the use of rhetoric. No ball is in my court, as I am neither a scientist or a politician.
I think your opinions and your hypothesis are fair and valid. And I think scientists should continue to try and understand climate, just as Bob Tisdale is doing.
I don’t think the planet is falsifying or proving anything over a 15 year period. It falsified projections, but not the AGW hypothesis (I agree that hypothesis is a more accurate term than theory). Arctic ice melt also falsified projections of many sceptics, but likewise that doesn’t prove that AGW is responsible.
Bob Tisdale, I think you hit at the heart of the issue with this sentence in response to ReichEschhaus:
“In other words, there is no system in place capable of measuring it–the travesty.”
The warmist crowd assumes it is there, and many on this site assume it is not there. But the truth is that we just down know, right?
Doug Proctor says: “Do we have cloud data (bright sunshine would suffice) for the Pacific area to demonstrate that cloud cover reductions during the La Nina events caused the Pacific heating?”
Pavlakis et al (2008) used the ISCCP cloud amount data:
http://www.atmos-chem-phys-discuss.net/8/6697/2008/acpd-8-6697-2008-print.pdf
There are problems with the raw ISCCP data (volcanic aerosols, missing data over the Indian Ocean, etc.). The ISCCP Cloud Amount data is available through the KNMI Climate Explorer. Unfortunately it ends in 2006:
http://climexp.knmi.nl/selectfield_obs.cgi?someone@somewhere
A surface downward shortwave radiation reanalysis is part of the NCEP-DOE R2 reanalysis, if you’re interested in a reanalysis. It’s available through the NOAA NOMADS website:
http://nomad3.ncep.noaa.gov/cgi-bin/pdisp_mf_r2.sh?ctlfile=flx.ctl&varlist=on&new_window=on&ptype=ts&dir=
It’s the 4th selection in the “Field” drop-down menu.
Regards
Reich.Eschhaus,
Your source is wrong. AGW is not a “theory”. That word is often mis-used. In science, ‘theory’ has a specific meaning. See here.
Next, you say, “Promoters of scare! Ha! Let’s do without the hyperbole.”
Tell me, would you consider this to be hyperbole? It is the basis of the CAGW false alarm.
No need to answer that, as the journal Nature has issued a rare Correction. Mann’s original chart has been so thoroughly debunked that not even the IPCC still uses it.
Finally, you say, “According to Bob, you have to wait for the next El Nino, and then the world will be warmer again ;)”
Since the LIA the planet has warmed by ≈0.35º/century. Naturally. That warming has not accelerated — in fact, it has recently stopped. Explain that inconvenient fact, if you can.
• • •
Brian says:
“The warmist crowd assumes it [AGW] is there, and many on this site assume it is not there.”
Like Bob, I accept what the data tell me. If there is no data, why would you automatically presume that something exists, and that it will lead to catastrophic warming? It’s like assuming there is a black cat under your bed. You’re certain of it; you can almost hear it breathing.
But when you turn on the light and look under your bed — there is no cat.
That’s how I see AGW. It may exist, but it is insignificant at current and projected concentrations.
@dbstealy
“Your source is wrong. AGW is not a “theory”. That word is often mis-used. In science, ‘theory’ has a specific meaning. See here.”
I am very well aware! Thank you very much! You didn’t ask me if I used the term scientifically or in a way that ordinary people do (I referred to Bob’s ideas as theory too!).
However… AGW is by many considered to be a theory in the scientific sense (see my link to the history which proves it is long standing). Here, many will disagree of course.
“Next, you say, “Promoters of scare! Ha! Let’s do without the hyperbole.”
Tell me, would you consider this to be hyperbole? It is the basis of the CAGW false alarm. ”
Irrelevant. You came at me with claims of hyperbole, I was referring to the discussion here.
“Finally, you say, “According to Bob, you have to wait for the next El Nino, and then the world will be warmer again ;)”
Since the LIA the planet has warmed by ≈0.35º/century. Naturally. That warming has not accelerated — in fact, it has recently stopped. Explain that inconvenient fact, if you can.”
The whole bloody point of my first comment was to say that Dana’s post tries to explain just that and that Bob’s reaction to Dana is being very selective! Read both and see what I mean. Now you need to explain to me why there was a LIA and it stopped, and warmed naturally (by which mechanism?) and then it stopped again. A lot of scientists are actually trying to find out why such things happen without trying to score cheap points. (Note I didn’t try to explain it for you! That’s on purpose, do your own research.)
Best wishes
Brian says: “Bob, I appreciate the reply, and all of the work you do in this discipline. I think you’ve done a great job at explaining ENSO, and how it affects climate. You clearly demonstrate that the oceans warmed naturally, but I will again state that such a demonstration doesn’t show that there is no anthropogenic component as well.”
Brian, thanks for the reply. Let me give you the “But” answer: The IPCC made the point in AR4 and they’re making it again in AR5 (if memory serves with their Figure 10.1) that climate models can only simulate the recent warming if they’re forced with manmade greenhouse gases and other anthropogenic forcings. While that has always suggested model failings to me, the IPCC believes it means that only greenhouse gases can explain the warming. In other words, they’re suggesting all of the recent warming was human induced. They’re beliefs are hard to justify when the sea surface temperature data for the Atlantic, Indian and West Pacific would show no warming without the strong El Niño events…
http://bobtisdale.files.wordpress.com/2013/04/atl-ind-west-pac-w-n-w-o-el-ninos.png
…and when the sea surface temperatures of the East Pacific haven’t warmed in 31 years:
http://bobtisdale.files.wordpress.com/2013/04/04-east-pac-w-1997-98-el-nino-highlight.png
I have little doubt that a manmade greenhouse gas global warming signal exists, likely a part of the additional warming of land surface temperatures above the warming that’s a response to the natural warming of the global oceans, but I can find no evidence of any influence of manmade greenhouse gases on the warming of sea surface temperature and ocean heat content data.
Reich.Eschhaus says: “According to Bob, you have to wait for the next El Nino, and then the world will be warmer again ;)”
With luck, I’ll have a few more years on this planet, but at my age it’s a subject I don’t dwell on. I’m content to wait for the next strong El Nino and watch what happens. With luck that strong El Nino will arrive before the AMO decides to reverse course…but that interaction would also be interesting.
Hi Bob,
“With luck, I’ll have a few more years on this planet, but at my age it’s a subject I don’t dwell on. I’m content to wait for the next strong El Nino and watch what happens. With luck that strong El Nino will arrive before the AMO decides to reverse course…but that interaction would also be interesting.”
While I was writing my comment you made that one. I hope you don’t mind making a bit of fun of your theory (sorry dbstealy: hypothesis) that you see in the data, which has a consequence that we have to make sure (by planetary governance no doubt) no new El Nino occurs in our life times!
Brian says: “The warmist crowd assumes it is there, and many on this site assume it is not there. But the truth is that we just down know, right?”
And the sea surface temperature and ocean heat content data do not support the existence of a human-induced global warming signal.
Bob, I agree that IPCC projections have been too high, and that the models have holes in them. Your ENSO work certainly illustrate some of the reason why.
I wish you would incorporate more of the language in the last paragraph of your reply to me into your posts. It seems that much of the audience here feasts on the idea that ENSO flat-out disproves AGW. It’s obvious that you think a vast majority of recent warming is natural, but still consider the possibility of an anthropogenic signal. I would like to see more posts here at least consider the opposing viewpoint.
I do believe that removing El Nino from the temperature charts is misleading, unless you can show that the strength and number of recent El Ninos is an anomaly within natural variation.
Reich.Eschhaus says:
“…sorry dbstealy: hypothesis…”
I see you haven’t read my “Conjecture, Hypothesis, Theory, Law” link yet. But at least you’re heading in the right direction now.☺
Brian says:
“It’s obvious that you think a vast majority of recent warming is natural, but still consider the possibility of an anthropogenic signal.”
That is exactly my point of view, too.
If/when an AGW signal is shown to exist [per the scientific method; testable and falsifiable measurements, directly attributable to human CO2 emissions], I will be a happy camper. It is the knowledge that is important to me, not the policy-driven agenda.
If we do confirm verifiable AGW measurements, then the climate sensitivity number will be known and accepted by both sides. That is essential information for making correct policy decisions.
I suspect, however, that if and when AGW measurements are established, that one side of the debate will be very, very unhappy about it.
It is scientific skeptics who will be happy. Because we will have learned something important.
Reich.Eschhaus says:
“Now you need to explain to me why there was a LIA and it stopped, and warmed naturally (by which mechanism?) and then it stopped again…. do your own research.”
===========================================
I do plenty of my own research. The problem is that no one knows the exact cause(s) of the various swings in global temperature. There are many suggestions, but I suspect that the cause is not the same in each case.
The cause of the LIA is unknown. But the subsequent recovery is probably due to the planet reverting to it’s mean temperature. The LIA was one of the coldest episodes of the entire Holocene. Since then, global warming has been about 0.35ºC per century, with no recent acceleration. That fact alone deconstructs the conjecture that CO2 causes any meaningful warming.
Looking at the long term, we see that we have been living in a “Goldilocks” climate: not too hot, not too cold, but ju-u-ust right. The 0.7º fluctuations in global temperature have been unusually flat. That is the reason I question all the wild-eyed arm waving over a few tenths of a degree change, over a century and a half. People have been led to believe there is a crisis, but the facts say otherwise. This is as close to a climate non-crisis as we will get.
@dbstealy
“I do plenty of my own research.”
2 graphs no research make
” The problem is that no one knows the exact cause(s) of the various swings in global temperature”
Correct, paleoclimatic research gives you the most probable answer
“There are many suggestions, but I suspect that the cause is not the same in each case.”
No it isn’t in each case, who says that?
“The cause of the LIA is unknown.”
Yes! It is also unknown what period constituted the LIA
http://en.wikipedia.org/wiki/Little_Ice_Age
“But the subsequent recovery is probably due to the planet reverting to it’s mean temperature. The LIA was one of the coldest episodes of the entire Holocene. Since then, global warming has been about 0.35ºC per century, with no recent acceleration. That fact alone deconstructs the conjecture that CO2 causes any meaningful warming.”
OK, given uncertainty about the causes of the LIA I can accept, given the causes have disappeared, the planet returns to previous equilibrium (btw, can you ask Bob Tisdale why it gets warmer after each El Nino and temperature doesn’t get back to a equilibrium?). It also appears to be the case that the 19th century was particularly cold (do you trust the science saying that it was very cold back then?). Still this doesn’t prove anything unless you can give a mechanism.
The point is that there is a physical mechanism (let’s call it “global warming theory’) for why the world should get warmer upon addition of CO2 in the atmosphere. We have increased CO2 and it did warm. It’s explainable.
“Looking at the long term, we see that we have been living in a “Goldilocks” climate: not too hot, not too cold, but ju-u-ust right. The 0.7º fluctuations in global temperature have been unusually flat. That is the reason I question all the wild-eyed arm waving over a few tenths of a degree change, over a century and a half. People have been led to believe there is a crisis, but the facts say otherwise. This is as close to a climate non-crisis as we will get.”
Again, you fail to see the point I made. The post by Dana was explaining why it still was warming despite surface temperatures not going up. I was taking issue with Bob’s reaction. You can make an argument against Dana’s explanation. Can you please just do so, explain where he is wrong?
Reich.Eschhaus says: “Still doesn’t explain my main complaint that you didn’t give a fair representation of Dana’s post (about Reuters conflicting reporting), but instead used only a few of the paragraphs to hang your on theory on and to pretend that anything else was rubbish.”
You admitted earlier in your reply that you haven’t yet read my posts about the papers discussed in Nuccitelli’s post so why are you belaboring this point? I’ve already admitted that my blog post cannot address every point that he tried to make or linked paper he presented. My post was too long as it was. Additionally, my primary goals were to discuss ENSO and “The Escalator” animation. I’m not concerned that my goals for this post and your expectations of it don’t agree, but on the other hand you seem to feel your expectations are important. Maybe you should write a post about Dana’s post and submit it to WUWT so that it will meet your expectations.
And again, I have not presented a theory; I presented data.
Reich.Eschhaus says: “No, I don’t think so. What’s misleading about that? As I said you seem to agree. After an El Nino surface temperatures rise.”
You missed the part in Nuccitelli’s explanation where he suggests or infers that La Niña events counteract or opposed El Niño events. The sea surface temperature records for the Atlantic, Indian and West Pacific oceans clearly indicate that this is not the case.
Reich.Eschhaus says: “Except for the ‘specific’ (what does that mean?) that is exactly what I just said, you agree surface temperatures rise after (some?) El Ninos.”
That means, while the ENSO record indicates that many more lesser El Niño events took place between November 1981 and present, the data indicate the sea surface temperatures of the Atlantic, Indian and West Pacific warmed in steps in response to the warm water that was left over from the 1986/87/88 and 1997/98 and 2009/10 El Ninos, and they did not cool proportionally in response to the trailing La Niñas due to that leftover warm water.
BTW, that was not your point with your nonsensical questions, “How many El Ninos does it take to get unbearable warming? Will the polar bears then die? Is global action required to prevent the occurrence of more El Ninos?”
Reich.Eschhaus says: “There is a question here though, how soon after an El Nino are ‘Atlantic, Indian and Pacific sea surface temperatures’ affected and can this all be explained by ocean conveyors in the right time frame (not saying it can’t).”
Thanks for the quote, because you picked up a typo in my last reply. It should read “Atlantic, Indian and West Pacific”. With your okay, I’ll correct the typo in my reply to you.
With that correction in mind, the warming of the sea surface temperatures for the Atlantic, Indian and West Pacific lag the warming of the NINO3.4 region by about 6 months. Coincidentally, after a strong East Pacific El Niño, it takes a slow moving Rossby wave about 6 months to return leftover warm water from the eastern to the western tropical Pacific. And we can look at the North Atlantic in isolation, because it is remote to the tropical Pacific. The North Atlantic warms in a few months in response to an El Niño, through changes in atmospheric circulation (slower trade winds in the tropical North Atlantic, for example). Would you like a link to a paper that discusses that impact on the tropical North Atlantic? Refer to Wang 2005:
http://www.aoml.noaa.gov/phod/docs/Wang_Hadley_Camera.pdf
Reich.Eschhaus says: “No, not new. The link doesn’t say anything about wetter patterns allowing additional energy take-up by the oceans than usual.”
But the link does state that during La Niñas, “The prevailing rain pattern also shifts farther west than normal.” If the prevailing rain pattern shifts farther to the west, that means the convection, cloud cover and precipitation all shift farther to the west. Therefore, with less cloud cover in the central and western tropical Pacific, there is logically more sunlight reaching and penetrating the central and western tropical Pacific Ocean.
Reich.Eschhaus says: “So, it is only conjecture. Glad we cleared that!”
Actually, it’s not conjecture. Cloud amount data, sea surface temperature data, ocean heat content data, trade wind strength and direction data, ocean current data, thermocline depth data, etc., all confirm the processes of ENSO. And the sea surface temperature data for the Atlantic, Indian and West Pacific Oceans also confirm that La Niña events do not counteract El Niño events. But like everything else in climate science there’s no way to directly measure the energy involved due to the weaknesses of the measuring systems.
Reich.Eschhaus says: “Yes, everybody agrees on that! That’s why you cannot compare modeled sea surface temperatures with actual sea surface temperatures at a time that a specific La Nina / El Nino is taking place.”
It also indicates the models fail to include the largest natural process that periodically creates ocean heat content in the tropical Pacific and also periodically releases that heat from below the surface of the tropical Pacific and redistributes that warm water within the oceans. If ENSO releases more heat than normal from the tropical Pacific over a multidecadal period, surface temperatures have to warm over that multidecadal period. If ENSO creates more heat than normal and stores it in the west Pacific Warm Pool, then the ocean heat content of the tropical Pacific has to warm. And those processes are not simulated by climate models.
Regards
@ur momisugly Bob Tisdale
“You admitted earlier in your reply that you haven’t yet read my posts about the papers discussed in Nuccitelli’s post so why are you belaboring this point? I’ve already admitted that my blog post cannot address every point that he tried to make or linked paper he presented. My post was too long as it was.”
So? Learn to write better! (Brevity is the soul of wit 😉 )
“Additionally, my primary goals were to discuss ENSO and “The Escalator” animation. I’m not concerned that my goals for this post and your expectations of it don’t agree, but on the other hand you seem to feel your expectations are important. Maybe you should write a post about Dana’s post and submit it to WUWT so that it will meet your expectations. ”
There you say it! You wanted to discuss your pet theory and plug your book! Not at all ashamed to distort someone else’s post in your interpretation and above that telling your reader’s to go there and make fuzz….
“And again, I have not presented a theory; I presented data.”
Bullshit! You presented the theory that during an La Nina the ocean water is warming by additional sunshine (because of a lack clouds caused by trade winds) and that this energy is released to the atmosphere (and also to other oceans) during an El Nino. Is that a theory? An hypothesis? A gut feeling? dbstealy wants to know! 😉
“You missed the part in Nuccitelli’s explanation where he suggests or infers that La Niña events counteract or opposed El Niño events. The sea surface temperature records for the Atlantic, Indian and West Pacific oceans clearly indicate that this is not the case. ”
Huh? El Nino and La Nina are defined by opposite patterns. What is wrong with that?
Clearly you write too much, I can’t allow myself to write an whole article in the comments section.
Only few points therefore:
“But the link does state that during La Niñas, “The prevailing rain pattern also shifts farther west than normal.” If the prevailing rain pattern shifts farther to the west, that means the convection, cloud cover and precipitation all shift farther to the west. Therefore, with less cloud cover in the central and western tropical Pacific, there is logically more sunlight reaching and penetrating the central and western tropical Pacific Ocean.”
Should you not be asking the question if there are less clouds in total instead of asking if a weather pattern has moved geographically to the west? Inquiring minds want to know! Let me put this in clear terms, if you theory is to be consistent it has to show that there is enough surplus energy getting to earth. You don’t show that by wetter moving westwards.
“Actually, it’s not conjecture. Cloud amount data, sea surface temperature data, ocean heat content data, trade wind strength and direction data, ocean current data, thermocline depth data, etc., all confirm the processes of ENSO. And the sea surface temperature data for the Atlantic, Indian and West Pacific Oceans also confirm that La Niña events do not counteract El Niño events. But like everything else in climate science there’s no way to directly measure the energy involved due to the weaknesses of the measuring systems.”
Still waiting for the mechanism putting extra energy in the earth system….
See you tomorrow maybe, will be off soon.
Reich.Eschhaus says:
“2 graphs no research make”
You are such a noob here that I’m probably wasting my time. Your incessant questions divert from answering anything substantive. They amount to constantly moving the goal posts, a typical alarmist tactic.
If you want to give debate a real try, then try explaining the inconvenient fact that while CO2 has been rising fast over the past century, global warming since the LIA has been right on the same long-term trend line, with no acceleration. Explain why the putative GHG effect doesn’t show up in the temperature record.
You are trying your best to defend a scientific illiterate and propagandist. Dana Nuccitelli has posted here many times, and he has always had his hat handed to him. Every time, he’s left when faced with proof of his misinformation. Check out the WUWT archives, you will see how truly lame Nuccitelli is. He hides out from real debates with serious skeptics, because like all alarmist debaters, he loses. All he is doing is emitting catastrophic AGW propaganda; he cannot hold his own here, so he finds noobies like you to carry his water for him.
The long term trend line for the past several hundred years has been the same, but you continue to ignore that central fact. If CO2 had the claimed effect, global warming would be accelerating fast. The fact that it is not accelerating at all is a dagger in the heart of the fake “carbon” scare.
Run along now back to SkS or wherever you get your talking points from. You need some new ones because the ones you’re using are old and busted. We’ve disposed of them here, long before you ever showed up.
@dbstealy
“You are such a noob here that I’m probably wasting my time. Your incessant questions divert from answering anything substantive. They amount to constantly moving the goal posts, a typical alarmist tactic.”
Bullshit! My first post was about misrepresentation, you said nothing about it (wanting me to change subject, now you accuse me of changing goal posts! 😀 😀 laughable! And I’m a noob! Thanks for that! 😛 ).
“If you want to give debate a real try, then try explaining the inconvenient fact that while CO2 has been rising fast over the past century, global warming since the LIA has been right on the same long-term trend line, with no acceleration. Explain why the putative GHG effect doesn’t show up in the temperature record.”
You really really really do seem to want discuss things that I was not discussing here.
“You are trying your best to defend a scientific illiterate and propagandist. Dana Nuccitelli has posted here many times, and he has always had his hat handed to him. Every time, he’s left when faced with proof of his misinformation. Check out the WUWT archives, you will see how truly lame Nuccitelli is. He hides out from real debates with serious skeptics, because like all alarmist debaters, he loses. All he is doing is emitting catastrophic AGW propaganda; he cannot hold his own here, so he finds noobies like you to carry his water for him.”
Yawn…
“The long term trend line for the past several hundred years has been the same, but you continue to ignore that central fact. If CO2 had the claimed effect, global warming would be accelerating fast. The fact that it is not accelerating at all is a dagger in the heart of the fake “carbon” scare.”
Are you here close to taking up the points I raised in my first comment or are you still refusing to be to the point. It’s up to you!
Run along now back to SkS or wherever you get your talking points from. You need some new ones because the ones you’re using are old and busted. We’ve disposed of them here, long before you ever showed up.
Blah blah (boring)
[snip]
After what you and the other haters have written about me in your Sks forum, don’t try to play nice here and ask me to engage you. And please, feel free to be as upset as you wish. – Anthony
Every chart that Nuccitelli produces is a complete distortion of the facts and the data. He is, in fact, the worst distortionist that I have come across in my many wanderings around the climate debate over many years. Being the worst is really saying something because we have a Mann and a Hansen to compare to (and many, many others).
The fact that he is popular right now in his AGW-believing group just means they like to see a line going up. None question him on how come his charts/data don’t match the actual facts, they just like to see a line going up.
We obviously have a Reich.Eschhaus here who has bought Nuccitelli’s distortions hook, line and sinker but these people will just not accept anything other than a line going up (not matter how fake it is). No point trying to tell him the line is actually going down. This is similar to the parable of the King has no clothes and there is a reason this became a common parable – because humans are actually quite succeptible to this.
I wonder why the global ocean heat content under 700m is increasing when the pacific (as per Bob’s figure 1) is decreasing.
http://www.nodc.noaa.gov/OC5/3M_HEAT_CONTENT/
It’s worth pointing out that the heat content 0-2000m shows the ocean heating is not slowed.
Looks like a reading comprehension issue. The Pacific was only mentioned as pictured here because that was the picture, which could equally have been the Atlantic. The article doesn’t mention the Pacific, so the criticism looks to have been misguided. When they say global ocean heat content has risen, that was the focus, and it wasn’t talking about regions. Read the article again with a global perspective.
Reich.Eschhaus says:
“You really really really do seem to want discuss things that I was not discussing here.”
That dissembling comment was in response to my repeatedly ignored question: Why has global warming not accelerated following the ≈40% rise in CO2? Reich really really really cannot answer that question.
But that is the central question in the entire debate. Because the endless alarmist predictions claimed that rising CO2 would result in runaway global warming. That has not happened. In fact, global warming has stopped. How does the alarmist crowd explain that inconvenient fact? Answer: they don’t, because they can’t. That incovenient fact causes them immense consternation: the real world is falsifying their religious belief system.
So Mr Reich tucks tail and runs from answering the central question in the global warming/”carbon” debate. Why?
The answer is because AGW propagandists like Nuccitelli have made numerous global warming predictions, which have all turned out to be total failures. Their predictions were flat wrong. But rather than honestly admitting they were wrong, they mislead and misinform. Reich is merely Nuccitelli’s water boy. He only showed up here very recently, trying to do some damage control. But that doesn’t work, unless the alarmist side can censor comments.
If I am wrong, then Reich needs to step up and answer the question: why has the very large rise in CO2 not triggered an acceleration in global warming? By not answering, Reich shows that he’s being a good water boy. But he’s certainly not a scientist.
• • •
Seth,
The ARGO buoys don’t show what you think they show.
Bob Tisdale says:
April 25, 2013 at 2:48 pm
Brilliant work throughout your article, Mr. Tisdale. The post whose signature is above both falsifies the claim that AGW explains changes in ocean temperature and offers an alternative explanation based on the natural regularities known as La Nina and El Nino. Of course, your explanation sticks to the data and does not offer a theory.
Alarmists will have some trouble with your work because there is not one of them who understands what a natural regularity is. Your paragraph from a separate reply to “reich” is also very important:
“It also indicates the models fail to include the largest natural process that periodically creates ocean heat content in the tropical Pacific and also periodically releases that heat from below the surface of the tropical Pacific and redistributes that warm water within the oceans. If ENSO releases more heat than normal from the tropical Pacific over a multidecadal period, surface temperatures have to warm over that multidecadal period. If ENSO creates more heat than normal and stores it in the west Pacific Warm Pool, then the ocean heat content of the tropical Pacific has to warm. And those processes are not simulated by climate models.”
Another fine post Bob Tisdale, you must be getting under some of the true believers skins, as flack is increasing.I love the way your presentation of what the ocean sensing equipment shows, send the faithful into a tizzy.
And yes your posts are long, but you have little choice given the wealth of data you are presenting.
Query… What is time lag from El Nino to entrance of warm water into Arctic Ocean?
Any guess as to duration of this warm water in arctic ocean?