The Guardian has a new blog called Climate Consensus – The 97%. The two primary authors are to be Dana Nuccitelli, a regular contributor at SkepticalScience, and John Abraham, Associate Professor at the University of St. Thomas.
Dana Nuccitelli’s first post at his new blog at The Guardian is titled “Why is Reuters puzzled by global warming’s acceleration?” His article is subtitled, “‘Climate scientists struggle to explain warming slowdown,’ said Reuters. But warming is speeding up, and scientists can explain it.” Nuccitelli’s first post at The Guardian is reminiscent of his posts at SkepticalScience—that is, it’s misleading and full of misinformation.
Data contradict the points Dana Nuccitelli is trying to make. In this post, we’ll briefly discuss ocean heat content data, how Mother Nature—not manmade greenhouse gases—creates warm water during La Niña events, how she releases that naturally created warm water during El Niño events and redistributes it around the oceans afterwards, and we’ll discuss Dana Nuccitelli’s misleading animation called “The Escalator”. Data explains how and why the vast majority of global warming occurred naturally…when it warmed.
OCEAN HEAT CONTENT
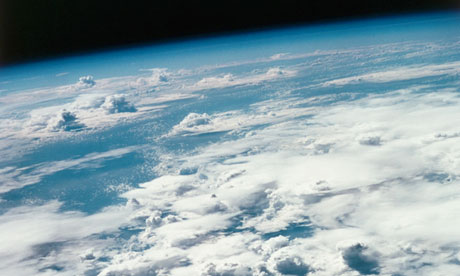
Nuccitelli begins his post with a picture from space of the Pacific Ocean with the caption:
Oceans, such as the Pacific pictured here from space, are absorbing much of the warming the planet is currently experiencing. NASA/ Roger Ressmeyer/ Corbis
Then the first sentence of his post reads:
The rate of heat building up on Earth over the past decade is equivalent to detonating about 4 Hiroshima atomic bombs per second.
Based on Nuccitelli’s opening illustration and statement, we should expect the ocean heat content of the Pacific Ocean to be showing a monumental amount of warming over the past 10 years. But, as shown in Figure 1, the ocean heat content data for the Pacific Ocean from pole to pole (90S-90N, 120E-80W) shows cooling. Right from the get go, data disagrees with Nuccitelli’s representations.

Figure 1
The NODC’s Ocean Heat Content data used in Figure 1 (and in the other ocean heat content graphs in this post) is the only regularly updated dataset of its kind that’s available to the public on a gridded basis through the KNMI Climate Explorer. There, users can select the coordinates of the data they desire. The NODC’s ocean heat content data represents the change in the heat stored in the oceans to depths of 700 meters or about 2300 feet.
The article in The Guardian also fails to describe all of the problems associated with ocean heat content data. Before the ARGO floats were deployed starting in the early 2000s, the temperature observations at depth were so sparse that the data has to be taken with more than a grain of salt, especially when dealing with the data below 700 meters. And the ARGO-era ocean heat content data has been adjusted so many times it’s difficult to keep track of all of them. Many of the problems with ocean heat content data were described in the blog post Is Ocean Heat Content Data All It’s Stacked Up to Be? It’s a long post, I’ll grant you that, but if you’re interested in ocean heat content data, it’s worth a read. Bottom line: even with all of the adjustments to the ARGO-era that added warming to the ocean heat content data, the Pacific data shows cooling over the past 10 years—contrary to what Dana Nuccitelli implied with his opening statement and illustration.
HOW LA NIÑAS CREATE WARM WATER IN THE TROPICAL PACIFIC
Nuccitelli continues:
We often hear from the media that the (surface air) warming has slowed or paused over the past 15 years. This isn’t a puzzle; climate scientists are well aware of several contributing factors, as a recent Reuters article – “Climate scientists struggle to explain warming slowdown” – eventually discussed. The accelerated warming of the oceans is likely the main contributor.
During years with La Niña events, more heat is transferred to the oceans, and surface temperatures are relatively cool as a result. The opposite is true during El Niño years. During the 1990s, there were more El Niño than La Niña events, which resulted in more surface air warming. One of the strongest El Niño events of the century happened in 1998, which not coincidentally was 15 years ago.
Dana fails to explain that Mother Nature, not greenhouse gases, creates ocean heat in the tropical Pacific–where El Niño and La Niña events take place. During La Niña events, the trade winds in the tropical Pacific are stronger. The stronger trade winds reduce cloud cover, which, in turn, allows more sunlight (also known as penetrating solar radiation because it penetrates into the oceans) to warm it. That’s why the long-term warming of the ocean heat content for the tropical Pacific was plainly caused by the 3-year La Niña events of 1954-57, 1973-76 and 1998-01, and during the freakish 1995/96 La Niña. Keep in mind that the 1995/96 La Nina provided the fuel for the 1997/98 El Niño, which was discussed by Nuccitelli. See Figure 2.

Figure 2
To further illustrate the role of La Niñas in the warming of the tropical Pacific, Figure 3, the ocean heat content there would have cooled since the 1950s without the 1973-76 and 1995/96 La Niña events.

Figure 3
Back to Nuccitelli’s statement:
During years with La Niña events, more heat is transferred to the oceans, and surface temperatures are relatively cool as a result. The opposite is true during El Niño years. During the 1990s, there were more El Niño than La Niña events, which resulted in more surface air warming.
That discussion is also misleading for other reasons. Sea surface temperatures (not ocean heat content) in the tropical Pacific cool in response to La Niña events because more cool waters than normal are being upwelled from below the surface of the eastern equatorial Pacific. Marine air temperatures and lower troposphere temperatures cool in response because the tropical Pacific is releasing less heat than normal through evaporation as a result of the cooler surface waters. (That cooler upwelled water is then warmed by the La Niña-caused additional sunlight as it travels from east to west across the tropical Pacific, and it collects in an area east of Indonesia called the west Pacific Warm Pool, where it warms the ocean heat content of the tropical Pacific.)
Note: The sea surface temperature data presented in this post is NOAA’s best: the Optimum Interpolation Sea Surface Temperature data, version 2, also known as Reynolds OI.v2. It’s a combination of observations from satellites, buoys and ship inlets. As noted in the link:
The optimum interpolation (OI) sea surface temperature (SST) analysis is produced weekly on a one-degree grid. The analysis uses in situ and satellite SST’s plus SST’s simulated by sea-ice cover. Before the analysis is computed, the satellite data is adjusted for biases using the method of Reynolds (1988) and Reynolds and Marsico (1993).
EL NIÑO EVENTS
An El Niño event releases that La Niña-created warm water from below the surface of the west Pacific Warm Pool, and an El Niño spreads that warm water eastward across the eastern tropical Pacific. There was so much warm water released by the 1997/98 El Niño that the sea surface temperatures for the entire East Pacific Ocean (from pole to pole or the coordinates of 90S-90N, 180-80W) temporarily warmed 0.5 to 0.6 deg C. See Figure 4. The East Pacific Ocean with those coordinates represents about 33% of the surface of the global oceans, so that was a monumental amount of naturally created warm water that was released by the 1997/98 El Niño. Notice also that the East Pacific sea surface temperature data hasn’t warmed over the 31 years of that dataset, based on the linear trend.

Figure 4
All of that naturally created warm water that’s now on the surface doesn’t simply disappear after a strong El Niño. Ocean currents redistribute that leftover warm water to adjoining ocean basins (which prevents the sea surface temperatures for remote areas, like the North Atlantic, from cooling proportionally during the trailing La Niña). The leftover warm water (and its counteracting effects on the trailing La Niña) is why the sea surface temperatures for the Atlantic, Indian and West Pacific Oceans warmed in a very obvious upward step of about 0.19 deg C, Figure 5, in response to the 1997/98 El Niño. Note that there was also a strong upward shift in response to the 1986/87/88 El Niño and a smaller step in response to the 2009/10 El Niño.

Figure 5
Without those El Niño events, the sea surface temperatures for the Atlantic, Indian and West Pacific Oceans would not have warmed since the early 1980s.
Nuccitelli was right with his statement, “During the 1990s, there were more El Niño than La Niña events, which resulted in more surface air warming.” But he failed to advise his readers:
1. that land surface air temperatures represent only 30% of the global surface temperature record,
2. that sea surface temperature data represent the other 70%,
3. that the satellite-era sea surface temperature data indicate sea surface temperatures warmed naturally in response to the naturally created warm water released from below the surface of the tropical Pacific during strong El Niños, and
4. that the warming of land surface air temperatures is primarily a response to the warming of sea surface temperatures.
For more information, including a discussion of the natural warming of ocean heat content data, refer to my illustrated essay “The Manmade Global Warming Challenge” [42MB]. For even more information, there’s more detail in my ebook Who Turned on the Heat? which was introduced in the blog post here. It’s available in pdf form here for US$8.00.
THE ESCALATOR
Nuccitelli goes on to write:
Reuters didn’t connect the dots between these two articles, telling us one week that oceans help explain the surface warming slowdown, and the next week claiming the slowdown is puzzling climate scientists. However, these ‘slowdowns’ happen on a regular basis. You can find one every 5 to 10 years in the surface temperature data, as illustrated in a graphic I created nicknamed ‘The Escalator‘.
The escalator is included here as Animation 1.
Animation 1
The caption for “The Escalator” reads:
Average of NASA GISS, NOAA NCDC, and HadCRUT4 monthly global surface temperature anomalies from January 1970 through November 2012 (green) with linear trends applied to the timeframes Jan ’70 – Oct ’77, Apr ’77 – Dec ’86, Sep ’87 – Nov ’96, Jun ’97 – Dec ’02, and Nov ’02 – Nov ’12.
Let’s drop back to what Nuccitelli wrote earlier:
One of the strongest El Niño events of the century happened in 1998, which not coincidentally was 15 years ago.
When people say ‘no warming in 15 years’, they’re cherry picking the timeframe to begin in an abnormally hot year.
“The Escalator” by definition is an exercise in cherry picking. Let’s illustrate, with the same data used by Nuccitelli, how global surface temperatures actually warmed without cherry picking the time periods. We’ll simply highlight 3 naturally occurring events, and use them as start and end years for shorter-term data illustrations.
Figure 6 shows the global land surface air temperature plus sea surface temperature anomalies (average of GISS LOTI, HADCRUT4 and NCDC datasets, like The Escalator) before, during and after the 1997/98 El Niño. The data highlighted in red are for the official El Niño months of the 1997/98 El Niño from NOAA’s Oceanic NINO Index. There was little warming during the years leading up to the 1997/98 El Niño and in the years following it. I’ve included period-average temperatures in blue to help highlight that fact. The dip in 1991 and rebound in 1994 is associated with the explosive volcanic eruption of Mount Pinatubo. That cooling is a response to the decrease in penetrating solar radiation caused by the “shading” effects of aerosols spewed into the stratosphere by the explosive volcano—not from a decrease in manmade greenhouse gases. That aside, the vast majority of the warming during the period of March 1988 to February 2013 was caused by the monumental amount of naturally created warm water released from below the surface of the tropical Pacific by the 1997/98 El Niño and redistributed on the sea surface after it–warm water that was created during the 1995/96 La Niña.

Figure 6
You’re probably wondering why I started the graph in Figure 6 at March 1988. That’s the first month after NOAA’s official months for the 1986/87/88 El Niño. If we look at the global surface temperature anomalies from March 1977 to April 1997 (the month before the 1997/98 El Niño), Figure 7, we can see that the 1986/87/88 El Niño caused a similar upward shift in global surface temperatures. The upward steps in Figures 6 and 7 are blatantly obvious when we break the data down into logical shorter time periods before and after the strong El Niño events. (Note: There was also a very strong El Niño in 1982/83, but the eruption of El Chichon in 1982 counteracted the impact on global surface temperatures of all of the warm water it released.)

Figure 7
Now for the period before the 1986/87/88 El Niño: See Figure 8. I’ve started the graph 10 years before The Escalator to show how “flat” global temperatures were leading up to the upward step in global temperatures in 1976. That step is associated with the Pacific Climate Shift, when the sea surface temperatures of the East Pacific ocean suddenly shifted upwards. There are numerous peer-reviewed papers that attempt to explain that natural warming, many with different causes and effects. That shift coincides with the end of the 1973-76 La Niña, which created, as shown Figure 2, the initial warm water used by the trailing El Niño events until the 1995/96 La Niña. Regardless of the cause, there was an obvious upward shift in global surface temperatures in 1976. I’ve highlighted in red the official months of the 1976/77 El Niño as a proxy for the climate shift. The upward step is pretty tough to miss. And again, I’ve used period average temperatures (in blue) before and after the 1976 climate shift to help illustrate its impact on global surface temperatures and to show how “flat” global temperatures were before and after that shift.

Figure 8
Now, if we merge all of the data from Figures 6 through 8, we have a more realistic view on how, when and why global surface temperatures warmed—a more realistic escalator. See Figure 9. There was no cherry picking involved, just a little common sense to highlight the primary causes of global warming since 1960.

Figure 9
CLOSING
Ocean heat content data for the Pacific Ocean contradicts Dana Nuccitelli’s opening statement and illustration. The ocean heat content data for the tropical Pacific show that Mother Nature is responsible for the fuel for El Niño events. Ocean Heat Content data and satellite-era sea surface temperature data also indicate the oceans warmed naturally, but you have to understand that ENSO works as a recharge-discharge oscillator (with La Niña as the recharge mode and El Niño as the discharge mode) to see Mother Nature’s handiwork. And as illustrated, Dana Nuccitelli’s Escalator is simply another way for global warming enthusiasts to hide how global temperatures actually warmed since 1976. In short, data contradicts Dana Nuccitelli’s first post at The Guardian’s new blog.
Feel free to furnish a link to this post at Dana Nuccitelli’s new home at The Guardian. The more the merrier. Unlike SkepticalScience, I don’t believe The Guardian has a track record of deleting comments that disagree with the hypothesis of human-induced global warming. And if Nuccitelli’s posts at The Guardian are similar to his posts at SkepticalScience, he’ll be presenting “The Escalator” again and again, so you can link this post to his future uses of The Escalator at The Guardian, too. And don’t forget the YouTube video On the SkepticalScience Video “Global Warming over the Last 16 Years” when he links that video from SkepticalScience.
Discover more from Watts Up With That?
Subscribe to get the latest posts sent to your email.
dbstealey says:April 25, 2013 at 11:02 am
To counter the deceptive SkS ‘escalator’ chart, here is a WFT chart showing global temperatures going over a hump.
Who knows what will happen in future? But one thing is certain: looking at the past 150 years, there isn’t much to worry about.
That last graph is deceptively small. If it were presented more appropriately, it might look like this:
http://i35.tinypic.com/j7dy13.jpg
You really need to go in for ‘re-grooving’. And those are probably degrees C! No wonder the earth has a fever! 😉
Reich.Eschhaus,
Wake up. The whole global warming scam is a giant head fake. There are no verifiable, testable mesurements of AGW. None.
AGW probably exists. But it’s effect is so small that it can be completely disregarded. It is certainly too minuscule to measure.
The fact is that global warming has risen at the same rate since the LIA. There has been no acceleration in the trend, despite a ≈40% rise in CO2. How do you explain that??
The trumped-up “carbon” scare has no supporting scientific measurements. Nuccitelli’s side is operating on 100% assertions, and zero percent measurements. Why do you still believe that nonsense? Maybe a better question is: what, exactly, would it take for you to admit that AGW doesn’t matter? How many more years of stagnant global temperatures would it take for you to admit that Nuccitelli is flat wrong?
Give us a number.
@dbstealey
My response didn’t mention AGW at all except indirectly in that Bob Tisdale’s theory seems to imply the earth gets warmer after each El Nino. So where is the relevance to my response? Do you agree with my interpretation of Bob’s theory?
Ergo, Global Warming is caused by Pacific clouds (or lack of). Thus anything that promotes or creates clouds over the Pacific (like cosmic radiation?) will promote Global Cooling.
Correct?
.
Dbstealey, your argument is reversible. One could pose the same questions to you from the opposite point of view:
What exactly would it take for you to admit that AGW does matter? How many more years of rising global termperatures would it take for you to admit that Nuccitelli is right?
To me, these questions do not matter. The issue is so polarized, it has come to ridiculous black-and-white assertions from supporters of both sides. Climate science is a young discipline, and I think we all need to have an open mind about it.
Luca says: April 25, 2013 at 5:03 am
The Guardian does exercise censorship.
____________________________________
Indeed it does. I have been totally banned from the Grauniad site.
Unfortunately, it is not just the Grauniad that indulges in censorship, so do all the media outlets – especially the BBC. The BBC, for instance, never mentioned all the cold weather in the Ukraine and the US and China. They had to mention the UK’s cold winter, but BBC viewers may have thought the UK was the only nation effected.
More curious, however, is the self censorship of right-wing newspapers. There was a terrorist event a while ago, where Daily Mail readers were bound to be outraged (the DM is slightly left of Ghengis Khan). But instead of real reader comments, the entire article was then filled with hopelessly obvious DM employee comments saying “Oh, how sad” etc: etc:
We are not allowed to even be outraged nowadays, on newspaper blogs that are dominated by the ‘outraged’ in our society.
.
Bob –
Do we have cloud data (bright sunshine would suffice) for the Pacific area to demonstrate that cloud cover reductions during the La Nina events caused the Pacific heating?
A percentage change in cloud cover can be used to calculate the additional clear air absorption and water absorption, and thus the W/m2 warming that induced the specific near-surface energy increase and near-surface atmospheric temperature rise.
Brian; sorry, but the warmists are saying that the earth is warming unnaturally as a result of man made CO2 – it is up to the warmists to prove it.
Brian:
Your post at April 25, 2013 at 12:09 pm is silly. You write
It is NOT the responsibility of D B Stealey or anybody else to disprove an assertion which has no supporting evidence.
It is the responsibility of those making the assertions to demonstrate there is some reason for concern. And there is no evidence for discernible AGW; none, zilch, nada. Three decades of research conducted world-wide and costing more than $5 billion per year has failed to find any evidence for AGW.
You may as well have asked,
What exactly would it take for you to admit there is a dangerous goblin under the bed?
As for your asking about “How many more years of rising global temperatures”,
WHAT PLANET ARE YOU ON?
Here on Earth there has been NO discernible rise in global temperature for at least 16 years.
And you follow that with this disingenuous twaddle:
Of course those questions “do not matter” because they are bloody stupid!
Forget the polarised views of Nuccitelli and other SkS cranks.
And do NOT “keep an open mind” about the “young discipline” of so-called “climate science”. That “discipline” is in its infancy, and only a fool would change the economy of the entire world on the basis of an infant’s tantrums.
Richard
DirkH says: April 25, 2013 at 7:06 am “Bob, the Guardian lets comments appear first and later the moderators play catch up and remove all of the undesired opinions.”
True. But that is justifiable.
The debate is uncensored. Posts are not deleted while the conversation goes on.
The Wayback machine records for posterity.
And the Guardian can’t be sued for hosting (potentially) subversive data. This is prudent considering the press laws in flux here in the UK.
By being polite I have never been snipped on the Guardian website.
Of course, I have been snipped but, on reflection, the few times it’s happened, I have been accusing someone of dangerous paranoia – which does destroy debate.
Rhonda, you’re right, but that doesn’t give skeptics an excuse to make ridiculous claims in the opposite direction (like bdstealey’s claim of zero percent measurements). Most reasonable AGW supporters acknowledge that there is much to learn about climate. I wish some here would do the same, rather than act like they know for a fact that the earth is about to cool.
batheswithwhales says: “I can’t figure out how the starting point of the red line of the “escalator” was chosen.
“The end point seems to be the latest possible data point, but the starting point is not the first data point, January 1970. Neither is it zero.”
The red line in the SkepticalScience Escalator is the linear trend. It does not necessarily align with end points, but is calculated based on all of the data in the graph. It’s apparent alignment with the end point is just a coincidence in that graph. Global surface temperatures have since dropped so at present they do not coincide with the trend line at either end.
Brian asks:
”What exactly would it take for you to admit that AGW does matter?”
Any of the following would do it for me:
1) A change in the fundamental laws of physics pertaining to the relationship between radiation, temperature, and greenhouse gases. (No, I’m not one of the “GHE is bogus” crowd; I understand heat transfer fairly decently.)
2) A stroke that leaves me without any sense of scale or perspective with respect to geologic time, logarithmic effects, or chemistry.
3) Actual evidence of strongly positive feedback mechanisms & some reason to accept a warmer world isn’t a net better world.
4) An AGW hypothesis that is falsifiable, tested repeatedly, and found to stand up to the test of time and intense scrutiny instead of a religious like jumped to dogmatic conclusion that is defended zealously by any means necessary and (again) some reason to accept a warmer world isn’t a net better world.
5) Two more up steps in global average temperature that are verifiable and not from some adjustment, UHI (or similar effect), or data manipulation; considering the signs for natural temperature drivers are pointing DOWN and (again again) some reason to accept a warmer world isn’t a net better world.
GW: It’s not the end of the world, it’s just a slight change in plans.
Brian:
At April 25, 2013 at 12:50 pm you provide a post
http://wattsupwiththat.com/2013/04/25/dana-nuccitelli-misleads-and-misinforms-in-his-first-blog-post-at-the-guardian/#comment-1287521
which attempts – and fails – to excuse your earlier stupidity.
Please read my post at April 25, 2013 at 12:46 pm
http://wattsupwiththat.com/2013/04/25/dana-nuccitelli-misleads-and-misinforms-in-his-first-blog-post-at-the-guardian/#comment-1287516
which quotes all of your stupid post and refutes each of its statements.
Richard
Richard, your sarcastic hypothetical question about goblins is exactly my point. It’s a meaningless question to ask. Regardless of what has happened in the past 16 years, the question was “How many more years of rising global temperatures would it take for you to admit that Nuccitelli is right?” So from this point forward, how many years of warming would be required for you to acknowledge AGW? But the answer to that question does not matter. It does nothing to advance anyone’s understanding of climate. It’s just an emotionally charged rhetorical device, which the rest of your rant to me is full of.
Brian says: “I don’t see how this post disproves Dana’s point. You are explaining the steps up in temperature as regime shifts, but where is the explanation for the lack of cooling shifts in recent decades?”
For four years, I’ve been presenting how the sea surface temperature data indicates the oceans warmed naturally. In this post, in response to the SkepticalScience animation called the Escalator, I’ve simply extended that explanation to global land+plus sea surface temperature data.
I hate to answer a question with a question, but through what mechanism other than volcanos would cooling shifts occur? The problems: I’d have to see one before I tried to explain it, and I haven’t seen one.
John West’s response is very realistic, and I think you would find reasonable AGW supporters would list similarly grounded reasons of what it would take for them to realize that the past half-century has been pure natural variation.
My main point with all this is to point out flawed rhetoric and confirmation bias, and to support open mindedness and two-way dialogue. Some of you who are so sure of your points of view should be debating warmists, not preaching to the choir here.
Brian:
re your post at April 25, 2013 at 1:03 pm.
Stop trolling.
You posed a stupid question and I responded with an identically stupid question.
That was NOT sarcasm: it was explanation by way of illustration.
And no rise in temperature for at least 16 years is NOT rising temperatures except in your delusions.
You have incredible gall to accuse me of “rehetorical device”!
I would accept an apology for your trolling and I will refuse to feed the troll if you make any reply to this post except an apology for your trolling.
Richard
Brian says:
“…bdstealey’s claim of zero percent measurements…”
Brian, show us where we can find testable, empirical measurements of AGW. I’m all ears. Because I have been searching for such measurements for years.
The fact is that there are no such measurements. There are plenty of assertions of AGW, and as I stated, AGW may exist [but if so, it is simply too minuscule to measure].
Rather than say that I made a ‘ridiculous claim’, post your AGW measurements right here. You will be the first. Because there are plenty of measurements like this showing that ∆CO2 is caused by ∆temperature. But there are no comparable charts showing that ∆CO2 causes ∆T. None [prove me wrong, if you think you can, by posting a comparable chart showing that CO2 causes ∆T. Overlays don’t count.].
Science is all about empirical measurements and observations. When a conjecture such as CO2=AGW has no supporting measurements, it is hardly scientific, is it? The science starts and ends at the “conjecture” stage. AGW is not a hypothesis, since it is not testable. It is only a conjecture.
Thousands of scientists have been searching for decades for empirical, verifiable measurements attributable to AGW [and which cannot be attributed to other factors, such as UHI]. They have all failed. There are no such measurements.
If there were verifiable AGW measurements, then the question of the climate sensitivity number for 2xCO2 would be decisively answered. But those guesstimates currently range from negative CO2 forcing, to zero effect for 2xCO2, to the UN/IPCC’s preposterous 3º – 6ºC.
Without quantifiable, verifiable and testable measurements of AGW, the question of the climate sensitivity number will remain unanswerd. That fact proves that there are no verifiable measurements of AGW: QED.
By now, the sensitivity number should have been agreed to by everyone. But the fact is that no one knows for sure. And the reason is that there are no verifiable, testable AGW measurements.
@Brian
@richard
@John
@Rhoda
It is always good to take a look at how the theory came to be in considering where the weight of evidence needs to be in demanding who has to put a number of things and why. I was reminded of a description of the history of the theory of AGW by Richard saying it was a young science. Luckily I found the link (interesting read, bit lengthy though):
http://www.aip.org/history/climate/co2.htm
And Richard, with:
“And do NOT “keep an open mind” about the “young discipline” of so-called “climate science”. That “discipline” is in its infancy, and only a fool would change the economy of the entire world on the basis of an infant’s tantrums.”
you are conflating science with policy. It is perfectly possible to accept that the theory of AGW is correct (including possible disastrous consequences in the future) and at the same time being opposed to measures to curb the human caused emissions of CO2.
Bob, I appreciate the reply, and all of the work you do in this discipline. I think you’ve done a great job at explaining ENSO, and how it affects climate. You clearly demonstrate that the oceans warmed naturally, but I will again state that such a demonstration doesn’t show that there is no anthropogenic component as well. There may not be one, but I believe it is too early to tell for sure. I certainly do not know of a cooling mechanism, but I am also curious to learn about one in the future, and how it fits in with any long-term trend.
dbstealey, the qoute I was responding to was “Nuccitelli’s side is operating on 100% assertions, and zero percent measurements.” I don’t believe that any measurements have conclusively proven AGW, but the research certainly uses measurements. You may not agree with them or the methods they use, but they are still measurements. I think ARGO is probably the most relevant to this particular post. So I agree that “there are no verifiable, testable AGW measurements”, but I would also say that there are also no verifiable measurements that disprove AGW. You may be pointing out that AGW is a non-falsifiable theory, but that’s much different than saying the theory doesn’t use measurements.
Pete_L
It’s called Heat Transport (like in Star Trek).
Seriously though, considering our lack of measurement continuity it is conceivable (if not entirely believable) that energy from the sun that heated a surface that then emitted IR that would have been radiated to space but instead was absorbed because of the slight increase in bandwidth coverage that a few extra CO2 molecules have provided and then emitted to Earth has been transferred through the sea surface unnoticed (cough, cough) and warmed subsurface layers. (I almost got through that with a straight face.)
Reich.Eschhaus:
re your failed attempt to support Brian’s trolling which you provide at April 25, 2013 at 1:16 pm.
You conclude it by saying to me.
Yes, on that point you are right: I fell into the trap made by the troll and I should not have done that. Sorry.
However, until there is some – any – evidence that AGW exists and that it is potentially harmful then assertions of need for costly methods to curb it are plain daft.
Richard
@richardcourtney
“re your failed attempt to support Brian’s trolling which you provide at April 25, 2013 at 1:16 pm.”
I was trying to bring some perspective to the history of the (badly named) greenhouse gas effect. Did I fail in that? The science is not young, most scientists didn’t take it serious at first or thought effects of greenhouse gases are minimally (see the link I posted). After decades of research most scientist have been won over to the idea that greenhouse gases are very important.
“Yes, on that point you are right: I fell into the trap made by the troll and I should not have done that. Sorry.”
Good for you to admit that, I salute you! However, I didn’t see a trap in the comment by Brian.
Reich.Eschhaus,
It is hard to take anyone seriously who asserts that AGW is a “theory”.
A theory makes accurate predictions. But the promoters of the AGW scare have all made wrong predictions, claiming that global warming would continue. But despite the 40% rise in CO2, that has not happened. Every alarmist prediction has been wrong. Every one of them.
Anyone interested in the scientific method would have stepped back by now, and admitted that there is a major problem with their CO2/AGW conjecture. Only dishonest parties cling to the false belief of catastrophic AGW. It is not happening, and global warming has stopped for at least the past decade and a half.
The planet itself is proving your AGW conjecture flat wrong. You are dealing with that fact by becoming thoroughly unscientific, mis-labeling AGW a “theory”.
There is no probity within the climate alarmist cult. Most of us prefer to listen to what the planet is telling us, rather than accept what self-serving propagandists like Nuccitelli are falsely claiming.
@dbstealy
“It is hard to take anyone seriously who asserts that AGW is a “theory”. ”
Of course it is. See link on the history I posted above and here again:
http://www.aip.org/history/climate/co2.htm
(I am sure there are other histories around if you search for them)
“A theory makes accurate predictions.”
Depends on the theory. E.g., quantum mechanics can make stochastic predictions
“But the promoters of the AGW scare have all made wrong predictions, claiming that global warming would continue. But despite the 40% rise in CO2, that has not happened. Every alarmist prediction has been wrong. Every one of them.”
Promoters of scare! Ha! Let’s do without the hyperbole. But the whole point of Dana’s blog post was that global warming had continued (but not being visible in surface temperature records lately). My first post here was complaining about Bob not representing Dana’s post fairly, but picking out a few quotes where he could hang his own pet theory on…
“Only dishonest parties cling to the false belief of catastrophic AGW. It is not happening, and global warming has stopped for at least the past decade and a half.”
According to Bob, you have to wait for the next El Nino, and then the world will be warmer again 😉
Friends:
At April 25, 2013 at 1:27 pm Brian says
Please note that he does not say how anybody could provide measurements that disprove the existence of anything.
Or to put that another way (because he does not like his trolling being exposed by equivalent questions):
I would also say that there are also no verifiable measurements that disprove the Easter Bunny, Santa Claus, or the Tooth Fairy.
Richard