It has been a while since I’ve presented the GISS, UK Met Office and NCDC global land surface air temperature plus sea surface temperature products. I’ve decided to add them to the datasets I update monthly.
I’ll present each of the datasets individually, starting in January 1979, using the suppliers’ standard base years for anomalies. 1979 is the start year of the lower troposphere temperature products (not included), so it’s a logical start time for these short-term data presentations. The GISS, UK Met Office and NCDC products with linear trends are then presented in a comparison graph, using the base years of 1981-2010. And for those wanting a better look at the most recent wiggles, the last comparison graph starts in January 2003—the last decade plus. The final graph is the average of the 3 products.
GISS LAND OCEAN TEMPERATURE INDEX (LOTI)
Introduction: The GISS Land Ocean Temperature Index (LOTI) data is a product of the Goddard Institute for Space Studies. Starting with their January 2013 update, it uses NCDC ERSST.v3b sea surface temperature data. The impact of the recent change in sea surface temperature datasets is discussed here. GISS adjusts GHCN and other land surface temperature data via a number of methods and infills missing data using 1200km smoothing. Refer to the GISS description here. Unlike the UK Met Office and NCDC products, GISS masks sea surface temperature data at the poles where seasonal sea ice exists, and they extend land surface temperature data out over the oceans in those locations. Refer to the discussions here and here. GISS uses the base years of 1951-1980 as the reference period for anomalies. The data source is here.
Update: The February 2013 GISS global temperature anomaly is 0.49 deg C. It dropped -0.11 deg C since January 2013.

GISS LOTI
UK MET OFFICE HADCRUT4
Introduction: The UK Met Office HADCRUT4 dataset merges CRUTEM4 land-surface air temperature dataset and the HadSST3 sea-surface temperature (SST) dataset. CRUTEM4 is the product of the combined efforts of the Met Office Hadley Centre and the Climatic Research Unit at the University of East Anglia. And HadSST3 is a product of the Hadley Centre. Unlike the GISS and NCDC products, missing data is not infilled in the HADCRUT4 product. That is, if a 5-deg latitude by 5-deg longitude grid does not have a temperature anomaly value in a given month, it is not included in the global average value of HADCRUT4. The HADCRUT4 dataset is described in the Morice et al (2012) paper here. The CRUTEM4 data is described in Jones et al (2012) here. And the HadSST3 data is presented in the 2-part Kennedy et al (2012) paper here and here. The UKMO uses the base years of 1961-1990 for anomalies. The data source is here.
Update: The February 2013 HADCRUT4 global temperature anomaly is +0.48 deg C. It increased +0.05 deg C since January 2013.

HADCRUT4
NCDC GLOBAL SURFACE TEMPERATURE ANOMALIES
Introduction: The NOAA Global (Land and Ocean) Surface Temperature Anomaly dataset is a product of the National Climatic Data Center (NCDC). NCDC merges their Extended Reconstructed Sea Surface Temperature version 3b (ERSST.v3b) with the Global Historical Climatology Network-Monthly (GHCN-M) version 3.2.0 data for land surface air temperature anomalies. NOAA infills missing data for both land and sea surface temperature datasets using methods presented in Smith et al (2008). The data source is here. NCDC uses 1901 to 2000 for the base years for anomalies.
Update: The February 2013 NCDC global land plus sea surface temperature anomaly is +0.58 deg C. It increased +0.04 deg C since January 2013.

NCDC
COMPARISON
The three datasets are compared in the next two time-series graphs. The first graph compares the GISS, HADCRUT4 and NCDC global surface temperature anomaly products starting in 1979. It also includes the linear trends. Because the three datasets share common source data, (GISS and NCDC also use the same sea surface temperature data) it should come as no surprise that they are so similar. For those wanting a closer look at the more recent wiggles, the second graph starts in 2003. Both of the comparisons present the anomalies using the base years of 1981 to 2010. Referring to their discussion under FAQ 9 here, according to NOAA:
This period is used in order to comply with a recommended World Meteorological Organization (WMO) Policy, which suggests using the latest decade for the 30-year average.

Comparison Starting in 1979
###########
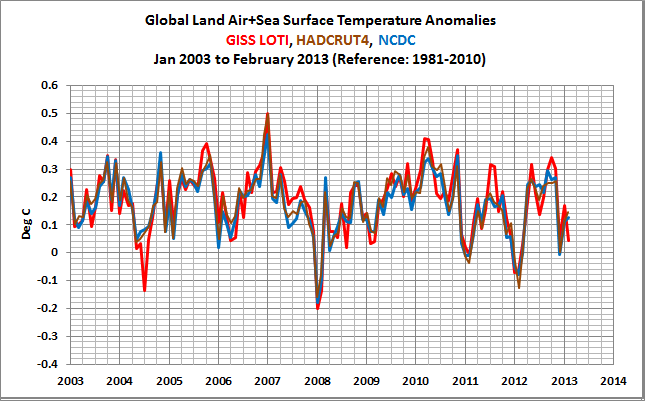
Comparison Starting in 2003
AVERAGE
The last graph presents the average of the GISS, HADCRUT and NCDC land plus sea surface temperature anomaly products. The flatness of the data since 2001 is very obvious, as is the fact that surface temperatures have rarely risen above those created by the 1997/98 El Niño.

Average of Global Land+Sea Surface Temperature Anomaly Products
I enjoyed the presentation. However, I am not as informed as most of the commentators—so I have some naive questions. [As you will see I need a Temperature101 reference.]
There was a reference to ”common source” and, also somewhere above to ”raw data”
My question is: Is there some post or article that explains where the groups get the original numbers that they use? Are these original numbers publicly available somewhere? These groups are all based in the U.K./U.S. What is their source, for example, for numbers in Africa? Russia?, etc.
One reference in the article was to
http://www.ncdc.noaa.gov/ghcnm/v3.php
which has as part of its explanation:
”data were developed using version 3.0.0 station data and quality control and homogeneity adjustment methods. ”
Is this the common source? The Wikipedia article on GHCN seems to suggest that station data is collected here. Is that correct? [So this is common source of land numbers?] Do numbers go here and then to Hadley Center? Are unadjusted numbers available.?
Steven Mosher says: “Also wrong. The final SST product has land values blended into the SST cells.”
Are we discussing NCDC? Please advise where in Smith et al (2008) they specifically discuss the blending of land surface temperature data with sea surface temperature data in areas of seasonal sea ice.
http://www.ncdc.noaa.gov/oa/climate/research/ersst/papers/SEA.temps08.pdf
Nylo says:
April 1, 2013 at 9:05 am
…. Some of our water reservoirs, which had never ever been full since their creation, are now full and evacuating water due to their dangerous levels…..
>>>>>>>>>>>>>>>>>>>>>>>>
The reservoir (B. Everett Jordan Reservoir) in my neck of the woods (North Carolina) has water up the tree trunks it is so full. This is after the ‘drought’ last summer.
It was looking like this and now looks like this as of last week. It is a 21.78 sq miles (56.42 km²)
Theories are never falsified. They are typically amended to make sense of new information.
This is partly true, but more accurately stated as,
Most theories are never falsified. They are typically amended to make sense of new information, until a superior theory gains acceptance.
Both Popper and Kuhn were correct. A theory can be falsified, or simply replaced by a superior theory. Superior meaning greater explanatory power or utility.
One of the problems I see in climate science is the forcings theory can’t be falsified by any feasible experiment (Trenberth’s missing heat being an example where when the predicted heat wasn’t where it was supposed to be, the argument from the theory’s proponents is, it must be somewhere else), and other theories of climate change have very limited acceptance.
As Kuhn pointed out, scientists have to have a paradigm (theory) to work within, and most scientists don’t question the paradigm.
Hi Bob-san:
With the current very weak “La Nina” (if that’s the proper term for it considering it never fell much below -0.5C) seeming to have already played itself out, this would mark the third La Nina’s in a row with no real El Nino occurring between them.
Wouldn’t this relatively rare triple-dip La Nina event tend to cause the next El Nino to be quite strong?
Your comments on this would be most appreciated.
Thank you.
SAMURAI says: “Wouldn’t this relatively rare triple-dip La Nina event tend to cause the next El Nino to be quite strong?”
The 2012/13 “ENSO season” will most likely fall into the ENSO neutral category, so there really wasn’t an “official” triple-dip La Niña. In fact, there were El Niño conditions during September and October of 2012.
Back to your question: I would agree with you IF all La Niña events created excessive build-ups of warm water in the tropical Pacific, but they don’t. Lots of warm water was created during the 3-year La Niña events of 1973-76 and 1998-01, but the ocean heat content of the tropical Pacific did not respond the same to the double-dip La Niña of 2007/08 & 2008/09 and the second double-dip of 2010/11 and 2011/12.
http://bobtisdale.files.wordpress.com/2013/03/linked-trop-pac-ohc.png
The really unusual La Niña in the graph was obviously the one in 1995/96.
rdr200: Sorry for not replying sooner. I was attending a family gathering.
I’ve never written a blog post that discusses all of your questions—in fact, I don’t present and discuss land surface air temperature data that often. You may be able to find answers to some of your questions at Anthony Watts’s Surface Station Project website and through links posted there:
http://www.surfacestations.org/
There’s lots of discussion on this thread about the “AGW or CAGW theories”.
I assume you’re using the word “theory” in its conjectural (not factual) sense, since it’s never been proven.