Guest Post by Willis Eschenbach
There’s an interesting measure of atmospheric CO2, called the “airborne fraction”. The airborne fraction is the fraction of the CO2 emitted each year which remains in the atmosphere. When humans emit say 9 gigatonnes of carbon, only about half of that remains in the air. The other half of the emitted carbon is absorbed, “sequestered” in some semi-permanent fashion, by various carbon sinks in the land and the ocean.
Dr. James Hansen of NASA, another in the long line of climate alarmists who don’t mind shafting the poor with expensive energy, has come out with a most surprising statement in his latest paper, Climate forcing growth rates: doubling down on our Faustian bargain, hereinafter Hansen 2012. The statement involves Hansen et al.’s explanation for a claimed recent decrease in the airborne fraction. Here’s their graphic showing the changes in the airborne fraction since 1960.
 Figure 1. Hansen 2012 Figure 3. I’ve added a vertical line highlighting June 1991.
[ORIGINAL CAPTION] Fossil fuel CO2 emissions (left scale) and airborne fraction, i.e., the ratio of observed atmospheric CO2 increase to fossil fuel CO2 emissions. Final three points are 5-, 3- and 1-year means.
I do wish people would show the underlying data and not just averages, but setting that aside, here are the authors’ claims about the drop in the airborne fraction (blue line) post 2000:
We suggest that the surge of fossil fuel use, mainly coal, since 2000 is a basic cause of the large increase of carbon uptake by the combined terrestrial and ocean carbon sinks. One mechanism by which fossil fuel emissions increase carbon uptake is by fertilizing the biosphere via provision of nutrients essential for tissue building, especially nitrogen, which plays a critical role in controlling net primary productivity and is limited in many ecosystems (Gruber and Galloway 2008). Modeling (e.g., Thornton et al 2009) and field studies (Magnani et al 2007) confirm a major role of nitrogen deposition, working in concert with CO2 fertilization, in causing a large increase in net primary productivity of temperate and boreal forests.
This is an interesting argument, but it has a few moving parts. Let me list them.
1) Increased coal use leads to increased net primary productivity (NPP) .
2) Increased NPP is evidence of increased carbon absorption.
3) Increased carbon absorption leads to increased biologically driven carbon sequestration.
4) Increased biologically driven sequestration explains the post-2000 decrease in airborne fraction.
I’m good with claims number 1 and number 2, but from there they get increasingly unlikely for various reasons. I’ll go get the data and show the actual airborne fraction, but first, let me quote a bit more from Hansen 2012, this time regarding Pinatubo.
Remarkably, and we will argue importantly, the airborne fraction has declined since 2000 (figure 3) during a period without any large volcanic eruptions. The 7-year running mean of the airborne fraction had remained close to 60% up to 2000, except for the period affected by Pinatubo.
and also …
Thus we see the decreased CO2 airborne fraction since 2000 as sharing some of the same causes as the decreased airborne fraction after the Pinatubo eruption (figure 3).
I looked at the chart, and I looked at the dates. Pinatubo was in June of 1991. Here’s what I get from the data:
 Figure 2. Annual airborne fraction (red line), along with 7-year average (blue). Green line shows theoretical airborne fraction assuming exponential decay of excess CO2.
So to start with, from both his graph and mine I’m saying absolutely no way to Hansen’s claim that there was a “decreased airborne fraction after the Pinatubo eruption”. Hansen seems obsessed with Pinatubo. He previously has claimed (falsely) that it represented a successful test of his GISS climate model. See here, here , and here for a discussion of how poorly the models actually did with Pinatubo.
He is now claiming (again falsely) that there is some drop in the airborne fraction after Pinatubo. I’m sorry, but that’s a totally false statement. There’s no sign of any unusual drop post-Pinatubo in this record at all, neither in the annual data nor in the average data. The majority of the drop he seems to be pointing to occurred well before Pinatubo occurred …
In passing, let me comment that any reviewer who let any of that Pinatubo nonsense past them should resign their commission. It was the first thing I noticed when I looked at the paper.
There’s a second problem with what Hansen et al. have done. They say regarding their 7-year average (blue line) that: Final three points are 5-, 3- and 1-year means. Sadly, this means that the final point in the 7-year average is forced to be equal to the last point in the raw data … easily the worst choice of ways to handle the final points of any average, almost guaranteed to have the largest error.
But that method does have one advantage in this case. It greatly exaggerates the amount of the recent drop. Note for example that had the data ended one year earlier, the final point in his average would have had a value 60% … here’s what the 7-year average figured their way would have looked like if the data had ended in 2010.
 Figure 3. As in Figure 2, but with the 7-year average ending in 2010 using their method. Note that the final point is forced to equal the 2010 value.
As you can see, their curious treatment of the 7-year average at the end of the data is the only thing that makes the trend look so bad. When changing the data length by one year makes that kind of change in an average, you can assume that your results are far, far from robust.
But neither of those is the main problem with their claim. The main problem is that the general slight decrease in the airborne fraction is an expected result of the exponential decay of the excess atmospheric CO2. As the green line shows, the actual results are in no way different from the value we’d expect to see. The green line shows the result of the exponential decay of the excess CO2 if we assume a half-life of about 46 years. The expected value decreases slightly from 1970 to 2011.
It’s worth noting that if CO2 emissions leveled off entirely, the airborne fraction would gradually decay to zero. This is because if emissions level off, eventually the excess CO2 level will be such that the annual sequestration will equal the annual emission with nothing to remain airborne.
To close, let me return to their claim:
We suggest that the surge of fossil fuel use, mainly coal, since 2000 is a basic cause of the large increase of carbon uptake by the combined terrestrial and ocean carbon sinks.
I must confess that I hadn’t looked at fuel use by type in a while, so I was unaware of a large spike in coal use.
 Figure 4. Carbon emissions by fuel type. Note the steady rise of natural gas, which will only increase with the advent of fracking.
So yes, coal use has indeed spiked since 2000, with a jump in coal emissions putting it back out in front of oil. I assume, although I’ve not checked, that this is the result of the huge increase in coal for electricity generation in India and China. And good on them, the folks in that part of the planet desperately need cheap energy.
Returning to the claims in Hansen 2012, it is true that the carbon uptake by the various sinks has constantly increased over time. This increase, however, appears to be much more related to the exponential decay of the CO2, and has less to do with the changes in the biosphere. We know this because the change in the amount sequestered is much larger than the change in the NPP.
Here are the figures. In 1960 the natural sinks were sequestering about 1 gigatonne of excess carbon annually. By 2011, this had risen to 4.5 gigatonnes annually. I agree that CO2 fertilization is real, but clearly this 4.5-fold increase in total tonnage of excess carbon sequestered cannot all be the result of increased NPP from CO2 fertilization.
So while I’m glad to hear that Hansen thinks that coal is good for something, I fear his explanation for the increase in the amount sequestered is not correct. The increases in the amount sequestered have been much, much larger (450% since 1960) than the increase in the amount of sequestration due to greater NPP.
Before I leave, let me remind folks what cheap electricity and energy from coal does for us all, rich and poor alike, every day of the year.
 Figure 5. Daily output of coal energy. SOURCE
That huge benefit to the poor and the rich is what Hansen is trying to get rid of … but he and others have very little with which to replace it. So all that happens is that the price of energy goes up, and the poor once again are impoverished the most.
Brilliant plan, that fellow Hansen truly cares about the future … he just doesn’t seem to care if he hurts people in the present.
My best to everyone,
w.
Nick Stokes says:
March 30, 2013 at 1:55 pm (Edit)
Ah, I see. The problem is that we’re discussing the airborne fraction. Since we don’t have monthly emissions data, we can’t use monthly CO2 figures. We have to average them to annual values to match the emissions data.
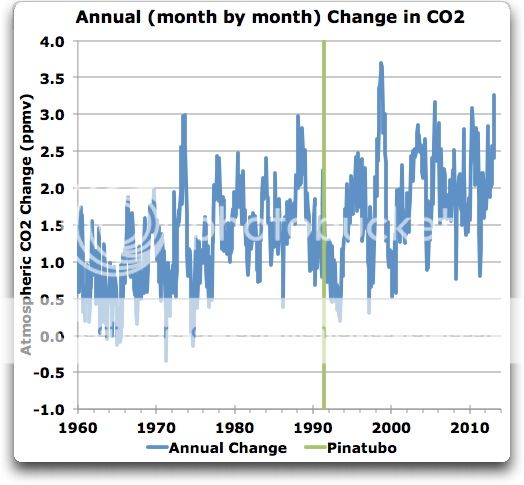
Here’s my problem with your claim. I’ve graphed the month-over-month changes in the manner you suggest, e.g. subtracting Dec 1991 from Dec 1992 and so on for all the months. Here’s that result:
If you can distinguish between the pre- and post-Pinatubo drops, you’ll have to explain how. In fact, the post-Pinatubo period is not in any way different from a host of other drops at other times.
Actually, I was simply looking at the wrong years, your emissions figures were correct.
w.
Ferdinand Engelbeen says:
March 30, 2013 at 12:51 pm
….
Many of these conditions may be the limiting items for plant growth in the real world, not CO2.
And in many cases it is CO2.
The greening effect of CO2 can be measured and greening of the planet is observed by satellites.
Willis,
Please read Tommy Gold on the subject before being so dismissive of abiotic hydrocarbons on Earth.
Gold doesn’t dismiss the idea that some hydrocarbons may be formed by biological action.
richardscourtney says:
March 30, 2013 at 1:36 pm
Your assertion is supported by the dubious ice core data (which you cite) and refuted by the sparce stomata data (which you do not mention).
Come on Richard, I have defended the reliability of the ice core CO2 data several times here at WUWT against who believes the claims of the late Jaworowski, as good as the unreliability of the stomata data which have the same problems as many of the pre Mauna Loa chemical measurements on land midst huge sources and sinks…
The ocean surface layer is mostly governed by biotic activity and not simple inorganic chemistry.
The biotic activity as well as the variations in inorganic carbon are monitored at a few places since a few decades, where Bermuda represents most of the North Atlantic. That shows that the average increase in total inorganic carbon in the mixed layer in the North Atlantic over the past decades was about 0.6 +/- 0.3 GtC/yr. The +/- 0.3 GtC/yr variability in sink rate is partly a result of biotic activity, partly winter mixing depth and partly sea surface temperatures.
Moreover, any substantial CO2 release from the oceans (even more with high biotic activity) would increase the d13C level of the atmosphere, but the ocean surface d13C level follows the steep d13C decline of the atmosphere… See:
http://www.sciencemag.org/content/298/5602/2374.abstract
And I will know when the edifice of assumptions is replaced by empirical evidence.
The oxygen balance is empirical evidence that the biosphere as a whole is a net sink for CO2 and thus not the cause of the 13C/12C ratio decline in the atmosphere or the oceans. The higher 13C/12C ratio of the oceans and practically all other CO2 sources compared to the atmosphere proves beyond doubt that the oceans can’t be the cause of the CO2 increase in the atmosphere. Thus the scientific evidence lies before you that no known natural source is the cause of the increase. Do you really want to know? Or don’t you want to admit that humans are the cause of the increase, because that is one of the pilars of the AGW case?
Dudes, I’m not conflating anything. I’m only concerned about half of the equation. Did I say anything about equilibrium regarding 14C? You can infer anything you want, and actually, that could lead to an interesting part 2. I was beginning to get into that a little in the second paragraph.
The point is, whatever WE put into the atmosphere, now we know it must pass through another reservoir, via a natural process, with a half life of 10 years. Knowing half of the equation allows us to put constraints on the other half. Humans certainly injected CO2 into the atmosphere from burning fossil fuels. We know the increasing ppm CO2 is not due to CO2 failing to pass through a biologically mediated reservoir, e.g. alkalinity in water. If there is more CO2 in the air, it is because the equilibrium shifted. It isn’t there because it can’t go anywhere else. Why the equilibrium shifted is the interesting question.
Why should Hansen care if the poor suffer? He is not poor, he has made no effort to reduce his use of energy towards the levels of those of us of modest means even, let alone the poor. He will not even have to see them suffer, for they are black people in Africa, and he is a white man in America.
att Mr Willis Eschenbach
allow me to quote your article:
“He (Hansen) is now claiming (again falsely) that there is some drop in the airborne fraction after Pinatubo. I’m sorry, but that’s a totally false statement. There’s no sign of any unusual drop post-Pinatubo in this record at all, neither in the annual data nor in the average data. The majority of the drop he seems to be pointing to occurred well before Pinatubo occurred …”
“In passing, let me comment that any reviewer who let any of that Pinatubo nonsense past them should resign their commission. It was the first thing I noticed when I looked at the paper.”
dear Mr Eschenbach,
here you are quite negative about Hansen, his article and his scientific statements;
however, in my opinion you are not fair here, to me you seem seem a litlle biased and/ or uninformed:
in his article Hansen is referring in this matter to reference 12 (Gloor, Sarmiento and Gruber) who in their paper adress the effect of Mt Pinatuba eruptionr;
this is very interresting reading from which I take just one quote:
“The onset of increased land uptake in the early 1990’s is actually before the Pinatubo eruption as noticed by Keeling et al. (1995). To our knowledge the mechanism for this early onset remains unclear.”
I am sure Hansen noticed the importance of this statement, so he provided us with a link to this article, with the best will of the world, I don’s see here any false statement by Hansen;
next to that,
Gloor et al are referring to Keeling et al (1995)
here is also interesting reading about the Pinatubo matter:
for instance, you can see here the basics of Hansen’s figure 3 (CO2 airborne fraction) ;
next to that, its would probably be nice for your readers to know that the blue Pinatubo line you draw in YOUR Figure 2 seem to be copied from Figure 2a from the Keeling article (Nature June 1995);
It would be nice if you mention such a ‘citation’, especially while you are complaining about Hansen and “any of that Pinatubo nonsense” while these scientists including Hansen already saw in 1995 the difficulty with the Pinatubo vs CO2 decline timing,
let me quote again:
“Is the Pinatubo vulcanic eruption of June 1991 implicated in this dramatic downward anomaly?”
Keeling et al (and Hansen) were and are well aware of the fact that the decline started in 1989 and that it kept on going declining after Pinatubo, at least until 1994 (according to figure 2a from Keeling et al)
Mike Borgelt says:
March 30, 2013 at 4:46 pm (Edit)
I read Gold when it was first published … how about you?
I did not say anything “dismissive” about abiotic hydrocarbons.
Great. And I don’t dismiss the idea that some hydrocarbons may be formed by abiotic action. Makes us about even.
Look, here’s the thing. We know that through the application of heat and pressure organic materials can be turned into oil. Not only that. We know what each step in the process both looks like and what is happening chemically. We have examples of the rocks at all stages of the process. It’s a whole field of scientific study, we understand the processes involved quite well.
And using that knowledge has allowed us to reap an immense bounty, and correctly identify and utilize huge stores of oil.
So that’s the biotic side. We’re quite clear that exists and how it works.
We also know that methane is fairly commonly created in nature. It exists on many planets and moons. In addition, we know that under extreme heat and pressure, in the presence of natural catalysts such as iron oxide methane will form heavier hydrocarbons. These processes are likely to be responsible for the discovery of oil in areas which are NOT included in the normal biotic pathway for oil, although there are competing hypotheses.
So that’s the abiotic side. There is no evidence that most of the oil harvested to date is abiotic. There is evidence that some abiotic oil exists and can be brought into production.
As a result, I see the whole IS/ISN’T argument about oil as a fool’s quarrel. Yes, there appears to be some abiotic oil out there … so what? Nobody’s found any huge deposits, and people have looked, it won’t affect things for a long time if it is found, it will be deep and hard to get at … so what?
w.
Studies have shown that at 1,000 ppm CO2, many plants use significantly less water and yields are higher. Very interesting why this is never mentioned. Below 200ppm, plant life stalls.
Perhaps humans were put on this earth to recycle the Carbon buried beneath the earth during the Carboniferous Era?
Martin van Etten says:
March 30, 2013 at 5:51 pm
Thanks, Martin, but I’ll pass on other people’s words. I’m discussing Hansen’s words. I’m sure that others are more careful and more accurate than Hansen, so it’s of little use to refer me to the words of others. Instead I refer you again to Hansen’s words, viz:
and
You see anything in there about the decrease starting well before Pinatubo? Because I didn’t.
As you point out, someone else noticed a change in land uptake before Pinatubo … so what? Read Hansen’s statements above. He ascribes the whole depression in airborne fraction to Pinatubo.
You go on:
First, you haven’t presented a scrap of evidence that Hansen either saw, or if he did see that he understood, that the decline started well before Pinatubo. He certainly makes no reference to that in the paper, so if he knew it, why was he ascribing the dip to Pinatubo?
More important, you accuse me of bad faith for not citing the “blue Pinatubo line” that I draw in my figure. You say I should acknowledge that I copied it from Keeling, come clean and confess my wrongdoing …
My friend, I have no clue what Keeling paper you’re on about, never seen it. I got the “blue Pinatubo line” by cleverly utilizing the following arcane method.
1. I remembered that the Pinatubo eruption was in June 1991
2. I checked the date on the web so I didn’t bite myself through lack of due diligence, and yes, I was right.
3. I drew a blue vertical line on the graph at June of 1991, and labeled it “Pinatubo”.
… and you want me to confess to copying it from Keeling? That’s your best shot? It’s the freakin’ DATE of the Pinatubo eruption, Martin, it’s not “copied” from anywhere.
You continue:
Hansen may have been aware, although you provide no evidence to support that claim.
Either way, his statements in this particular paper make absolutely no mention of that. Instead, he ascribes that depression in airborne fraction all to Pinatubo. I don’t see the evidence in the record that Pinatubo did much of anything like what people claim …
Look again at Figure 1. That’s Hansen’s graph … except he left out the vertical line. Are you seriously claiming that there was some significant post-Pinatubo depression in the airborne fraction?
w.
Sometimes poets have difficulty letting go. One more time.
Old “Death Train” Hansen
Always Good For A Laugh
More holy-than-thou
He warns us of Venus
The only thing now
That hardens his penis
He rants at the crowds
A coot with the hypers
His mind in the clouds
A load in his diapers
He quotes from the Greens —
We work for the many!
(Diversity means
The colors of money
He quotes from the Reds —
Consensus is dictum!
(Good socialist heads
Are all up one rectum
A fascist he cries —
This Goebbels of weather —
The truth is in lies!
The bigger the better!
So just like a skunk
His sight is alarming
His science is junk
There’s no global warming
michaelwiseguy says:
March 29, 2013 at 10:19 pm
No Stunad. CO2 is greening the planet.
The comment section in this article is priceless;
Sen. Inhofe ‘proud’ to be target of climate flick ‘Greedy Lying Bastards’
“Sen. James Inhofe (R-Okla.) sees criticism of him in a recent documentary about climate change as a badge of honor.
A bit OT but please someone tell me how to pronounce Senator Inhofe’s name. It is not obvious and as a UK citizen who admires him I cannot say his name with any confidence.
Thank you
Ferdinand Engelbeen:
I am replying to your post addressed to me at March 30, 2013 at 4:55 pm as a courtesy to show that I have not ignored it.
As I said, others can assess the totality of our disagreement by searching WUWT and I do not intend to yet again repeat the arguments to no purpose. Our difference is summarised by your post I am answering so others can assess our different views by considering it.
There fore, I quote from your post and provide you with the ‘last word’.
At March 30, 2013 at 1:36 pm I said those who claim they know the cause of recent rise in atmospheric CO2 concentration are selective of the data they consider, and I wrote to you
Your reply to that says in total
Happy Easter.
Richard
Willis,
My comment was based on your assertion that we know coal is of biotic origin because it is full of plant fossils. IIRC Gold addresses this and shows that this does NOT prove that coal is of biotic origin.
Maybe I’ve read Gold more recently than you have.
att Willis Eschenbach
maybe it is a good idea that should read those articles Jim Hansen is referring to, before you start breaking Hansen down;
they are part of the discussion;
by the way, Hansen writes ‘affected’ ; you are probably a native English speaker, so you know what is ment by ‘Affected’
Hoser says:
March 30, 2013 at 5:27 pm
The point is, whatever WE put into the atmosphere, now we know it must pass through another reservoir, via a natural process, with a half life of 10 years.
All we know from the 14C bomb spike is that there is a huge exchange between the different reservoirs, but that says next to nothing about what happens with an excess amount of CO2 above equilibrium. The 14C bomb spike was in a 10^-12 ratio to 12C in the atmosphere, thus didn’t add any substantial amount to the CO2 mass in the atmosphere.
It only says something about the exchange rate between the reservoirs and the distribution of CO2 over these reservoirs. The 14C bomb spike, CFC’s and other human made stuff is used as tracer in a lot of investigations of ice cores, ocean flows, plant absorption, etc.
In contrast, the human addition in total mass is about twice the increase in the atmosphere since about 1850. Thus whatever the actual exchange rate, it seems that the exchange rate is hardly influenced by the extra mass (and thus partial pressure) of the extra CO2, because the app. 150 GtC exchange fluxes in equilibrium only changed to 150 GtC in and 154 GtC out (or 148 in and 152 out, doesn’t matter at all, only the difference is known with reasonable accuracy).
The equilibrium setpoint didn’t change that much over time. We know the ratio between temperature and CO2 levels over the past 800 kyr: a change of 8 ppmv/°C with a lag of CO2 after temperature changes at a – for a natural process – high correlation (0.87). The resolution of the oldest ice cores (500-600 years) is not sufficient to exclude any more rapid cycle, but sufficient to exclude the current increase of 100 ppmv in 150 years, if that is a one-sided event.
More recently, the Law Dome ice core over the past 1000 years has sufficient resolution (about 20 years) to show the effect of the LIA: a drop of about 6 ppmv for a drop of ~0.8°C with a lag of about 50 years. Again near 8 ppmv/°C.
The setpoint change caused by the warming since the LIA thus is good for a maximum 8 ppmv CO2 increase in the atmosphere, if we may assume that the temperature increased with maximum 1°C.
The rest of the measured 100+ ppmv increase is by something else, whatever that may be…
att: Willis Eschenbach
I take back the accusation of plagiarism, (I thought you did read the articles Hansen is referring to under reference 12)
Ferdinand Engelbeen says:
March 31, 2013 at 3:19 am
Mostly I agree with what you are saying. However, it is doubtful ice actually has the resolution you are looking for in terms of the rate of change. Ice is far more fluid than people imagine. Hydrogen bonds are forming and breaking all the time in ice, even more so around non-water molecules. Thus, diffusion is an important process, which is likely not well characterized in ice. Others have discussed whether the bubbles seen in ice are properly associated with the age of the ice layer in which they are found today. Extending that argument, it is very likely there is exchange of gasses in and out of the ice and bubbles, It would not surprise me if we determined the bubbles shrank over time while moving up. Consequently, ice core data may be blurred and dimmed with short term changes on the order of a century or more not clear and not accurately representing the gases present at the time the water was deposited as ice.
Clearly, a 100 ppmv increase from 300 ppmv indicates the equilibrium has not shifted by much. Our production of CO2 is a tiny fraction of the total in the various reservoirs. I’m trying to remind people the CO2 we produce passes through other reservoirs with a half-life of 10 years. It could be trapped there, but it isn’t. Why not? Equilibria are established by a balance of on-rate and off-rate from the source pools. Knowing half of the equation means we can place limits on the behavior of the other half. If 14CO2 spike leaves the atmosphere with a half-life of 10 years, then any CO2 emitted on say any particular day will pass into another CO2 reservoir at the same rate. I’m not saying anything about the total amount of CO2 in the atmosphere, except 1) the last century rise doesn’t seem remarkable, 2) there is nothing particularly worrisome about it.
I am very concerned about the attempts by governments to use this phenomenon in writing regulations and laws to control people and getting away with it by generating unfounded fear in the population. No one has been a stronger voice of reason against government-backed climate alarmism than Vaclav Klaus (http://www.klaus.cz/clanky/2266).
How’d the peer reviewers miss it too?
Mike Borgelt:
At March 31, 2013 at 2:54 am you say to Willis,
I am not competent to discuss formation(s) of oil but I operated a lab. which conducted maceral analysis of coal for several years.
Coal is certainly comprised of fossilised plant material and forest fires with some addition of soil (i.e. ash minerals) and nothing else. Maceral analysis uses microscopy to examine coal samples, and identifies the observed extremely compressed components of plants to determine the source and nature of a coal
Each and every stage of coalification of each and every type of coal is observed to be happening in the world now.
Coal is biogenic: all of it is.
Richard
Willis Eschenbach says:
March 30, 2013 at 12:15 pm
What I’m trying to say, Ferd, is that I don’t have a clue what “intolerance” you are babbling about.
=============
Apologies. nothing to do with you or your article Willis. for technical reasons the posting ended up in the wrong article.
to me, one of the best features of WUWT is that it allows what on the surface might appear to be preposterous theories to be discussed, because that is typically when we see the greatest advance in ideas. when we discuss what is already agreed, then advances are small at best.
By intolerance I was referring to the practice of limiting or censoring comments, as routinely practiced at RC. I think there is a danger to WUWT in following the practice, no matter how good the reasons. the road to hell is paved with good intentions.
I forget the source, but a quote comes to mind, something along these lines: “we are here today to discuss your preposterous theory. the question before us is whether it is preposterous enough that it might actually be correct”.
richardscourtney says:
March 31, 2013 at 5:28 am
Coal is biogenic: all of it is.
============
given the large deposits of peat found on the surface, it is possible even likely they are the source of coal. the problem is that we don’t see comparable large reservoirs of animal remains that are proposed as the source for other fossil fuels.
limestone + water + iron + heat ===> methane + rock
the above reaction appears possible, even likely due to plate techtonics. limestone is fossilized CO2, so technically this would be fossil fuel. but not derived from animal or plant remains. active biology may be also play a part within the earth’s crust. providing the necessary enzymes to catalyze the reaction.
http://wattsupwiththat.com/2013/03/27/enivronmentalists-worst-nghtmare-gmod-frankenbugs-could-make-fuel-from-directly-co2/
Margaret Smith, take it from an Okie, it is pronounced In-hoff.
Burn that coal — help green our planet.
You’ve just got to love James Hansen’s new epiphany:
Burning old buried decayed trees is really better than burning our forests.
You’ve also got to love James Hansen’s next epiphany:
No, you really can’t accurately measure a temperature from 1200 kilometers away.
Making good progress in your treatment plan Jimmy, keep your chin up and out of jail.
Mike Borgelt says:
March 31, 2013 at 2:54 am
Thank, Mike. I’m sure you’ve read Gold more recently than I did. I have no recollection of Gold claiming that the plant fossils in coal meant that it was of abiotic origin … you’ll have to cite that one.
w.