Guest post by David Archibald
Climate has real world consequences, and those operating in fields that will be affected by changing climate bring a different perspective to the problem of predicting what will happen. Bill Fordham, advising the grain industry in the Midwest, kindly sent me a copy of the advice he provides to his clients. Following are two of his charts:

In Bill’s words,” Here is a chart of the 11-Year Sunspot Cycle you have probably never seen before! It is an 11-Year Average of the Monthly Sunspot Data. Why do I think it is important to look at an 11-Year Average? Because I am interested in how the ongoing 11-Year Average acts as we go forth in time with the droughts in the 1930’s and 1906.
I am also greatly interested in how the ongoing 11-Year Average acts as we go forth in time with the “Little Ice Age” that bottomed in 1816, the “Year Without A Summer”! The 1816 Eleven-Year Average Bottom was 327 months from the 1788 Eleven-Year Average Peak. If Sunspot history repeats similar to the 1788-1816 cycle, 327 m onths from the April 1990 Eleven-Year Average Peak will be in July 2017. For what it’s worth, the rate of decline since the 60 level was broken in April 1990 projects an 1816 level of 14.2 in just 44 more months from now, or by October 2016. If the current rate-of-decline in the 11-Year Average stays on track for another 44 months, we may need a few more blankets!”

This graph of Bill’s plots Solar Cycles 22 to 24 over Solar Cycles 3 to 6. What is interesting about this graph is that it suggests that the Sun has a limited playbook. Solar Cycles 22 and 23 are very similar in size and shape to Solar Cycles 3 and 4. But we are now coming up to big departure from how Solar Cycle 5 played out. To put that into context, let’s revisit the last prognostications of the Solar Cycle 24 Prediction Panel of 8th May, 2009. Four years ago, they said that,”solar maximum is now expected to occur in May, 2013.” They got it right, possibly to the month, or at least very close. As solar cycle length is more important in controlling climate than solar cycle amplitude, it doesn’t matter so much that they got the amplitude wrong.

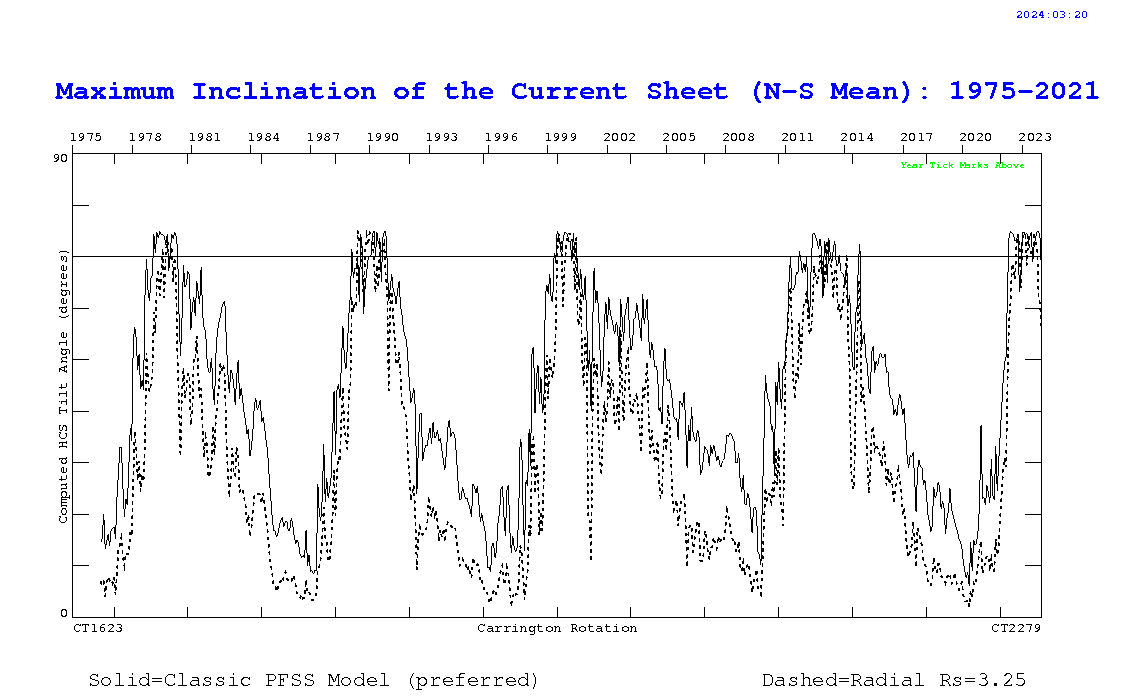
The above figure of the heliospheric current sheet from the Wilcox Observatory tells us that we are at the peak of the solar cycle, even though peak sunspot number was some time ago.
Now that we are at solar cycle maximum, there is only one prediction of future solar activity extant from the solar physics community. That is Livingstone and Penn’s estimate of Solar Cylce 25 maximum amplitude of 7. But the important number from here, the parameter that tells us what climate is going to do, is the time to the flattening of the heliospheric current sheet at the 24/25 minimum. So far the monthly sunspot number of Solar Cycle 24 has tracked Solar Cycle 5 very closely. Solar Cycle 5 was 12 years long. If Solar Cycle 25 is also to be 12 years long, the year of 24/25 minimum would be 2020. The climate implication of that is no net cooling over Solar Cycle 25 relative to Solar Cycle 24.
But there is a parameter which tells us exactly how long Solar Cycle 24 will be. That is the green corona emissions diagram produced by Richard Altrock, manager of the USAF coronal research program at Sacramento Peak, New Mexico. This is that diagram from June 2011:

I have annotated it to show the solar cycles over the same period. In his public statement, Altrock noted that Solar Cycle 24 was 40% slower than the average of the previous two cycles. That means that it is going to be 40% longer and that is borne out by the diagram. Solar minimum for the last four minima has occurred when emissions are exhausted at 10°. The latitude of 10° is shown as the red line on the diagram. Further to that, the last two solar cycles show that the month of minimum can be predicted by drawing a line between solar maximum (the point at which the rush to the poles intersects 76°) and the point of exhaustion at 10°. The bulk of activity is bounded by this line. On this line of evidence, Solar Cycle 24 will be 17 years long and the longest solar cycle for 300 years. We have a long wait ahead of us – half a generation.
While we are waiting for minimum, someone could do the world a very good service and take Bill Fordham’s interest in the droughts of the 1930’s and 1906 a bit further and calculate, on a year by year basis, what the Corn Belt would produce if the climate of the period 1800 to 1850 was repeated. Then we would know with enough certainty what we are in for – both the quantum and the volatility.
lsvalgaard says:
March 5, 2013 at 7:25 pm
What does that matter? – Now you are channeling Hilary Clinton.
donald penman says:
March 5, 2013 at 8:37 pm
Way back in 1991, Friis-Christensen and Lassen found that the cooling was over the following solar cycle. For the US Canadian border region, the heating/cooling relationship is 0.7 degrees C per year of solar cycle length. So if 24 is 4 years longer than cycle 23, then climate over solar cycle 25 will be 2.8 degrees C cooler than what it was over solar cycle 24, irrespective of the length or amplitude of solar cycle 25 itself.
Thank you David. By the way: I find your posts very interesting.
lsvalgaard says:
March 5, 2013 at 7:16 pm
Draw all the lines you like, it won’t make any difference. Let’s consult the oracle on the mountain, the mountain in question being Sacramento Peak. In his own words from:http://arxiv.org/abs/1002.2401
“Cycle 24 began its migration at a rate 40% slower than the previous two solar cycles, thus indicating the possibility of a peculiar cycle. However, the onset of the “Rush to the Poles” of polar crown prominences and their associated coronal emission, which has been a precursor to solar maximum in recent cycles (cf. Altrock 2003), has just been identified in the northern hemisphere. Peculiarly, this “Rush” is leisurely, at only 50% of the rate in the previous two cycles.”
Two words I am picking up are “slower” and “leisurely”. He even said that this cycle has the possibility of being peculiar. Peculiar in what way? In being much slower than normal, and slower means longer. Altrock gave a figure of 40% slower, which means 40% longer.
Further, my hunch is that the F10.7 flux falls out of bed once the heliospheric current sheet tilt angle starts falling again.
TSI is a poor measure of the Sun’s affect on the atmosphere. Before the Internet and Satellites, we relied on Short Wave radio for long range communications, especially for mobile communications. SW radio relies on a curious effect. As the sun shines on the atmosphere, the atmosphere ionizes and this ionization reflects radio waves back to earth. This allows a small SW transmitter to reach stations thousands of miles away using very little power.
Now, given that TSI is relatively constant, one would expect SW radio propagation to be relatively constant from one day to the next (propagation varies considerably from day to night). However, nothing could be further from the truth. SW radio propagation varies widely, in sync with sunspot activity. For example, at a strong solar maximum, a 10m radio can go 1/2 way around the world on 20watts of power. At solar minimum, the same radio might not be heard much beyond the horizon.
Given that the solar cycle has sun a large effect on SW radio propagation, while the TSI remains nearly rock solid, it seems likely there are more things in heaven and earth, TSI, than are dreamt of in your philosophy.
Mario Lento says:
March 5, 2013 at 11:11 pm
Thanks Mario. Nobody in the warmer community has dared touch Solheim et al’s paper, being afraid of what it might unleash. They can’t find fault with it.
As a layman I read these posts in awe and wonderment. Then a phrase like “year without summer” rings a bell. A volcano performed then, In the last few months I’m sure I’ve noted more comments across the net about earthquakes and volcanoes. Is there any correlation between volcanic activity and past sunspot minima?
The gradient of the blue line giving the predicted date of 2026 is different to the gradient of the other three blue lines. There is no justification for choosing the slope of the line giving the prediction, as it is at odds with the ‘trend’ shown by all of the other (limited) data. I would playfully guesstimate that it would happen in about 2018, quite close to the little isolated tick mark on the x axis, but that is on the basis of holding a ruler up against my computer screen; hopefully there is something more scientific available out there than drawing blue lines on a chart (or holding rulers up against a computer screen).
Human beings still cannot calculate the ocean tides with any degree of accuracy based on “understanding” the principles involved. Our mathematics cannot handle the complexity.
Instead, we calculate the tides by looking for repeating patterns, as early humans did to predict the seasons. Long before we understood the principles involved.
It seem reasonable that we repeat this process with solar activity as a means of prediction. I expect a solution to the sun from first principles is at least as complex as the tides and well beyond the capabilities of modern mathematics.
Many thanks David for a subject area that I find fascinating (having worked with aurorae affects on magnetosphere many years ago). I would like to see more evidence , if it does exist, on how low solar can influence cloud cover and therefore cooling. Has there been experimental or empirical evidence on how cosmic rays can impact cloud seed formations?
Charle H. says:
March 6, 2013 at 12:03 am
“Has there been experimental or empirical evidence on how cosmic rays can impact cloud seed formations?”
BREAKING NEWS – CERN Experiment Confirms Cosmic Rays Influence Cloud Seeds
http://wattsupwiththat.com/2011/08/24/breaking-news-cern-experiment-confirms-cosmic-rays-influence-climate-change/
Cosmic rays, climate and the CERN CLOUD experiment
http://cds.cern.ch/record/1492173?ln=en
Charle H. says:
March 6, 2013 at 12:03 am
While there is a correlation between cloud cover and GCR flux, it is not all that significant. There are very likely to be several forces at play. One of the bigger ones is the EUV flux, as detailed by the UK Met Office.
Thanks for the article. I’ve taken the opportunity to write yet another letter to my MP (Jo Swinson) to ensure that she is aware of the current expectations and the potential serious consequences.
Perversely my concerns are very contradictory:
1. That this subject has been sidelined by funders because of the stupid idiotic non-science from warmist researchers who have poisoned the atmosphere for real scientific inquiry.
2. Largely because we lack the expertise, WHEN THIS BECOMES A BIG PUBLIC ISSUE (which will probably arise because we have an exceptional winter which is just a natural variation fluke), the press will go nuts and race off to twits like Michael Mann who will no doubt see which way the funding wagon is running and change their spots to scare the public witless to enrich themselves at the expense of real science.
So, we have to get a firm scientific foundation to this subject BEFORE it becomes a problem BEFORE Mann, Hansen, etc. decide to milk it.
There is compelling scientific evidence to suggest climate variations and sunspots correlate, and hence the sun does have a significant influence.
http://physicsworld.com/cws/article/news/2008/oct/29/solar-activity-could-dictate-river-flow
I value these constasting views – even if there seems to be very little change in the messages from either side. I also see the risk that anyone can easily pick one of the positions presented and chose to use it as support for their own preconceptions – but also hope that this example makes it easier for people to understand how difficult it is to be impartial when assessing what can be deduced from the data. In terms of impartiality, I think Leif is doing a very good job of presenting the most accurate view of the data that he can, without trying to make predictions – despite his views not being favourable to many here.
For sure, if anyone can produce a solid theory connecting the sun and short term climate this will be very significant, and I am certain that there is considerable interest here. To date, it does seem that the accurate data sets are too short, and the potential couplings too poorly understood – but it is interesting to watch the data slowly appearing.
David Archibald says: Two words I am picking up are “slower” and “leisurely”. He even said that this cycle has the possibility of being peculiar. Peculiar in what way? In being much slower than normal, and slower means longer. Altrock gave a figure of 40% slower, which means 40% longer.
In the absence of knowledge, there is both a danger of reading too much into the data AND reading too little.
Also politics (small p) is hugely important. Apparently the Met Office in the early 20th century spotted the connection between sunspots and climate and pursued this. As most people know, the link appears to fade around 1980 and one has the feeling that those who advocated the sunspot link were then outed from power by a coop from the “anti-sunspot” brigade.
Perhaps those advocating a link to sunspots over-stated their case, but whether or not there was a valid reason to reject their views, the result has been that the UK Met Office has denied outright any link between sunspots and climate ever since.
The danger now, however, is that we get another reverse. That the sunspots become the in-thing in weather prediction.
But the real problem is a gross even criminal lack of funding into basic research into the link. And this isn’t just scientific funding. E.g. in the 1690s there were a series of severe famines in Scotland in a period which was wetter-colder. There will be a lot of archaeological information in deserted settlements in Scotland to tell us what was going on at that time and e.g. we may find that it was some kind of epidemic and not the climate that killed (up to?) a quarter of Scotland’s population
As far as I know, I am the world expert on this! Not because I have done much research … but because no one else has done any on the climatic links. This is just mind boggling stupidity by the political elite. Even ONE PhD would vastly increase our knowledge. But in the previous climate of “warming being the only problem facing humanity” … that wasn’t possible.
As for studying solar cycles … that needs to be done over many decades. In other words, the funding we put in today, will be key to understanding the Solar-earthClimate link in 30-40 years. The cost is minuscule in the scale of things, but the opportunity cost is HUGE particularly when we have no real idea how solar activity will effect the climate.
But, we need to get the basic science and particularly the scientific measurements in place well before we think there will be a problem, otherwise if (when) the shit hits the fan, it will be far too late.
michaelwiseguy says: “Not to disrespect Dr Svalgaard, but at some point someone has to stick their neck out and try to reasonably quantify the influence of our solar system’s heater(Sun) on the the climate of our third planet.”
What we need is to get the funding for an international scientific conference, to include a range of scientists from those advocating a link to those who dismiss it. We need them to review all the evidence AND QUANTIFY WHERE WE NEED BETTER INFORMATION.
And yes, ideally, if they could all discuss the evidence and then come up with some kind of report INCLUDING ALL VIEWS/INTERPRETATIONS that would give us a good idea of the current state of knowledge.
Then we need to arm-twist the funders into providing the funds for scientists, archaeologists, historians, botanists … to start compiling the information about past and future solar events.
And then we need to get the funding to repeat the conference
And, … we have to do it in a way that doesn’t create a bunch of crusading idiots ignoring all contrary evidence like the IPCC.
As is usual on such topics, David A puts forward a proposition (or theory, call it what you will) and Leif S leaps in with a “bah humbug!” response. Now, I’m not nearly clever enough to understand who is right (or, in all probability, less wrong) but what is pretty cool (ha!) is that we won’t have many years to wait until we find out.
This is, of course, in stark contrast to the warmistas, whose prophesies are all conveniently either so general as to be worthless or of such long timescales that we’ll all be dead before they come to fruition (or not as the case may be).
I believe that Dr. S has said in the recent past that we are living in interesting times. Now that IS true!
Arithmetic sum of the polar magnetic fields (N+S) doesn’t indicate an imminent SC24 max
http://www.vukcevic.talktalk.net/LFC6.htm
while March (SIDC) SSN number (I provisionally calculated) so far has started well, hovering around 70, which would suggest a possible second peak (previous one Nov.2011), but the spots are minnows
http://sdo.gsfc.nasa.gov/assets/img/latest/latest_1024_4500.jpg
It seems David is committed to a new Dalton Minimum and he may be right and in good company too. Others are divining a new Maunder and they may be right also. No one so far as I am aware has suggested a new Spoorer or Wolfe Minimum but then there may be insufficient data and reliable interpretations to do that. My hand waving, marginal and worthless opinion is we are about to be dumped on by a new Maunder Minimum.
Whichever way it goes it is looking very much like a new minimum in solar activity and mean global temperature is almost upon us and it will not be an exact repetition of what has gone before. Perhaps it should be known informally at least as the “Gore Minimum” for obvious reasons.
Once upon a time scientists could not figure out how a big, fat incect like a bumblebee could fly, using such little wings. The didn’t even have a decent theory. However the bumblebee ignored them, and buzzed about.
Once upon a time scientists couldn’t figure out why sunspot cycles influenced the weather. They didn’t even have a decent theory. However the weather ignored them, and froze my bleep off.
Mike Haseler says:
March 6, 2013 at 1:31 am
You mentioned Scotland in the 1690s and the famines that killed off about 25% of the population. That was associated with a big spike in the Be10 record. The Sun was very quiet.
The sun looks blank now!
http://sdo.gsfc.nasa.gov/assets/img/latest/latest_512_4500.jpg
Leif, I have to ask was the Maunder minimum caused by a sleepy sun or a sudden lack of CO2 that caused the mini ice age, so reported in history. Were the people recording the sun spots or lack of them just being lazy and not recording them. Please inform me as to why the sun had nothing to do with it and why the pause in warming now and a recent temperature drop in the oceans is not caused by the suns sabbatical.
Hi Leif
You say
Unfortunately, data-based arguments are not science [it is like stamp collecting]. It becomes science when interpreted in terms of a theory or model or understanding which can then connect the data to everything else we have learned and understood.
I would disagree with such a blanket statement. Science is advanced by theories based on data but often collections of data happen for a long time before theory catches up with it. Stamp collections are not scientific data, there are no measurements, no errors, no plots waiting for a theory to tie them together.
Sometimes one can use data to predict future data, beginning with the tides which even primitive people could observe and predict their timing , though the theory evaded them. It may be that what David Archibald presents as prediction from similarities to older data is just a matter of coincidence and bump chasing. It may be not. If a theory does not emerge to substantiate the influence of the sun cycle on the climate ( if the next twenty years follow the plots), a theory should be found. If the data diverge then the assumptions are invalidated.