Guest Post by Willis Eschenbach
I see the good Lord Stern is back in the news. Lord Stern famously produced an eponymous report a few years ago about how much it would cost to cut down carbon dioxide to try to cool down the planetary temperature. He said it would be dirt cheap, a percent or two of GDP would do it quite nicely … riiiight …
The amazing part of the Stern Report was his choice for the future value of money. Here’s the deal with the future value of money, which you already know, perhaps even without knowing you know it. If I said to you, “Which would you prefer, a thousand dollars now, or a thousand dollars next year”, I doubt you’d have much trouble noticing that money next year is not worth the same as money today. How about a thousand dollars either next year or in ten years? You’d greatly prefer next year. That is the future value of money. It is always worth less than money today. It gets discounted a bit, a few percent, for each year into the future. An iron-clad guarantee of a thousand dollars in a hundred years is worth almost nothing today.
Lord Stern’s brilliant contribution to the rapidly emerging field of Paleocarbophobic Economics was to do his entire study of CO2 reduction as if the presumed benefits of reduced temperatures in fifty years have the same value as if we got the putative future benefits today. His discount rate for the future monies was zero, which is the same as saying that future money paid to you fifty years from now is worth exactly the same as money paid to you today … you don’t have to be an accountant to know that’s bogus, you know a thousand bucks in fifty years is worth a whole lot less than a thousand bucks today, but that was Stern’s claim. Mindboggling.
 Figure 1. Total cumulative carbon emissions (blue), cumulative carbon sequestered (absorbed) by the planet (green), and cumulative carbon remaining in the atmosphere (red). The purple line shows the “airborne fraction”, which is the amount of carbon remaining in the atmosphere as a percentage of the amount emitted. Note the underlying relationship, that the total emitted is the sum of the amount sequestered plus the amount remaining in the atmosphere, or Emitted = Airborne + Sequestered. Data Sources: Fossil fuel CO2 emissions – Land use CO2 emissions – Airborne CO2 levels The conversion factor of 2.13 gigatonnes of carbon equal 1 ppmv of atmospheric CO2 was used to convert between units.
Of course, Lord Stern had to make the ridiculous claim that the future benefits had huge value today in order to make the CO2 reduction scam appear to make any economic sense. As an accountant, I would have recommended un-Lording his noble keister for that particularly egregious economics transgression, but unfortunately the Queen of England doesn’t pay much attention to me. I know because I wrote to her Majesty once. Her private secretary replied.
He sent a lovely letter on a piece of paper that was so thick it looked like it would crack if it were folded, a gorgeous cream-colored slab of royal stationery, posted to me in an envelope the size of a small valise … unfortunately, if her Majesty’s secretary’s answer were translated into the dialect of the native tribes of the island of New Amsterdam, it could be best rendered as “Her Majesty has ordered me to tell you to fuggeddaboutit” … but I digress.
So what is Lord Stern’s latest claim? I’m sure you will be shocked and surprised to find out that he now says It’s Worse Than We Thought!™
The UK’s Guardian newspaper, that most British bastion of blatant bloviation, has the story here. I was most interested in the reasons why Lord Stern thinks that It’s Worse Than We Thought!™ This turns out to be the following, in Lord Stern’s own words:
“Looking back, I underestimated the risks. The planet and the atmosphere seem to be absorbing less carbon than we expected, and emissions are rising pretty strongly. Some of the effects are coming through more quickly than we thought then.”
You can tell he’s a pro because of the number of errors he has managed to shoehorn into three short sentences. It takes true nobility to do that, a common man like myself couldn’t stand the pressure. Let me start with his most ridiculous statement, that “the atmosphere seem to be absorbing less carbon than we expected”. Really? How much CO2 were we expecting the atmosphere to “absorb”? And what does it mean for the atmosphere to “absorb” CO2? There’s no meaning in that statement.
But let’s assume that “the atmosphere absorbs” means the atmosphere has taken up less carbon than we expected. I’m not sure how much he expected it to take up, so there’s no way to judge that … but it doesn’t matter because there’s another, larger problem. Since Emitted = Airborne + Sequestered, the only way for the airborne amount to be less than expected (as he claims) is for the sequestered amount to be greater than expected. The problem with that is that he has said that the planet is sequestering less CO2, not more.
But those are just the inherent internal contradictions in Lord Stern’s strange statement. More important are the actual mis-statements of fact. He claims that a reason that he underestimated the risks is that “emissions are rising pretty strongly”. But in fact there is little change from the emissions trend in 2006 when he wrote his infamous report.
And his claim that less and less is being sequestered by the planet? Absolute fantasy. The airborne fraction is the amount of CO2 remaining in the atmosphere. As shown by Figure 1, it has not changed significantly in the last fifty years, nor has the sequestration rate. What is he imagining is new since 2006? Lest you think I am making up my claim about the carbon sinks not changing, here’s a report of NOAA’s take on the question:
Natural sinks still sopping up carbon
Ecosystems haven’t maxed out ability to absorb fossil fuel emissions
May 15, 2012
BOULDER, Colo. — Earth’s ecosystems keep soaking up more carbon as greenhouse gases accumulate in the atmosphere, new measurements find.
The research contradicts several recent studies suggesting that “carbon sinks” have reached or passed their capacity. By looking at global measurements of atmospheric carbon dioxide, the new work calculates instead that total sinks have increased roughly in line with rising emissions.
“The sinks have been more than able to keep up with emissions,” said Pieter Tans, an atmospheric scientist at the National Oceanic and Atmospheric Administration’s Earth System Research Laboratory in Boulder, Colo. Tans presented the findings May 15 at an annual conference on global monitoring hosted by the lab.
(In passing, I just noticed that NOAA appears to have used the same method I used to determine the airborne fraction, by looking at global measurements of atmospheric CO2. Curious if true, but again I digress. Onwards to the finale …)
SUMMARY OF STERN’S STATEMENTS:
Every single claim that Lord Stern made about how things are getting worse is untrue.
• There have been no surprises on the emissions front. The average annual increases in the CO2 emissions are basically unchanged since he wrote his report in 2006. In fact, despite his claim of rising emissions, the increases are somewhat smaller than expected in 2006, due to the drop in emissions from the global financial crisis.
• The amount of CO2 sequestered by the planet has stayed quite constant at about 55% of the total emissions. There has been no decrease in sequestration as he claims, and there is no evidence that the carbon sinks are losing their ability to sequester CO2.
• Finally, although he says “the effects are coming through more quickly than we thought”, the earth placidly continues along with no statistically significant warming or cooling over the last 15 years, and there is no sign of any increase in extreme events … so exactly which effects of CO2 are “coming through”, quickly or not?
Not one true statement in the bunch … oh, my good Lord!
Three seventeen am, I guess that’s bedtime for me. Starlight and high night cirrus to y’all, with the full moon steaming majestically through the clouds in the middle of a ring of light, remember that the loup garou needs your prayers, I’m off to sleep …
w.
Chris said:
“Someone should comment on the catastrophic man-made global warming hit piece in the SF Chronicle by Carolyn Lochhead. Oh my, it’s as if the non-warming of the past 16 years didn’t exist. Filled with arctic and methane tipping points […]”
This is the link:
http://www.sfgate.com/science/article/Major-climate-changes-looming-4227943.php#page-1
Complete with a photo of tons of steam coming from the cooling towers…
Adam
$100 placed at 7 percent interest compounded quarterly for 200 years will increase to more than $100,000,000, by which time it will be worth nothing.
– Robert A. Heinlein
Les Johnson says:
January 28, 2013 at 5:29 am
http://www.esrl.noaa.gov/gmd/dv/iadv/
http://www.esrl.noaa.gov/gmd/dv/iadv/index.php?code=brw
Site is not quite working right at the current time.
Whenever I read silly statements like it’s much, much
and
I think to myself this guy either does not know what he is talking about or he does and is making sh!t up because he’s following the money. This I did and discovered a possible reason for him talking utter bollocks (testicles for US folks).
It really is much, much worse than I thought.
Lord Stern is attempting to deceive. A 16 year temperature standstill and he says:
Lord Stern, I do believe, has been off his medication……………..or smoking something funny.
Ken Gregory says:
January 27, 2013 at 12:28 pm
Figure 1 shows the cumulative Airborne Fraction….
>>>>>>>>>>>>>>>>>>>>>>>>>>>>
I suggest you take a look at F.H. Haynie’s pdf. (He was a scientist for the EPA) http://www.kidswincom.net/climate.pdf
It is more in depth than his wordpress presentation: http://retiredresearcher.wordpress.com/
vukcevic says:
January 27, 2013 at 9:54 am
Most of the global warming is in the higher latitudes of the N. Hemisphere, the Arctic ice reduction is hailed as a primary example. Comparing the CO2 emissions and the Arctic temperature since 1800 to the present time tells different story to the one told by lord Stern :
http://www.vukcevic.talktalk.net/CO2-Arc.htm
~~~~~~~~~~~~~~~~~~~~~~~~~~~~~~~~~~~~~~~~~~~~~~~~
Vuk,
Re the correlation with geomagnetic strength, I think you are really onto something here. Do you have an update of this chart to 2010 or 2011?
-Gerry Pease
G. E. Pease says:
January 28, 2013 at 5:11 pm
……………..
Yes take a look at:
http://www.vukcevic.talktalk.net/EarthNV.htm
Vuk,
Thanks. I notice that the magnetic field strength in the Arctic is about an order of magnitude greater than the interplanetary magnetic field strength. I am not aware that Svensmark has been able to incorporate this in his theory, however.
@Bill Illis
Thanks for the Point Barrow CO2 link. The (recently) late Reginald Barrow (same family) was a close friend of mine and my biz advisor for years. I want you and Willis to notice something. The CO2 rise and fall in your area matches, by dates, the melting and accumulating of snow and ice in the Arctic. There is no way this is a coincidence. Freezing water expels CO2 and it is as clear as the Point Barrow air that this is happening on a large scale. The CO2 chart for Hawaii is more smeared and the summer melt is not as sharp (the CO2 drops as ice melts).
There is a characteristic drop in the concentration in mid-winter which should have an explicable cause. Winter winds pushing in diluting air from the southern latitudes perhaps? Perhaps t has to do with the sea expelling CO2 after it first gets into the water from sea ice formation. Dunno.
The mass of snow and ice should correlate closely with the pulsing of the CO2 level, factored for regional inflow and outflow. Not so? The local concentration in Antarctica should have a similar cycle. Or do plants in the Southern Ocean overwhelm its signal? Seems unlikely.
Crispin,
The frigid waters in both the Arctic and the Antarctic are the big sinks for CO2, but there is a major difference in their ability to take it up. In the Arctic, the ocean is covered with ice much of the year while in the Antarctic the sink area just moves north during the SH winter. Add in the timing for phytoplankton blumes and you may be able to develop a model for annual sink rate changes based on the different annual CO2 cycles.
Crispin in Waterloo says:
January 31, 2013 at 12:46 am
Man, I hates it when people do dat. I go off to see this phenomenon you talk about with such surety, and here’s what I find … nothing of the sort.
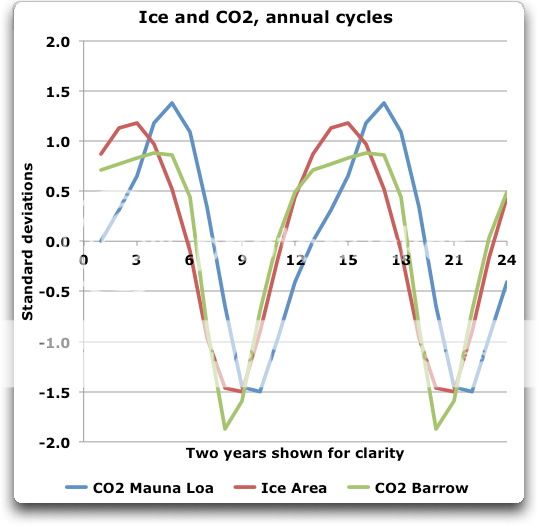
No, the dates don’t match, either for Barrow or for MLO.
Since the CO2 starts to rise one month before the ice melt starts, this seems unlikely. And since the CO2 rise continues for two month after the ice starts to freeze, your theory is totally untenable …
It is widely thought that CO2 rises and falls on an annual cycle due to the activity of the biosphere, with the plants respiring CO2 in the spring and exhaling it in the fall.
I’ve also never heard anyone claim that “freezing water expels CO2”, and I see no reason why it should. If any air is expelled during the freezing process, why would it be just CO2 and not the usual atmospheric mix? Do you have a cite for the claim that freezing expels co2?
w.
@Willis
Unless you have mislabeled your graph I think you have proven my point very well. First remove the Mauna Loa CO2 as irrelevant. That is the delayed response to Arctic conditions. The point I was making is that the Point Barrow CO2 chart matches the (sea?) ice area extremely well. Did you not notice?
Ice contains no CO2. If this requires explanation so be it: Liquid water has CO2 absorbed in it. Water does not absorb much “air”. Freezing the water kicks out basically all gases because there is no place for it in the crystal structure. One author as we discussed in a previous thread makes mention of tiny cracks holding brine but this a tiny fraction of ice mass.
Your chart shows the drop in CO2 as the snow melts (snow also contains no absorbed CO2). If your “ice” curve was instead “frozen water” including snow, ice, sea ice, frozen muskeg etc it would more closely match the CO2 line. Why? Because melting crystal ice becomes a liquid water CO2 sink.
@fhhayni
Thanks, but you also seem to have missed the point that water has CO2 in it and ice does not. This is well established as a physical property. Check the solubility of CO2 in water and ice.
When the snow and ice melts on the Great Plains and sub-Arctic it draws down the CO2 before the sea ice melts. The graph shows it.
Sea water has a strong influence in summer as it is uncovered and warms. That is why the concentration rises after the ice limit is reached. Also remember that land ice including ground water melts throughout the summer and there is a lot of land water in the equation.
The idea that biomass is the cause of this massive seasonal fluctuation is speculative at best. If biomass draws it down in summer why doesn’t it stay down? I have see it claimed that the source of the winter increase is “fossil fuel burning in the Northern Hemisphere”. Do the math. It is 6 times humanity’s annual output, is it not? In 5 months? I don’t think so.
Willis, my citation is any table of water soluble gases. I have checked this in detail with Philip Lloyd, if you find that supportive. The effect is also visible in the ice age ice cores which Philip was kind enough to send me in high resolution though it is a more complicated story.
Almost freeze a can of Coke until it is slushy. Drink it. It is fizzier than no-slush Coke because the CO2 in the slush has been expelled into the surrounding liquid even though the pressure rises when that happens. CO2 is not soluble in ice.
Crispin in Waterloo says:
February 1, 2013 at 9:54 pm
The peak time for CO2 is 2 months AFTER peak ice.
The minimum time for CO2 is 1 month BEFORE peak ice.
Your claim was:
So no, it doesn’t match by dates the melting and accumulating of ice. It doesn’t “match the ice area” in anything more than a vague and general way. Not only that, but Barrow CO2 continues to rise for two full months after the sea ice area is falling … how does your theory explain that?
I agree that the rejection of CO2 during the freezing of sea ice is important … but studies have shown that much of it, while rejected from the ice, leaves the ice not as a gas but still dissolved in a cold, salty, CO2 rich brine that sinks to the sea floor … so your theory that it goes into the air doesn’t work. See e.g. Sea ice contribution to the air–sea CO2 exchange in the Arctic and Southern Oceans (paywalled, sorry) for a bit of discussion of the various factors.
Best regards,
w.
@Willis
We are partly on the same page now – at least we are using the same terms. This is not excusively an “ice” issue, it is a water cycle issue. I understand what you mean by the CO2 continuing after the sea ice freezes. And where does that CO2 come from?
As long as ice continued to form whether it is frozen ground, accumulated snow (new ‘ice’) or anything else that turns H2O into crystal form the CO2 will rise.
Other words i am saying that the discussion has to get past a simple analysis. I ran the numbers and put them in earlier comments and noted, twice i think, that the missing metric is the total mass of water that freezes and thaws. Does there remain in your mind any doubt that melting ice absorbs CO2? I have been making calculations on the basis that it will absorb 420 ppm like sea water. The numbers are huge. Sea water will take some of it because it is dropping in temperature, but remember that the sea water is what is freezing and if off-gases quite well when saturated (all that about warming seas etc). It is in balance near the surface.
Re the ‘two months’….are you still looking at the Hawaii peak? Please look closer to the ‘causal area’. As the ice seals over the seal, there is a noticeable inflection in the CO2 rise. There’s your sea water absorption. But the snow accumulation and ground freeze continues. As sea ice is not a perfect proxy for water-to-ice we can’t expect the lines to match on the first look-see. Thank you for agreeing that this is an important issue. I am pretty sure the modes don’t discuss it or dismiss it (though I can’t prove it has been taken seriously).
I have access to paywalled journals.
Chrispin and Willis,
Your discussion on the relationship between sea ice and CO2 concentrations in the Arctic interests me because I have been studying it for while. Here is my take on it. First, freezing water does not outgass to any significant degree, otherwise all sea ice would be clear rather than “white”. Second, the freezing of sea water reduces the area available to uptake air containing CO2 but has little effect on the input of CO2 into the air above the Arctic ocean. That CO2 is being delivered from the south in the upper atmosphere. I believe it was “pumped” into the stratosphere by thunder clouds in the tropics and delivered to the Arctic in jet streams. That would explain the continuing rise in the CO2 concentration after the sea ice has started to melt. Input – output = accumulation. The measured CO2 concentration is the accumulation and in the Artic it changes greatly on an annual basis. The rate of change in the input depends on the rate of delivery from the south while the rate of output is closely associated with the rate of change in the amout of exposed sea water surface area. A note to consider, sea ice extent is not the same as sea ice area and expose water area is not total ocean area – extent.
@Willis
Look, Crispin, you can claim any damn thing you like, it means NOTHING. You need to come up with fact. You know, citations. Evidence. Observations.
Does melting ice “absorb CO2”? Your statement is totally unclear and completely vague. How much CO2? At what point in the cycle? Is it a significant amount?
It will “absorb 420 ppm”? Really? What “it” are you talking about? The ice-cold melt water that immediately goes to the bottom of the ocean?
You are not grasping the problem. So far, the numbers are not huge, we haven’t seen any numbers. The only thing that is “huge” is the number of your unsupported claims.
Whoa there, we’ve been merrily talking about what the ice does when it thaws, and suddenly, you seem to think the discussion has been about freezing.
No, why would I be doing that?
That makes no sense, what “sea water absorption” is happening as the ice freezes? You’ve been saying the CO2 goes UP when the ice freezes, now you are claiming extra ABSORPTION of CO2 when the ice freezes.
You have no evidence for the claim that somehow the ice stops freezing first, but the snow accumulation and the ground freeze is continuing. Might be the case, I doubt it, but just waving your hands and wishing it were true doesn’t work.
Thanks, Crispin. I don’t think it is an “important issue” in the slightest. The CO2 goes up and down on an annual cycle. We are quite sure that most of that annual cycle is from the annual cycle of plants, as you would expect. We know this from measurements of plant respiration during the annual growth cycle.
Now is it possible that some of the CO2, instead of cycling into and out of plants, is cycling into and out of ice? Sure.
Is it important whether it does so? Not in the slightest. Whether it is going into and out of ice or plants is pretty immaterial in the larger scheme of things ..
Now, if you do think it is a major issue, fine. Get the paywalled article and read it, so there is greater than a 50/50 chance your claims are right, and come back with something more to rest your case than just your inflated claims … because waving your hands and mumbling about what you believe the snow is doing in relation to the ice is meaningless. Hang on, let me look, the data is here … OK, in fact, total snow area peaks in January, two months before the ice peak, and is at its lowest in August, a month before the ice peak. Took me all of five minutes to find out.
So your claim, that increasing CO2 in February and March after the ice peak is due to still-freezing snow, is contradicted by the facts about the snow, as you would have known had you done five minutes of homework instead of wasting our time with your unexamined, uncited, and unlikely claims.
Citations. Don’t come back without ’em.
w.
@fhhanyie
I will try to come back with my math intact and the gas interactions. If I can reach you at your linked site Climate Change we can cooperate there or in one of the backrooms at S4Group.org which has private spaces for working on papers with non-members. I can also invite some others who do not contribute here with whom I have discussed this.
It is important to set the question down clearly so we don’t try to answer everything at once. I suggest the question:
“What is the contribution to the annual change in atmospheric CO2 concentration in the Arctic made by the feezing and melting of water in the biosphere?”
Why should we ask the question? Because melting glacial and continental ice packs will absorb quantites of CO2 that are large relative to net human emissions of it (from all sources). There are about 30m cubic km of ice on Earth at present, representing a potential to absorb 3.75*10^13 tons of CO2 at 1280 ppm(m) were it all to melt. That is an amount >100% of the CO2 presently in the whole atmosphere. In fact it is nearly double. There is a widely reported claim that human emissions of CO2 will raise the atmospheric level to the point that all the ice will melt. To date, I have not seen this claim backed by any calculation that considers the absorption of CO2 by melting ice, ice which is not able to retain absorbed CO2.
There are several good points made at http://wattsupwiththat.com/2009/05/22/a-look-at-human-co2-emissions-vs-ocean-absorption/
Departure points for this article:
– Annual Arctic ice volume varies from 20bn tons to 4.5 bn tons
– NH Lake ice is a second factor, most melting completely each year.
– NH land ice is another factor that has an accumulation-melting cycle (glaciers for example)
– Water in the ground that freezes and melts each year, muskeg and tundra-over-permafrost is involved in the cycle
– Snow mass (not snow area) is involved. Snow on the ground represents moisture frozen out of the atmosphere, that moisture arriving from the South liberates CO2 (if it arrives in droplet form but not that portion of it contributing to snow formation arriving in vapour form).
– Covering the Arctic sea with ice in winter could account for a reducting in absorption of CO2 from the South but the reduction is only (at most) <1/10th of the change in CO2 concentration so even if it contributes, the variation has other more significant cause(s).
– The solubility of CO2 in water is 90 cc per 100ml (CL/CG = 0.8) which is 0.9 m^3 per ton of fresh water. http://www.thuisexperimenteren.nl/science/carbonaatkinetiek/Carbondioxide%20in%20water%20equilibrium.doc
– At 20 C the CO2 content of water is 0.029 mol/litre (1.28 g/litre) (ibid)
– About 1% of the dissolved carbon dioxide turns into carbonic acid. http://www.solarnavigator.net/solar_cola/carbon_dioxide.htm
– The reaction of CO2 being absorbed into water is governed by Henry's Law:
P(CO2) = Kh * C(CO2)
where P(CO2) is the partial pressure of CO2 in the ambient air, Kh is Henry's Law constant,
and C(CO2) is the concentration of dissolved CO2 in the water.
http://www.newton.dep.anl.gov/askasci/chem03/chem03573.htm
The CO2 reaction with water is:
(CO2)aq + H2O == H2CO3 == H(+1) + HCO3(-1)
"…but is quite weak and only accounts for 0.2 to 1% of the dissolved CO2. The rest remains as solvated molecular CO2."
http://www.thuisexperimenteren.nl/science/carbonaatkinetiek/Carbondioxide%20in%20water%20equilibrium.doc
– Meltwater will absorb about 1.28 kg of CO2 per ton or 1.28 ppm(m) shortly after melting.
+++++++++
Is there a word 'hydrosphere'? Yes, but unfortunately it has several different meanings. This one is relevant:
hydrosphere [ˈhaɪdrəˌsfɪə] n, (Earth Sciences / Physical Geography) the watery part of the earth's surface, including oceans, lakes, water vapour in the atmosphere, etc.; hydrospheric adj
That definition does not include the water in the ground that freezes and melts each year . If we can accept the term in the meantime to include all water that has access to the atmosphere and a changing temperature it will do for a brief investigation into the phenomenon.
I would put at a 'significant' effect one that is 5% of the total annual variation because above that, it would be incorrect to omit it in modeling and still claim to have shown the origin of 95% of the variation.
I have posted on WUWT several sets of calculations in the contributors sections (here being one) but the search engine above does not find them – just articles. As it is not difficult to reproduce I will do them again.
If I go to your blog we can take it up there and report to the bottom of this thread. Agreed? Another contributor has written to me off list and we have made contact directly some weeks ago, interested in getting a handle on the same subject.
Crispin,
I welcome continuing discussion on my http://www.retiredresearcher.wordpress.com. Just click on my name above and make a comment. I have had email discussions with others. The advantage is it is easier to share spreadsheet files and plots.
As for the ability of the frigid Arctic sea water to take up CO2, the solubility in water containing a lot of basic ions as well as CO2 hungry phytoplankton will never become saturated. The rate of uptake is being controlled by the rate of delivery to the open water surface, not solubility.
Equilibrium and solubility do have effects in CO2-cloud dynamics. Clean rain has a pH that approaches equilibrium with atmospheric concentrations. So where should we expect CO2 in cloud droplets to go that end up in the anvil of a thunder cloud?
Correction to above:
“- Meltwater will absorb about 1.28 kg of CO2 per ton or 1.28 ppm(m) shortly after melting.”
should read
– Meltwater will absorb about 1.28 kg of CO2 per ton or 1,280 ppm(m) shortly after ice melts. It may take 24 hrs to stabilise during which time the pH changes quite a lot (see the solarnavigator link about for a discussion of why and how much).