Guest post by Dr. Leif Svalgaard
The official sunspot number is issued by SIDC in Brussels http://sidc.be/sunspot-data/ . The [relative] sunspot number was introduced by Rudolf Wolf http://en.wikipedia.org/wiki/Rudolf_Wolf in the middle of the 19th century. He called it the ‘relative’ number because it is rather like an index instead of the actual number of spots on the Sun. Spots occur in groups [which we today call ‘active regions’] and Wolf realized that the birth of a new group was a much more significant event than the emergence of just a single new spot within a group, so he designed his index, R, [for any given day] to be a weighted sum of the number of spots, S, and the number of groups, G, giving the groups a weight of 10: R = S + 10*G. The number of 10 was chosen because on average a group contains about 10 spots, and also because it is a convenient number to multiply by.

Later, Wolf introduced the so-called ‘k-factor’ to compensate for differences in the size of telescope, precise counting method, observer acuity, etc, in order to bring the relative sunspot number determined by another observer on to the same scale as Wolf’s: R = k (10*G + S), where k is 1 for Wolf himself using his ‘standard telescope’ [Figure 1a,b] and his rules [not counting the smallest spots] for counting spots. From the 1860s Wolf had to travel extensively and he used exclusively [for the rest of his life] a much smaller telescope [Figure 1c]. With a smaller telescope Wolf, obviously’ saw fewer spots [and groups!], so he used k = 1.5 to convert his counts to the scale of the standard telescope.
Wolf’s successor, Alfred Wolfer, thought [rightfully] that the rule of ‘not counting the smallest spots’ was too vague and advocated to count all spots and groups that could be seen. This, of course, made his count larger than Wolf’s, so based on overlapping counts during 1876-1893, determined that to place his [Wolfer’s] relative number on to the Wolf scale he should multiply by 0.6 [one could say that his k-factor was 0.6]. This conversion factor of 0.6 has been adopted by all [Zurich] observers ever since. Adopted, not measured, as Wolf is not around any more. SIDC adopts that same factor, thus striving to stay on the Zurich scale.
So far, so good. But at some point in the 1940s, the Zurich observers began to ‘weight’ sunspots according to size and complexity, such that large spots would not be counted just once [as Wolf and Wolfer did], but up to five times, i.e. given a weight of five. There is nothing wrong with that, if one then also adjusts the k-factor to reflect this new way of counting. The director of the Zurich observatory from 1945-1979, Max Waldmeier, may have thought [?] that the weighting was introduced a long time ago [he mentions ‘about 1882’] so that no change of k-factor would be needed. Waldmeier set up a station in Locarno in southern Switzerland [as the weather on the other side of the Alps is often complimentary to that in Zurich] to provide observations when it was cloudy in Zurich. The observers in Locarno [Sergio Cortesi began in 1957 and is still at it] were instructed to use the same weighting scale as Waldmeier in Zurich. Because SIDC to this day normalize all observations they collect from a network of 60-70 observers to the count from Locarno, the weighting scheme carries over unchanged to the modern sunspot number.
We know that Wolfer did not weight the spots [contrary to Waldmeier’s assertion], because Wolfer himself explicitly [in 1907] stated that each ‘spot is counted only once, regardless of size’, and also because Wolfer’s counts as late as in 1924 when compared to other observers’ simply show that single spots are counted only once no matter how large.
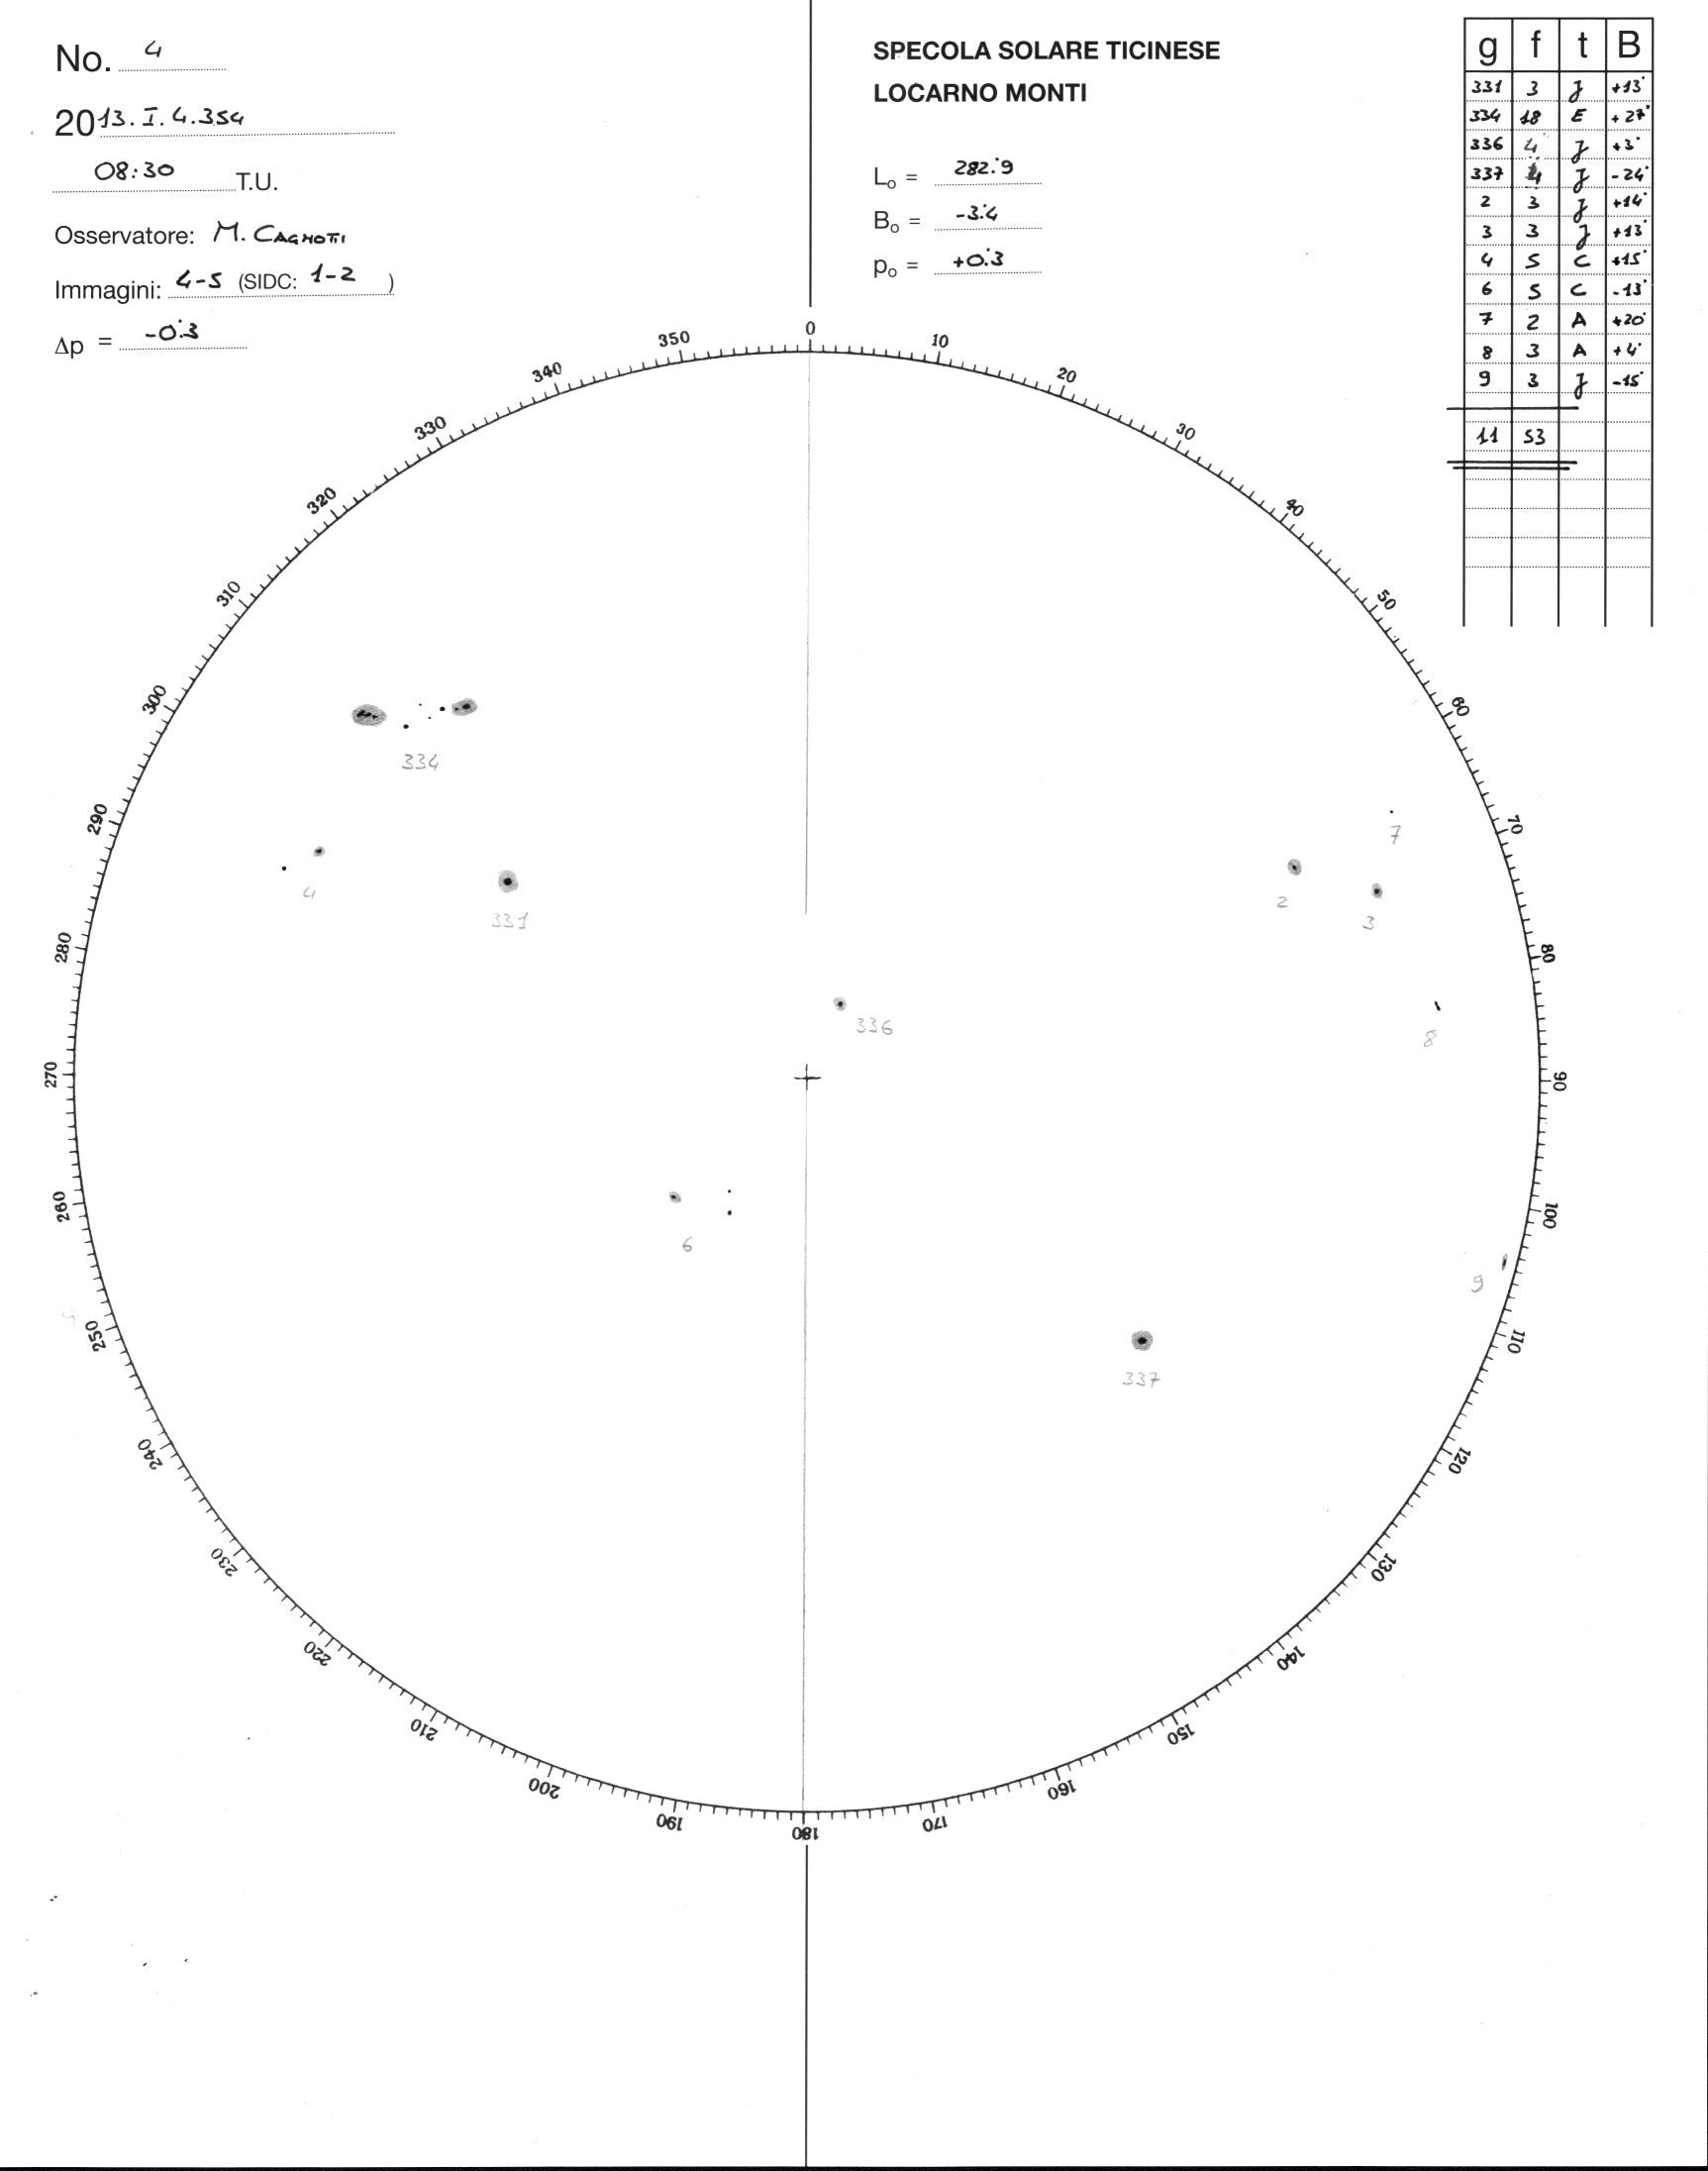
To get a feeling for how the weighting works, try to count the spots on the Locarno drawing for today http://www.specola.ch/drawings/2013/loc-d20130104.JPG and compare your counts with the values given for each numbered group in the little table at the upper right.
![loc-d20130104[1]](http://wattsupwiththat.files.wordpress.com/2013/01/loc-d201301041.jpg?quality=83)
(Note: I did this exercise, and found that my layman’s count was much lower than the “official” count, lending credence to Leif’s premise. Try it! – Anthony)
Marco Cagnotti’s [from Locarno] count is 11 groups and 53 ‘weighted’ spots. My count of the actual number of spots is 23. Try it for yourself. Your count may differ by about one from mine, but that does not change the fact that the weighted relative number 10*11+53=163 is about 23% larger than the ‘raw’, simple count of 10*11+23=133 that Wolfer and Wolf would have reported. For the whole of 2012 the ‘over count’ was 18%. So, it seems that the relative sunspot number suffered a 20% inflation because Waldmeier did not change his k-factor to compensate for the weighting.
Can we verify any of this? Well, one verification you can do yourself: just count the spots. But a better test is to ask the Locarno observers to report two numbers: the weighted count as usual and the unweighted count, where each spot is counted just once. Such a test has been [as is being] done. Figure 2 shows the effect of the weighting. Blue symbols show the official weighted count, and red symbols show Marco and my raw counts. The conclusion should be obvious.

The top panel of Figure 3 shows how well the sunspot number calculated from this formula matches that reporter by the Zurich observers.

Applying the same formula to data after 1945 gives us the lower panel. Under the assumption that the Sun did not know about Waldmeier we would expect the same relationship to hold, but in fact there is an abrupt change of the observed vs. the expected sunspot numbers between 1946 and 1947 of [you guessed it] 20%. Several other solar indicators give the same result. So there are several smoking guns.
What to do about this? One obvious thing would be to simply to remove the inflation [dividing the modern sunspot number by 1.20] and to stop weighting the spots. This turns out to be a bad idea, at least users of the sunspot numbers complain that they do not want to change the modern numbers as they are used in operational programs. The next-best thing is to adjust the old numbers before 1947 by multiplying them by 1.20. This is what we have decided to do [at least for now]. Who are ‘we’? You can see that here http://ssnworkshop.wikia.com/wiki/Home
There is a precedent for this [with the same ‘solution’]. In 1861 Wolf had published his first list of relative sunspot numbers, which he then updated every year after that. But about 1875 he realized that he had underestimated Schwabe’s counts [which formed the backbone of the list before Wolf’s own observations began in 1849]. Consequently, Wolf increased wholesale all the published sunspot numbers before 1849 by 25%. So we are in good company.
A somewhat disturbing [to many people] consequence of the correction of the official sunspot number is that there is now no evidence for a Modern Grand Maximum [‘the largest in 8000 years’ or some such].
NOTE: Figure 4 added 1/5/13 at Leif’s request

Berényi Péter says:
January 7, 2013 at 1:57 pm
…………….
Hi
Not exactly what you want, Debrecen Photoheliographic Data (1977-2012) plates are on line http://fenyi.solarobs.unideb.hu/DPD/index.html
Lief
I was looking more at the SC highs as groups rather than the spikes. Using the factor of 1.2 for pre 1947 the linear trend is still upwards and the Polynomial trend line shows a much more pronounced rise after 1950.
Jim G says:
January 7, 2013 at 12:23 pm
I was only asking that it be stated as something less than hard fact given the variety of opinions on the subject.
The subject has been opined [pro and con] upon for 400 years, so can hardly be considered a hard fact.
TimTheToolMan says:
January 7, 2013 at 1:56 pm
would prefer to let the data speak for itself until it has been shown to be wrong
I would prefer to let the data speak for itself until it has been shown to be right
Berényi Péter says:
January 7, 2013 at 1:57 pm
I am interested in a database of more than 150 years of solar disk images (from 1858 to 2012). That’s what it takes to settle the question.</i<
Me too. Unfortunately no such database exists.
Sunspot says:
January 7, 2013 at 4:16 pm
I was looking more at the SC highs as groups rather than the spikes. Using the factor of 1.2 for pre 1947 the linear trend is still upwards and the Polynomial trend line shows a much more pronounced rise after 1950.
The issue is not if there is a trend, but if there is a significant trend.
Using a three-cycle grouping [some solar scientists like that] the long-term variation looks like this: http://www.leif.org/research/Modern-Grand-Maximum-NOT.png with the blue curve being the 33-yr smoothed variation. In the upper left is Usoskin’s ‘Grand Maximum’ [with a 25 or 50 yr smooth – I forget which]. That is what we should compare with.
Now, I perfectly well understand the real need for seeing a significant trend to explain Global Warming.
“Leif Svalgaard says:
January 6, 2013 at 6:50 pm
ed says:
January 6, 2013 at 6:32 pm
It is exceptional in our era…
‘Exceptional’ is too strong. Compared with the often touted Modern Grand Maximum, out era is not special.
what the final multipliers will be, who knows…
As far as the influence of the weighting, there is not much more to expect. The cause has been found, the effect measured, and that is it. Further data or analysis will not change the result significantly. An issue is whether Wolf’s assessment was correct to begin with. That may be a topic of a future post.”
What I meant by multipliers are potential multipliers of the SC trend, like Cosmic Rays, UV, penetration into the ocean, cloud cover, atmospheric expansion/contraction, etc. The real climate drivers are not well defined or understood I believe. Like the oceanic 60yr cycle, suspiciously similar to the solar cycle activity clusters, but much out of phase/doesn’t match. With the AMO going cold in another 5yrs or so, that will be revealing and will likely cause a mandatory inclusion in any climate model (and subtract from modern CO2 attibutions). We’ll get closer to reality but only once some of the drivers cause climate to get colder, which thankfully with SC24/25 and the PDO/AMO heading negative we’ll get to observe in our lifetime (to the aingst of the climate modelers as every year diverges from thier current reality). Not to mention once the oceanic driver is acknowldeged, it can be removed and some of the background residual analyzed for other signatures, solar or otherwise.
Thanks for the polite responses, very much appreciated.
Leif writes “I would prefer to let the data speak for itself until it has been shown to be right”
Which data would you let speak for itself then?
vukcevic says:
January 7, 2013 at 2:51 pm
Not exactly what you want, Debrecen Photoheliographic Data (1977-2012) plates are on line http://fenyi.solarobs.unideb.hu/DPD/index.html
Thanks, wonderful. That’s exactly the kind of data I am looking for. The job is obviously not finished yet, though.
Leif Svalgaard says:
January 7, 2013 at 5:44 pm
Unfortunately no such database exists.
Leif, this is not entirely true, as vukevic has shown.
folks at Debrecen Observatory say: “The Debrecen Photoheliographic Data (DPD) sunspot catalogue is compiled as a continuation of Greenwich Photoheliographic Results (GPR)”
Now, questions: is there such a project under way at the Royal Greenwich Observatory? Kew Observatory? Are the photographic plates themselves archived? available for research? digitalized? put online?
I understand such projects need money and much silent human labor, but is not that science used to be about? Careful examination of data already collected, I mean. Are frivolous & futile modelling games played on supercomputers not much more expensive?
Greenwich Photo-heliographic Result (GPR) online
No photographic evidence, though. How come?
TimTheToolMan says:
January 7, 2013 at 11:51 pm
Which data would you let speak for itself then?
The data that shows otherwise.
Berényi Péter says:
January 7, 2013 at 11:53 pm
“Unfortunately no such database exists.”
Leif, this is not entirely true, as vukevic has shown.
No such database exists. Disconnected pieces, only.
Now, questions: is there such a project under way at the Royal Greenwich Observatory? Kew Observatory? Are the photographic plates themselves archived? available for research? digitalized? put online?
Whatever is available is not in digital form, depending on what you mean by that. The plates themselves are very difficult to work with.
Here is what is available:
http://www.leif.org/research/SSN/Willis.pdf
http://www.leif.org/research/SSN/Willis3.pdf
The ‘digital’ format is essentially just the ‘paper reports’
The plates still exists: http://janus.lib.cam.ac.uk/db/node.xsp?id=EAD%2FGBR%2F0180%2FRGO%2050
There is work ongoing to digitize the plates, e.g. http://arxiv.org/pdf/1212.4776.pdf
But, the Grand Database you were after does not [yet] exist [regardless of Vuk]
I understand such projects need money and much silent human labor, but is not that science used to be about? Careful examination of data already collected, I mean.
And we are trying to do something about it: http://ssnworkshop.wikia.com/wiki/Home
Berényi Péter says:
January 8, 2013 at 12:26 am
Greenwich Photo-heliographic Result (GPR) online
No photographic evidence, though. How come?
The plates exist. But putting them online is an enormous task, and interest is low.
Leif Svalgaard says:
January 8, 2013 at 1:28 am
The plates exist.
Wow, you mean no one bothered to look at them in one and a half century? Is it not cleaner to count spots on a sample of old plates using the current method and compare it to old counts?
Berényi Péter says:
January 8, 2013 at 7:10 am
Wow, you mean no one bothered to look at them in one and a half century?
They had already been counted…
Is it not cleaner to count spots on a sample of old plates using the current method and compare it to old counts?
Because of the strong indications of a problem with the sunspot series, old plates and drawings are being revisited.
Leif replies “Which data would you let speak for itself then?
The data that shows otherwise.”
So in your mind, the data that was based on proxy and assumption trumps the data that was measured by a purpose built satellite launched to specifically measure the spectral variance?
TimTheToolMan says:
January 8, 2013 at 1:31 pm
So in your mind, the data that was based on proxy and assumption trumps the data that was measured by a purpose built satellite launched to specifically measure the spectral variance?
In a sense, yes. These measurements are very difficult.
Solar UV variations during the decline of Cycle 23
Deland, Matthew T.; Cebula, Richard P.
Journal of Atmospheric and Solar-Terrestrial Physics, Volume 77, p. 225-234, 2012.
“Previous satellite measurements of solar UV variability show consistent solar cycle irradiance changes within instrumental uncertainties, and also show consistent spectral dependence for both rotational and solar cycle variations. Empirical solar irradiance models produce solar UV variations that agree well with observational data. Recent UV irradiance data from the Solar Radiation and Climate Experiment (SORCE) Spectral Irradiance Monitor (SIM) and Solar Stellar Irradiance Comparison Experiment (SOLSTICE) instruments longward of 170 nm covering the declining phase of Cycle 23 show solar variations that greatly exceed both previous measurements and predicted irradiance changes over this period. The spectral dependence of the SIM and SOLSTICE variations differs from previous results. However, short-term solar variability derived from SIM and SOLSTICE UV irradiance data agrees with other concurrent solar UV measurements and previous results, suggesting no change in solar physics. The SORCE long-term UV results can be explained by undercorrection of instrument response changes during early on-orbit measurements.”
Leif writes “In a sense, yes. These measurements are very difficult.”
That is only calling into question the long term variation of the data. A question that cant easily be answered with only short term data. The thing is that SIM has (IMO) correctly identified much more variability within TSI than was previously thought. Do you think that finding too, is wrong?
Longer term spectral variation (in the tenth of Watts range at least) seems quite possible to me and I would think quite likely even if it isn’t convincingly captured in a few short years worth of data.
Putting it another way, why would you think the sun doesn’t vary considerably in its spectral output? We already know it varies in its total output. And why would you think those spectral variations should be in step with the total output?
TimTheToolMan says:
January 8, 2013 at 5:49 pm
That is only calling into question the long term variation of the data.
No, it is calling into question the few years of dubious SIM data.
Do you think that finding too, is wrong?
Too? yes, that finding is wrong or rather has not been substantiated and established. What is ‘wrong’ is believing it is a ‘fact’.
Longer term spectral variation (in the tenth of Watts range at least) seems quite possible to me and I would think quite likely even if it isn’t convincingly captured in a few short years worth of data.
We normally don’t consider what ‘seems possible’. We try to go with what the data shows, rather than wishful thinking.
Putting it another way, why would you think the sun doesn’t vary considerably in its spectral output?
Since the UV is due to the same cause as all the other variations, namely the magnetic field, we expect it to vary the same way in every cycle.
Leif writes “We normally don’t consider what ‘seems possible’. We try to go with what the data shows, rather than wishful thinking.”
I find it slightly ironic that you say that but at the same time disregard the only actual data we have of spectral variance from a purpose built satellite. Surely the data rules UNTIL it is shown to be faulty. And by *shown to be faulty* I dont mean someone wanting it to be too great and comparing it to model output because it was unexpected.
Sure…if its waaaay out of spec then thats different but this data is well within what is possible.
Hy again,
I first want to thank you for your blog post and the thousand replies.
You are for the last more then 15 years one of the nicest scientists I ever “talked” to.
And what you explain is easily understandable for us laymen.
I didn’t read everything. Sorry. Maybe you already answered my question: “What is in your opinion the main driver of climate shifts, like the one that happened at the end of the LIA?”
Thank you very much again!!!!
Ed(Europe)
TimTheToolMan says:
January 9, 2013 at 12:55 am
Surely the data rules UNTIL it is shown to be faulty.
As a general rule that is not true. There are many cases where unexpected data are subsequently shown to be faulty. A good example is the data showing that neutrinos travel faster than light http://news.sciencemag.org/scienceinsider/2012/06/once-again-physicists-debunk.html
The names of the game are ‘duplication’ and ‘reproducibility’.
Leif writes “As a general rule that is not true.”
I would agree where the data is not measured but instead derived from proxies or from theory and models alone. In this case its an actual measured value. Measured by a device that was designed specifically to make the measurements. So in this case the data does rule until otherwise shown to be wrong.
Leif gives an example “A good example is the data showing that neutrinos travel faster than light”
Not a good example. There are good theoretical reasons why the neutrinos weren’t travelling faster than light and so that result was always going to be carefully verified.
Leif writes “The names of the game are ‘duplication’ and ‘reproducibility’.”
Neither of which apply to the data you prefer. The paper you quoted earlier had this to say about spectral variability
“short-term solar variability derived from SIM and SOLSTICE UV irradiance data agrees with other concurrent solar UV measurements and previous results, suggesting no change in solar physics.”
However you replied with “yes, that finding is wrong or rather has not been substantiated and established.”
So you can see that its really only your bias that prevents you from accepting that its very likely the spectral variance is greater then you’d have expected in the past. Why would you do that Leif?
TimTheToolMan says:
January 10, 2013 at 2:40 am
Not a good example. There are good theoretical reasons why the neutrinos weren’t travelling faster than light and so that result was always going to be carefully verified.
There are also good theoretical reasons why the UV variations reported are likely not real.
The paper you quoted earlier had this to say about spectral variability
“short-term solar variability derived from SIM and SOLSTICE UV irradiance data agrees with other concurrent solar UV measurements and previous results, suggesting no change in solar physics.”
However you replied with “yes, that finding is wrong or rather has not been substantiated and established.”
Your quote out of context is the reason the SIM data is wrong. Read the paper. We can test our understanding of UV variations by looking at the short-term [from day to day] variations. And they show that there is no ‘change in solar physics’, i.e. SIM is not correct. Which is not surprising as those measurements are difficult to make.
TimTheToolMan:
I would agree where the data is not measured but instead derived from proxies or from theory and models alone. In this case its an actual measured value. Measured by a device that was designed specifically to make the measurements. So in this case the data does rule until otherwise shown to be wrong.
When first launched, The Hubble Space Telescope returned data known immediately to be erroneous, even though it was a measuring device designed specifically to make the measurements. The error was recognised because the data did not match previous knowledge; nobody had to wait for proof of spherical abberation.
Sometimes the measuring instrument and/or the data processing just aren’t up to the job.
As an aside: I have to constantly remind myself that (nearly?) all “measurements” are actually proxies themselves. When I go outside and measure the temperature, I’m not assessing how much the molecules making up the environment are vibrating – I’m judging the position of the end of a column of mercury against a scale of length. If I want to know a temperature from 1927, I look up the record of someone who used a similar proxy. In doing so, I’m making big assumptions about (trusting) the combined knowledge and skills of scientists and engineers over a long time.
With enough data over time, properly assessed, proxies like sunspot-number-for-solar-magnetism can be as reliable as mercury-position-for-molecular-vibration.
Of course, other proxies, with little data over time, improperly assessed, may represent little more than longed-for-hockeysticks. 😉
And of course, I deliberately wrote “abberation” as a proxy for irony…
PJF writes “With enough data over time, properly assessed, proxies like sunspot-number-for-solar-magnetism can be as reliable as mercury-position-for-molecular-vibration.”
For TSI, perhaps. But sunspots may never say anything about the spectral components that make up that total. And changes in the composition of TSI make all the difference as to how the atmospheric heating operates. The Hubble Space Telescope’s lens problem produced results that didn’t match those from other measurements and so it was obvious something was wrong. There is no similar “obviousness” about the SIM irradiance values.
We should always be sceptical about data but pointing out that the measured data doesn’t correspond to what we thought it ought to have been is as useless as a catflap in the elephant house.
http://heliophysics.nasa.gov/SolarMinimum24/papers/Merkel.pdf
“The SIM irradiance measurements have an accuracy of better than 2% [Harder et al., 2010] and a long-term repeatability in the ultraviolet portion of the spectrum (220-310nm) is about 0.5-0.1%, in the 310-400 nm range the agreement is about 0.2-0.05%, and in the 400-1600 nm range the agreement is better than 0.05%. Auxiliary material to the Harder et al., [2009], describe the degradation correction methodology.”
So whilst its still possible there is something wrong with the SIM data and particularly with respect to drift over its relatively short life, until such time as something is SHOWN to be wrong with the short term variability of the data in particular, it stands. 2% is a world away from the 500% + that Leif believes is the case.
PJF follows on with “And of course, I deliberately wrote “abberation” as a proxy for irony…”
Quite clever. Myopia prevented me from seeing it the first time 😉
TimTheToolMan says:
January 10, 2013 at 6:09 pm
So whilst its still possible there is something wrong with the SIM data and particularly with respect to drift over its relatively short life, until such time as something is SHOWN to be wrong with the short term variability of the data in particular, it stands.
As I told you already, there is nothing wrong with the short-term variability. It is the long-term stability that is wrong. The observed short-term variability matches what our understanding, models, and previous observations say it should be. “the is no new solar physics”. It is the long-term stability that is in doubt, because the detectors degrade very quickly when exposed to that harsh UV in space. Modeling and correction of that degradation is likely where the problem lies.
The variation ‘over time’ is where people [like you] confuse things. UV etc vary a lot on a day-to-day basis, or even on a year-to-year basis, but since solar activity is cyclic there is a much smaller variation from cycle to cycle. It is like the weather: it varies a lot from day-to-day and from season-to-season, but a lot less from year-to-year. We have a good measure of the amount of UV we get over a year simply by measuring the variation of the direction of a compass needle [ http://www.leif.org/research/CAWSES%20-%20Sunspots.pdf ] and that measure shows us that the UV varies just like the Sunspot Number, the radio flux from the sun, TSI and just about every solar indicator you can find. So, UV over time is as stable as TSI. No purpose-built satellite can change that.