Guest post by Dr. Leif Svalgaard
The official sunspot number is issued by SIDC in Brussels http://sidc.be/sunspot-data/ . The [relative] sunspot number was introduced by Rudolf Wolf http://en.wikipedia.org/wiki/Rudolf_Wolf in the middle of the 19th century. He called it the ‘relative’ number because it is rather like an index instead of the actual number of spots on the Sun. Spots occur in groups [which we today call ‘active regions’] and Wolf realized that the birth of a new group was a much more significant event than the emergence of just a single new spot within a group, so he designed his index, R, [for any given day] to be a weighted sum of the number of spots, S, and the number of groups, G, giving the groups a weight of 10: R = S + 10*G. The number of 10 was chosen because on average a group contains about 10 spots, and also because it is a convenient number to multiply by.

Later, Wolf introduced the so-called ‘k-factor’ to compensate for differences in the size of telescope, precise counting method, observer acuity, etc, in order to bring the relative sunspot number determined by another observer on to the same scale as Wolf’s: R = k (10*G + S), where k is 1 for Wolf himself using his ‘standard telescope’ [Figure 1a,b] and his rules [not counting the smallest spots] for counting spots. From the 1860s Wolf had to travel extensively and he used exclusively [for the rest of his life] a much smaller telescope [Figure 1c]. With a smaller telescope Wolf, obviously’ saw fewer spots [and groups!], so he used k = 1.5 to convert his counts to the scale of the standard telescope.
Wolf’s successor, Alfred Wolfer, thought [rightfully] that the rule of ‘not counting the smallest spots’ was too vague and advocated to count all spots and groups that could be seen. This, of course, made his count larger than Wolf’s, so based on overlapping counts during 1876-1893, determined that to place his [Wolfer’s] relative number on to the Wolf scale he should multiply by 0.6 [one could say that his k-factor was 0.6]. This conversion factor of 0.6 has been adopted by all [Zurich] observers ever since. Adopted, not measured, as Wolf is not around any more. SIDC adopts that same factor, thus striving to stay on the Zurich scale.
So far, so good. But at some point in the 1940s, the Zurich observers began to ‘weight’ sunspots according to size and complexity, such that large spots would not be counted just once [as Wolf and Wolfer did], but up to five times, i.e. given a weight of five. There is nothing wrong with that, if one then also adjusts the k-factor to reflect this new way of counting. The director of the Zurich observatory from 1945-1979, Max Waldmeier, may have thought [?] that the weighting was introduced a long time ago [he mentions ‘about 1882’] so that no change of k-factor would be needed. Waldmeier set up a station in Locarno in southern Switzerland [as the weather on the other side of the Alps is often complimentary to that in Zurich] to provide observations when it was cloudy in Zurich. The observers in Locarno [Sergio Cortesi began in 1957 and is still at it] were instructed to use the same weighting scale as Waldmeier in Zurich. Because SIDC to this day normalize all observations they collect from a network of 60-70 observers to the count from Locarno, the weighting scheme carries over unchanged to the modern sunspot number.
We know that Wolfer did not weight the spots [contrary to Waldmeier’s assertion], because Wolfer himself explicitly [in 1907] stated that each ‘spot is counted only once, regardless of size’, and also because Wolfer’s counts as late as in 1924 when compared to other observers’ simply show that single spots are counted only once no matter how large.
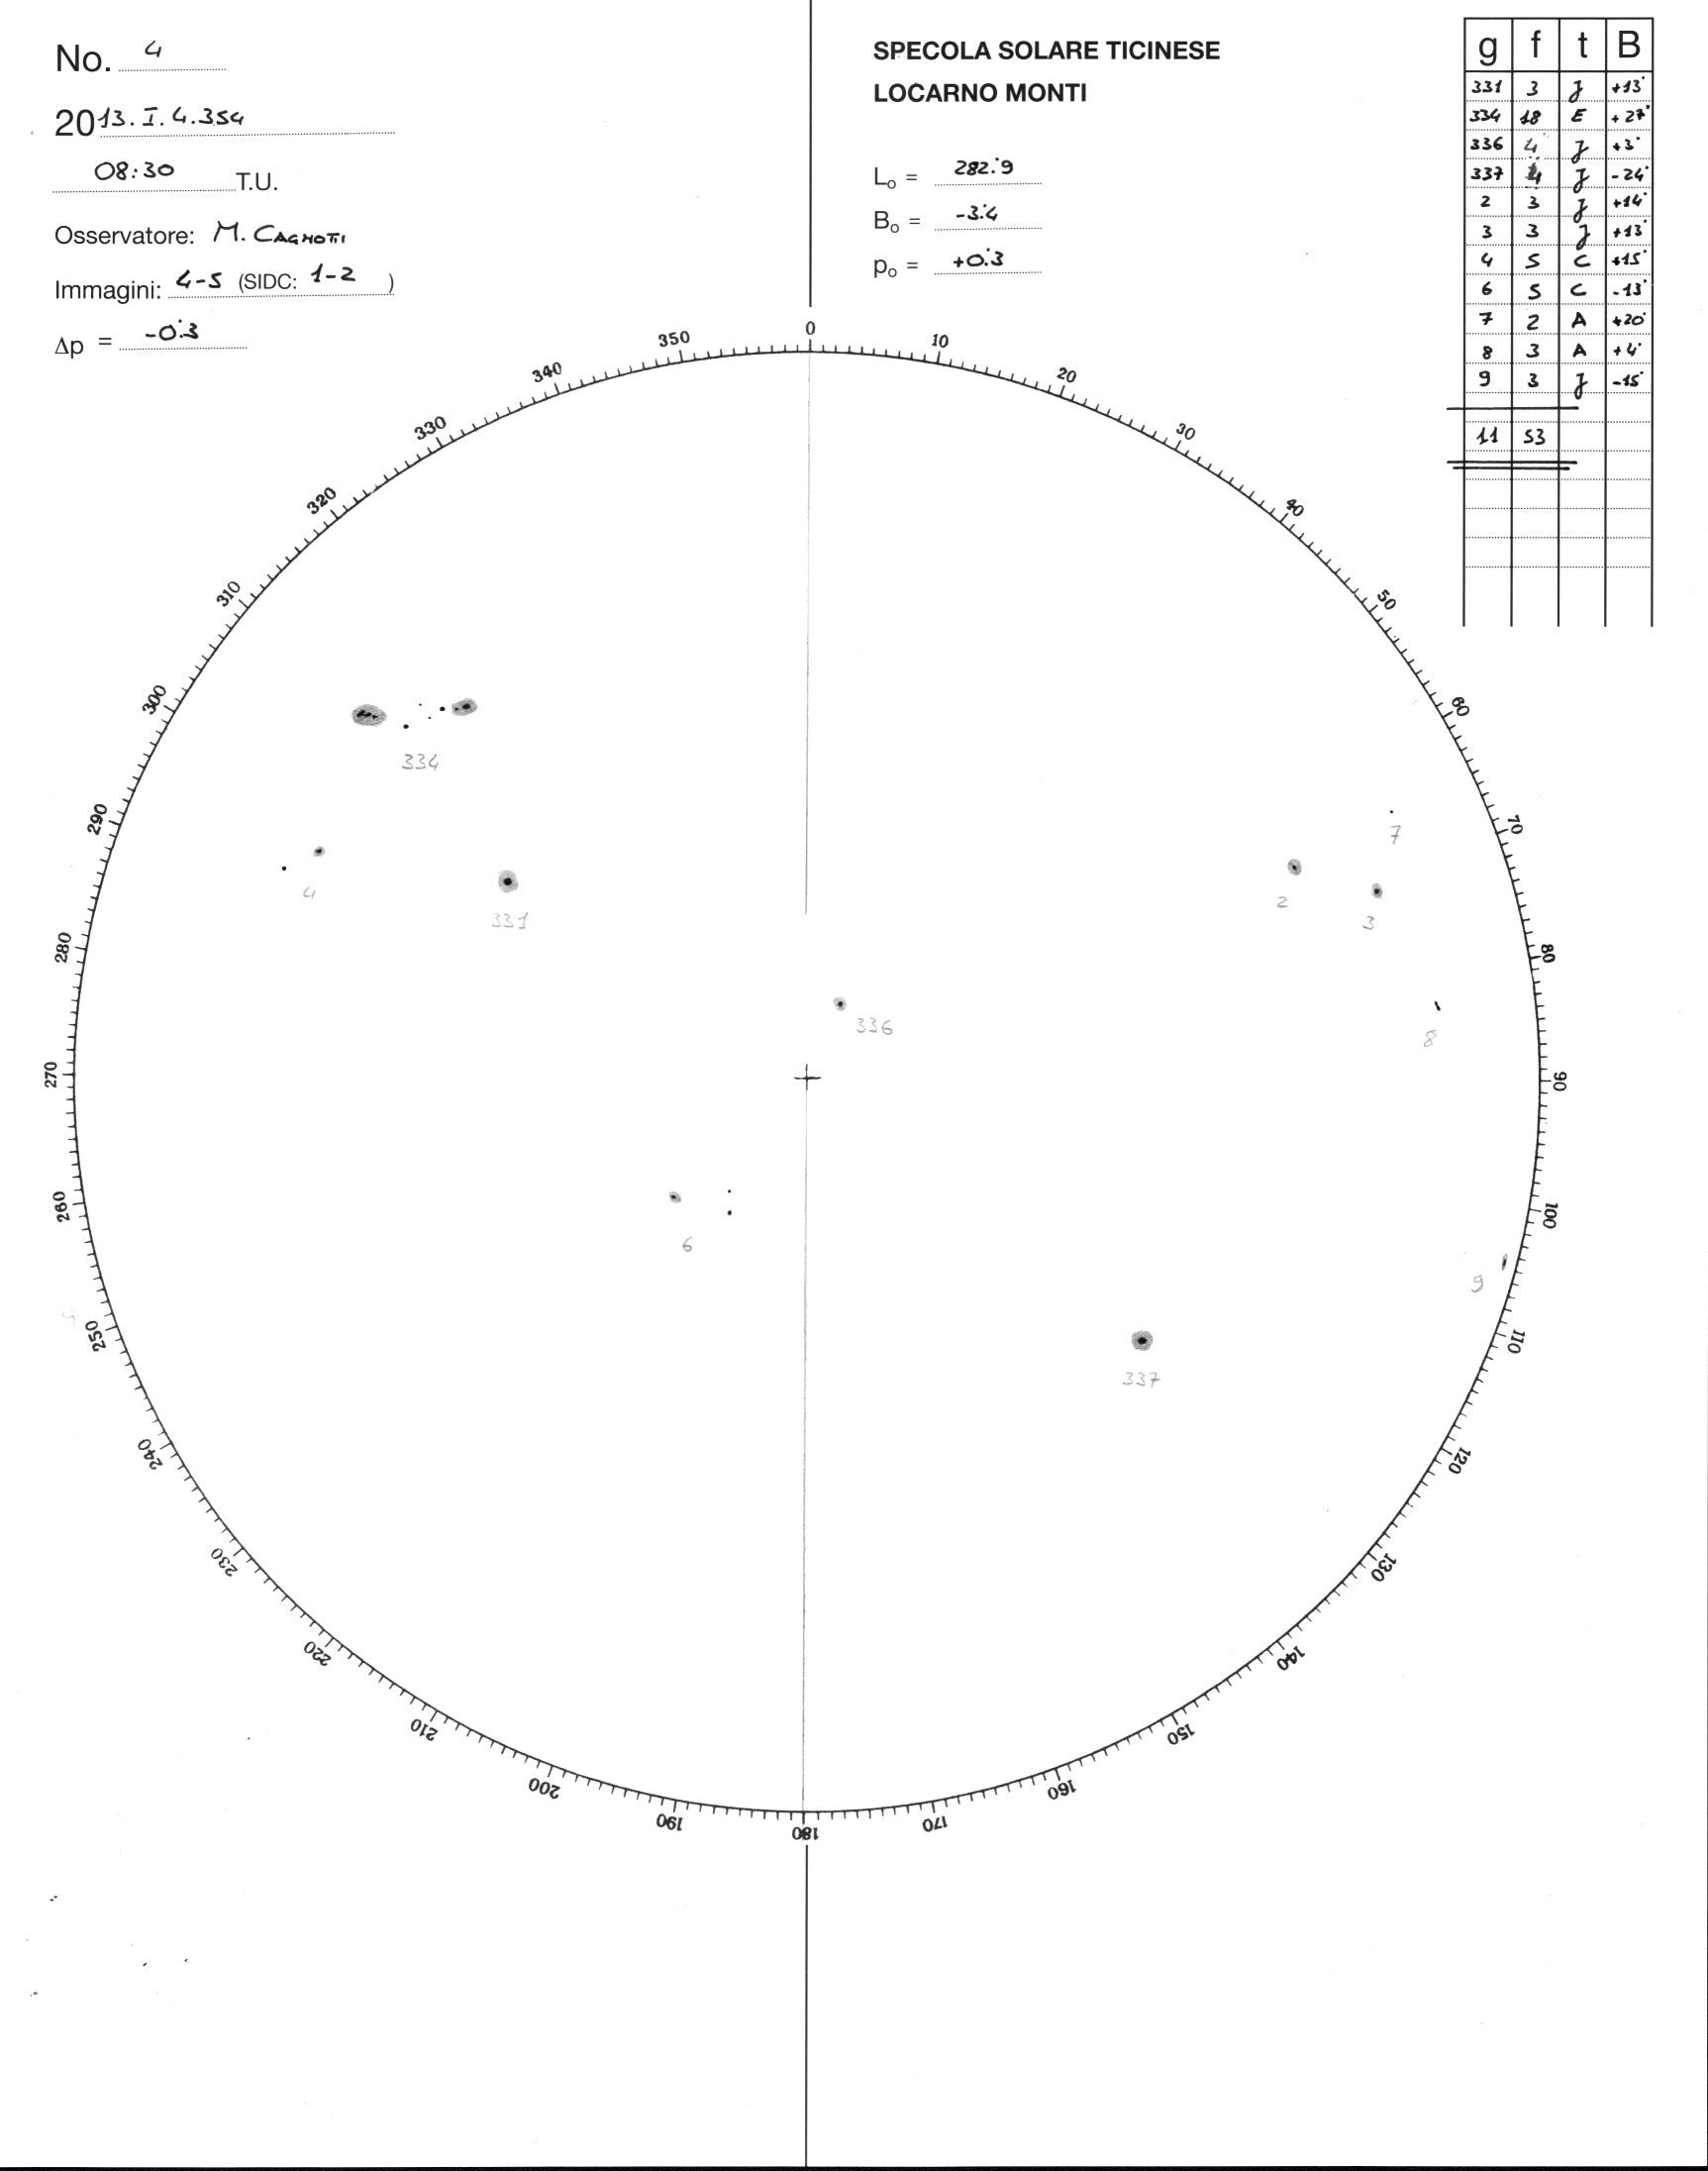
To get a feeling for how the weighting works, try to count the spots on the Locarno drawing for today http://www.specola.ch/drawings/2013/loc-d20130104.JPG and compare your counts with the values given for each numbered group in the little table at the upper right.
![loc-d20130104[1]](http://wattsupwiththat.files.wordpress.com/2013/01/loc-d201301041.jpg?quality=83)
(Note: I did this exercise, and found that my layman’s count was much lower than the “official” count, lending credence to Leif’s premise. Try it! – Anthony)
Marco Cagnotti’s [from Locarno] count is 11 groups and 53 ‘weighted’ spots. My count of the actual number of spots is 23. Try it for yourself. Your count may differ by about one from mine, but that does not change the fact that the weighted relative number 10*11+53=163 is about 23% larger than the ‘raw’, simple count of 10*11+23=133 that Wolfer and Wolf would have reported. For the whole of 2012 the ‘over count’ was 18%. So, it seems that the relative sunspot number suffered a 20% inflation because Waldmeier did not change his k-factor to compensate for the weighting.
Can we verify any of this? Well, one verification you can do yourself: just count the spots. But a better test is to ask the Locarno observers to report two numbers: the weighted count as usual and the unweighted count, where each spot is counted just once. Such a test has been [as is being] done. Figure 2 shows the effect of the weighting. Blue symbols show the official weighted count, and red symbols show Marco and my raw counts. The conclusion should be obvious.

The top panel of Figure 3 shows how well the sunspot number calculated from this formula matches that reporter by the Zurich observers.

Applying the same formula to data after 1945 gives us the lower panel. Under the assumption that the Sun did not know about Waldmeier we would expect the same relationship to hold, but in fact there is an abrupt change of the observed vs. the expected sunspot numbers between 1946 and 1947 of [you guessed it] 20%. Several other solar indicators give the same result. So there are several smoking guns.
What to do about this? One obvious thing would be to simply to remove the inflation [dividing the modern sunspot number by 1.20] and to stop weighting the spots. This turns out to be a bad idea, at least users of the sunspot numbers complain that they do not want to change the modern numbers as they are used in operational programs. The next-best thing is to adjust the old numbers before 1947 by multiplying them by 1.20. This is what we have decided to do [at least for now]. Who are ‘we’? You can see that here http://ssnworkshop.wikia.com/wiki/Home
There is a precedent for this [with the same ‘solution’]. In 1861 Wolf had published his first list of relative sunspot numbers, which he then updated every year after that. But about 1875 he realized that he had underestimated Schwabe’s counts [which formed the backbone of the list before Wolf’s own observations began in 1849]. Consequently, Wolf increased wholesale all the published sunspot numbers before 1849 by 25%. So we are in good company.
A somewhat disturbing [to many people] consequence of the correction of the official sunspot number is that there is now no evidence for a Modern Grand Maximum [‘the largest in 8000 years’ or some such].
NOTE: Figure 4 added 1/5/13 at Leif’s request

Leif, Do you have a xls file of your latest reconstruction available?
I notice it is quite different from the TSI-SSN-Guess file from 6 months ago (WUWT posting), especially in the 1700-1800 region. Have there been other adjustments between then and now as well?
But, even if the MGM artefact is convincingly eliminated, one cannot deny the fact that from the Maunder minimum to 2012, there is a rising trend, with ups and downs the magnitude of which has been quite similar for about 300 years.
Conversely, after the LIA, there has been no major cataclysmic climate event and the record is only punctuated with minor climatic variations.
>…what are the implications of that statement?
> (The consequences of not having had a Modern Grand Maximum.)
The lack of solar grand maxima is not devastating to the functioning of the Universe. But it does devestate certain pet theories of climate scientists/buffs, which claim to prove/disprove AGW or similar stuff.
😐
John…thanks muchly……never thought of that….but as they say….do not attribute to stupidity what is done with malice(to paraphrase)
Nice article, though the k-factor reminds me of a technique I believe that many state sponsored climate scientists use:
y = ff*f(x) + RA(x)
where ff is the finagle factor and always equal to zero, RA is the Right Answer.
From my point of view the changes Lief has made improves the idea that the Sun is responsible for our warming. With a slightly above average, consistent solar contribution we should have seen a slow unremarkable warm-up from the depths of the LIA. That is exactly what we have seen with variation due to ocean oscillations. It also fits even better if you assume some of the recent temperature adjustments under state the historic temps.
Leif,
Richard111 says:
January 5, 2013 at 12:51 am
Okay. I’m lost. So which method of counting sunspots REALLY controls our climate?
“The sunspot cycle controls only a very small part of our climate, so the precise method is not so important.”
Very interesting post, however, there continue to be too many “unknowns, don’t know why’s, still working on’s, don’t all agree upon’s”, even according to your own comments above, to make such a conclusive statement regarding the effect of sunspots upon climate. Perhaps a “lead us to believe” type comment would be less dogmatic and more appropriate.
Regards,
Jim
Gail Combs says:
January 5, 2013 at 7:47 am
perhaps not just luck…
Also diligent work.
Wayne2 says:
January 5, 2013 at 8:04 am
Question, though: what is displayed in the left-hand graph? If sunspot numbers, why are yours so dramatically different in the first cycle or two? (Or is the bottom of the unlabeled Y-axis in the left-hand graph not zero?)
I intentionally left the graph unlabeled to provoke questions like yours. The left panel shows the so-called ‘open magnetic flux’ calculated from the sunspot number [and that from the Group Sunspot Number]. The calculation assumes that the magnetic field ‘rides’ on a background which is the cycle average of the sunspot number. More here: http://www.leif.org/research/The%20long-term%20variation%20of%20solar%20activity.pdf
John West says:
January 5, 2013 at 8:09 am
IF (your input requested) the sunspot numbers from say 1650 to 1700 that I’ve seen are close to “right” being next to if not nil, nada, zilch
We don’t really know what solar activity was before 1700. The lack of sunspots does not mean that activity disappeared. For example, the cosmic ray modulation during the MM was as strong, if not stronger, than today. If I and colleagues are right we may be headed into such a situation in the coming years where the magnetic field is present, but spots do not form. Perhaps TSI will be even higher without the dark spots to drag it down…
Paul Dennis says:
January 5, 2013 at 8:16 am
In the added figure 4 can someone explain to me what is plotted in the graph on the left.
See reply to Wayne2.
ed says:
January 5, 2013 at 8:24 am
Leif, Do you have a xls file of your latest reconstruction available?
Multiply all values before 1947 by 1.2
I notice it is quite different from the TSI-SSN-Guess file from 6 months ago (WUWT posting), especially in the 1700-1800 region.
The 1700-1800 values included the Group Sunspot Numbers. As part of the SSN workshop effort, we have learned more about what is wrong with the group sunspot number [I’ll make a separate post on that at some time] so I have reverted to stick with the official SIDC Wolf series [suitably corrected] for the time being.
TomRude says:
January 5, 2013 at 8:50 am
But, even if the MGM artefact is convincingly eliminated, one cannot deny the fact that from the Maunder minimum to 2012, there is a rising trend, with ups and downs the magnitude of which has been quite similar for about 300 years
Including the MM will invariably create a trend. Here are my thoughts about the MM http://www.leif.org/research/Another-Maunder-Minimum.pdf
[or the powerpoint presentation if you can open it: http://www.leif.org/research/Another-Maunder-Minimum.ppt ].
This is at this point pure speculation, but that is part of science too [if clearly labelled as such].
Soren F says:
January 5, 2013 at 4:21 am
It seems to me the grandness in any modern maximum would lie in the not-so-grandness of all those grand minima, if centennially recurrent.
There is a certain semantic distinction here. Maxima recur, but only the ones that ‘tower’ over the other ones should be called ‘Grand’.
Sorry if semantic, what I mean is just: if not in maxima, long-term variability would still plausibly seem to reside in the magnitude and frequency of grand minima.
Jim G says:
January 5, 2013 at 10:15 am
“The sunspot cycle controls only a very small part of our climate, so the precise method is not so important.”
Perhaps a “lead us to believe” type comment would be less dogmatic and more appropriate.
It should be obvious that everything I say is just my humble opinion. I have explained many times why I think so. But if you want some other thoughts on that here are some:
The minimal solar activity in 2008-2009 and its implications for long-term climate modeling
Schrijver, C. J.; Livingston, W. C.; Woods, T. N.; Mewaldt, R. A.
Geophysical Research Letters, Volume 38, Issue 6, CiteID L06701, 2011
“Variations in the total solar irradiance (TSI) associated with solar activity have been argued to influence the Earth’s climate system, in particular when solar activity deviates from the average for a substantial period. One such example is the 17th Century Maunder Minimum during which sunspot numbers were extremely low, as Earth experienced the Little Ice Age. Estimation of the TSI during that period has relied on extrapolations of correlations with sunspot numbers or even more indirectly with modulations of galactic cosmic rays. We argue that there is a minimum state of solar magnetic activity associated with a population of relatively small magnetic bipoles which persists even when sunspots are absent, and that consequently estimates of TSI for the Little Ice Age that are based on scalings with sunspot numbers are generally too low. The minimal solar activity, which measurements show to be frequently observable between active-region decay products regardless of the phase of the sunspot cycle, was approached globally after an unusually long lull in sunspot activity in 2008-2009. Therefore, the best estimate of magnetic activity, and presumably TSI, for the least-active Maunder Minimum phases appears to be provided by direct measurement in 2008-2009. The implied marginally significant decrease in TSI during the least active phases of the Maunder Minimum by 140 to 360 ppm relative to 1996 suggests that drivers other than TSI dominate Earth’s long-term climate change”
A New Look at Solar Irradiance Variation
Foukal, Peter
Solar Physics, Volume 279, Issue 2, pp.365-381, 2012
“We compare total solar irradiance (TSI) and ultraviolet ( F uv) irradiance variation reconstructed using Ca K facular areas since 1915, with previous values based on less direct proxies. Our annual means for 1925 – 1945 reach values 30 – 50 % higher than those presently used in IPCC climate studies. A high facula/sunspot area ratio in spot cycles 16 and 17 seems to be responsible. New evidence from solar photometry increases the likelihood of greater seventeenth century solar dimming than expected from the disappearance of magnetic active regions alone. But the large additional brightening in the early twentieth century claimed from some recent models requires complete disappearance of the magnetic network. The network is clearly visible in Ca K spectroheliograms obtained since the 1890s, so these models cannot be correct. Changes in photospheric effective temperature invoked in other models would be powerfully damped by the thermal inertia of the convection zone. Thus, there is presently no support for twentieth century irradiance variation besides that arising from active regions. The mid-twentieth century irradiance peak arising from these active regions extends 20 years beyond the early 1940s peak in global temperature. This failure of correlation, together with the low amplitude of TSI variation and the relatively weak effect of FUV driving on tropospheric temperature, limits the role of solar irradiance variation in twentieth century global warming.”
Soren F says:
January 5, 2013 at 10:48 am
Sorry if semantic, what I mean is just: if not in maxima, long-term variability would still plausibly seem to reside in the magnitude and frequency of grand minima.
Naturally. One problem is that we don’t know much about the Grand Minima, there not having been one for 300 years. The Maunder Minimum had few sunspots, but a strong cosmic ray modulation. What does that mean? We don’t know. If we get another Maunder type minimum in the coming years we’ll probably figure out how the interpret the data. Personally I do not consider the low sunspot numbers around 1800 and 1900 [or even now] to rank those periods as ‘Grand Minima’.
Leif,
In this TSI reconstruction of yours from 2007, can you explain why the TSI value was so low in 2007? I am concerned that adjustments are being made to the data which are unexplained (the reason for my previous question on why the difference during the 1700-1800 period). To me it seems there is some calibration error for the TSI from Sunspot calc you are using (from PMOD/ACRIM?).
http://s852.beta.photobucket.com/user/etregembo/media/LeifTSI2008LeifSomeRemoved.png.html?sort=3&o=13
Also, for TSI what is the formula you are using to calculate TSI from SSN (you say SSN is a proxy for solar activity), or is it from other data (GSN) or such?
You repeatedly state that there was high cosmic ray modulation present during the MM, which you imply means that solar activity was still active (I would assume so too, but at reduced levels), but are you really implying that the level of activity (and it’s associated TSI) were not lower than when sunspot count equals zero?
Seems to me that even though the sunspots disappear (L&P) that the level of activity can and likely did decrease during that period, though the SSN count can’t go below zero, so the SSN count isn’t always a good TSI proxy.
Also, is TSI roughly linear to sunspot count? Any formula would be appreciated.
“Including the MM will invariably create a trend.”
Indeed and that also applies to the CAGW science doesn’t it?
As for the MM, your presentation and subsequent comments are very interesting and indeed the speculative part is well highlighted. It is refreshing to see someone ready to say “we don’t know”.
Looking forward to more discoveries…
“I did this exercise, and found that my layman’s count was much lower than the “official” count, lending credence to Leif’s premise.”
On climate topics in general, when something (X) is used to imply something else (Y), the validity of X or not is often less important than the subtle chain of an implicit therefore between then. For instance, on a different topic, many people often essentially argue that CO2 has a non-zero effect on radiation, therefore (so-and-so specific prediction of Z degrees future temperature rise and effects) is valid, even though a critical aspect to examine is the subtle implicit therefore, including its quantitative specifics, because the former being so does not suffice for proving the latter.
This article states:
“The next-best thing is to adjust the old numbers before 1947 by multiplying them by 1.20. This is what we have decided to do [at least for now].”
Then it states and depicts:
“Figure 4. (Left) The idea of the Modern Grand Maximum, MGM. (Right) The corrected Wolf Sunspot Number does not support a MGM”
There is a subtle implicit therefore, implying that the argument for multiplying “the old numbers before 1947” by 1.20 is a proof for turning the plot in the left of figure 4 into the plot on its right.
Actually the version on the right changes the magnitude over much of the time period by vastly, vastly more than 20% compared to the version on the left. That may be highlighted by adding blue lines as in the following:
http://s13.postimage.org/ceocl0vsn/adjusted.gif
Svalgaard will reply saying the difference of more than 20% is from other matters, but ask yourself why the article was written in the way it was.
I don’t particularly like sunspot counts anyway, as opposed to other metrics. (For instance, one minimum dropping down to zero sunspots can differ from another with also zero sunspots at some time, such as how solar magnetic activity was not identical in the last minimum to the recent ones before it). But I couldn’t resist noting the above.
Personally I would have found a recount of the sun spots after 1947 with the old method the right way to proceed, instead of tampering with 250 years worth of data prior to 1947.
The new sunspots graph is a mixture of 2 different measurement types, the pre-1947 with old method multiplied with a constant, the post-1947 a weighted counting which may be closer to reality or not.
Using the same method would have ensured data is not adjusted but obtained with consistent measurement, even if the new method is an improved method.
If it is an improved method, the simple adjustment of the old data through multiplication by 1.2 does not give the same result, else where is the improvement? We are not comparing like with like.
Thank you for the informative post Dr Isvalgaard, I appreciate the explanation of observation matching problems as technology changed and your clear statement of the methods used to attempt to make these observations useful over time.
I understand you to be saying
,A; we have not observed enough variation in sunspot numbers over the period of observation, to make any meaningful correlation/causation claims with weather variations on earth.
And B; that many people are theorizing in advance of the available data when assuming a measurable increase in solar activity during part of the last century?
ed says:
January 5, 2013 at 11:34 am
To me it seems there is some calibration error for the TSI from Sunspot calc you are using (from PMOD/ACRIM?)
I plotted several reconstructions by others, and they did differ quite a lot [due to calibration problems]. I do not make a claim of detailed agreement with everybody. I’m interested in the long-term behavior.
You repeatedly state that there was high cosmic ray modulation present during the MM, which you imply means that solar activity was still active (I would assume so too, but at reduced levels), but are you really implying that the level of activity (and it’s associated TSI) were not lower than when sunspot count equals zero?
We don’t really know. The cosmic ray modulation was higher during the MM than now. From modern data we know that the CME rate does not fall to zero when the sunspot number does. And some people have speculated that when there are no dark spots to cause dips in TSI, that TSI would be higher during a Grand Minimum.
Seems to me that even though the sunspots disappear (L&P) that the level of activity can and likely did decrease during that period, though the SSN count can’t go below zero, so the SSN count isn’t always a good TSI proxy.
My take on this is that durieng normal times [e.g. 1700-1995] the SSN is a good proxy for TSI, cosmic rays, UV, the works…
But I think a Grand Minimum is qualitatively different, and the SSN is meaningless during such periods or at least a very poor proxy for anything.
Also, is TSI roughly linear to sunspot count? Any formula would be appreciated.
I think that during ‘normal times’ there is a rough linear relation: TSI = 1360.8 + 0.007 SSN
Note that this includes a 4.8 W/m2 re-calibration due to the change from PMOD to SORCE.
When the SSN no longer represents the magnetic flux the formula will not be valid. Note, that I’m predicting that this will happen, so lots of opportunity prove me wrong.
Lars P. says:
January 5, 2013 at 11:56 am
Personally I would have found a recount of the sun spots after 1947 with the old method the right way to proceed, instead of tampering with 250 years worth of data prior to 1947.
That is not possible, because we don’t have a time-machine with which we can go back and count again, and the original raw data has been ‘disappeared’.
The new sunspots graph is a mixture of 2 different measurement types, the pre-1947 with old method multiplied with a constant, the post-1947 a weighted counting which may be closer to reality or not.
comparison shows that the two different methods give the same result except for a constant factor [or almost constant factor – there is a small anomaly near zero as there are no relative sunspot numbers between 0 and 10]
If it is an improved method, the simple adjustment of the old data through multiplication by 1.2 does not give the same result, else where is the improvement? We are not comparing like with like.
We do get very nearly the same result. The comparison is the best that can be done, like it or not.
LSvalgaard wrote:
This surprises me. You make the suggestion that a solar irradiation would be “even higher without the dark spots to drag it down.”
Isn’t high sunspot activity is associated with a net increase of TSI? The sunspots with their surrounding faculae tend to crank up the Sun’s output rather than “drag it down,” right?
Also, you note a high level of cosmic ray modulation during the Maunder Minimum: “For example, the cosmic ray modulation during the MM was as strong, if not stronger, than today.”
Older papers noted that this modulation was very low; CR level was high (i.e., low CR modulation). For example:
From:
http://cc.oulu.fi/~usoskin/personal/2000JA000105.pdf
Where’s a good place to start to see where these ideas and observed data were overturned?
===|==============/ Keith DeHavelle
Leif thank you for the understandable post. One of the few that didn’t seem to attract any trolls. Interesting. Maybe real science scares them off.
Keith DeHavelle says:
January 5, 2013 at 12:36 pm
Isn’t high sunspot activity is associated with a net increase of TSI? The sunspots with their surrounding faculae tend to crank up the Sun’s output rather than “drag it down,” right?
Solar activity makes two contributions to TSI: S from dark sunspots. S is negative. And F from faculae. F is positive and about equal to twice S, so the net result is positive. If a Maunder Minimum means that there magnetic field is still there [to modulate cosmic rays] then F is still there, but S is gone.
Where’s a good place to start to see where these ideas and observed data were overturned?
many places, e.g. http://www.leif.org/EOS/2009GL038004-Berggren.pdf Figure 2d
“Periodicity in 10Be during the Maunder minimum reconfirms that the solar dynamo retains cyclic behavior even during grand solar minima”
Now, there is a lot of speculation about how to interpret the data and the old myths die slowly, so everything must be taken with the necessary grains of salt.
Leif,
Thank you for bringing this to WUWT. As always, the solar posts cause wonderfully dynamic commenting to occur.
Question for Leif about the length of time it took solar science to begin to focus more on identifying and then addressing rectification of the sun spot count inflation that started circa 1945. Why is the inflation seemly becoming important (workshopped) starting in the second decade of the 21st century? Do you consider ~65 yrs later as a normal timing to address the inflation?
Sidetrack Question for Leif => I am not being cynical (OK, maybe a little cynical) when I ask if a contributory factor in taking so long to address the ss inflation is the overemphasis by funding bodies on research myopically focusing on AGW by CO2 from fossil fuels? Has a bias toward AGW research funding caused reduced resources/ interest on solar research for things like ss inflation?
Happy New Year, Leif.
John
A general comment: my post addresses but a small corner of the whole problem with the limited goal of showing that the official sunspot number record must be corrected. Some researchers believe that the official sunspot number should not be used at all and prefer to use the group sunspot number which they believe is better [and which does vary in a way supporting many pet theories]. In another post I may explain why I don’t think this is correct. For now, just remember the limited goal of the present post.
Are there any plans to stop using the weighted count? Maybe another SIDC station could be the reference station?
Now I know how the sauce was made. It seems like I’ve seen it in dribs and drabs but this was the story from start to present. A highly educational post and discussion. Thank you Leif, Anthony, and commenters.
“At the Royal Greenwich Observatory photographs of the Sun have been taken ‘every’ day since 1874 until they stopped in 1975. “
The British Journal for the History of Science, Vol. 26, No. 2 (Jun., 1993), pp. 137-169
Images of the Sun: Warren De la Rue, George Biddell Airy and Celestial Photography
by Holly Rothermel
A breathtakingly interesting account, recommended for everyone interested in what constitutes “objectivity” in observations and the role played by interpretation.
Not the least important point in the paper, related to our current subject is the fact that regular photographs of the solar disks were started to be taken at the Kew Observatory in 1858 by a photoheliograph developed by De la Rue expressly for the purpose to observe sun spots.
Therefore, we have an almost continuous photographic record of the solar disk for the last 155 years. Or, at least I hope these photographs are archived properly and are available for research.
Then we have the usual questions. Is this dataset digitized? Is it available online? Is it available at all?
If it is, objectivity, as Rothermel notes, is still not ensured, but at least we would have different biases in standardizing resolution, contrast, frequency sensitivity, etc. of images found in the database before feeding them into an image processing algorithm (with its own biases, inserted by designers & coders). Availability of images alone is clearly insufficient for such an endeavor, we’d also need as much metadata as possible in a standardized, algorithmically parsable format.