Guest Post by David Middleton
“Satellites See Unprecedented Greenland Ice Sheet Surface Melt… Right On Time”

I guess Professor Tedesco missed this…
“Ice cores from Summit show that melting events of this type occur about once every 150 years on average. With the last one happening in 1889, this event is right on time,” says Lora Koenig, a Goddard glaciologist and a member of the research team analyzing the satellite data.
How can an ice sheet surface melt be both “unprecedented” and “right on time”?
It can’t. However, nothing is impossible when you combine govt bureaucrats and the junk science of anthropogenic global warming…

Satellites See Unprecedented Greenland Ice Sheet Surface Melt
07.24.12
For several days this month, Greenland’s surface ice cover melted over a larger area than at any time in more than 30 years of satellite observations. Nearly the entire ice cover of Greenland, from its thin, low-lying coastal edges to its two-mile-thick center, experienced some degree of melting at its surface, according to measurements from three independent satellites analyzed by NASA and university scientists.
[…]
“Ice cores from Summit show that melting events of this type occur about once every 150 years on average. With the last one happening in 1889, this event is right on time,” says Lora Koenig, a Goddard glaciologist and a member of the research team analyzing the satellite data. “But if we continue to observe melting events like this in upcoming years, it will be worrisome.”
[…]
Summit Station’s summer peak temperatures flirted with 0°C for a few hours in late July.

Hence the somewhat unusual wide-spread, right-on-time melt.
This melt shows up very clearly in the Greenland Ice Sheet Albedo…

The “normal” summer melt season albedo minimum at 2500-3200m is in the range of 0.79-0.82. This year, it briefly dropped to just below 0.74.

“Normal” is based on 12 years of data. The GRACE measurements upon which the accelerating ice loss claims are based are heavily dependent on the Glacial Isostatic Adjustment (GIA). While not as large as Antarctica (where the GIA’s margin of error is nearly as large as the asserted ice loss), GIA variations can result in totally different ice loss values… And the GRACE time series isn’t any longer than the MODIS time series.
Wu et al., 2010 determined that the GIA commonly assumed for Greenland was way too high and that the 2002-2008 ice loss rate was 104 Gt/yr rather than the oft cited 230 Gt/yr. Even at 230 Gt/yr, it would take 1,000 years for Greenland to lose 5% of its ice mass.
Riva et al., 2007 concluded that the ice mass-loss rate in Antarctica from 2002-2007 could have been anywhere from zero-point-zero Gt/yr up to 120 Gt/yr. Dr. Riva recently co-authored a paper in GRL (Thomas et al., 2011) which concluded that GPS observations suggest “that modeled or empirical GIA uplift signals are often over-estimated” and that “the spatial pattern of secular ice mass change derived from Gravity Recovery and Climate Experiment (GRACE) data and GIA models may be unreliable, and that several recent secular Antarctic ice mass loss estimates are systematically biased, mainly too high.”
So… We have barely a decade’s worth of data and no idea if the modern melt rates and albedo changes are anomalous relative to the early 20th century Arctic warming, Medieval Warm Period or any of the other millennial-scale Holocene warming periods.
I’m gonna go out on a limb and say that unless some alarmist can tell me what the albedo was in 1899, 1127, 1143 and 1939, during the vast majority of the Holocene or during the Sangamonian, my response is, “Very interesting. Now, move along, there’s nothing more to see here.”

http://wattsupwiththat.com/2011/09/29/warming-island-greenland-sea-regional-climate-and-arctic-sea-ice-reconstruction/

(After Alley, 2000)

(NGRIP)
Manhattan-sized Icebergs!!!

(MSNBC)
Manhattan-sized Icebergs are insignificant relative to Greenland-sized ice sheets.
- Manhattan: 34 square miles.
- Greenland ice sheet: 660,235 square miles.
Manhattan = 0.005% of Greenland ice sheet. 99.995% of the Greenland ice sheet did not participate in this event.
If one Manhattan-sized chunk of ice calved into the ocean every year and there was no snow accumulation in Greenland for 1,000 years, Greenland would lose 5% of its ice sheet.

(Wikipedia and Google Earth)

(Climate4you)
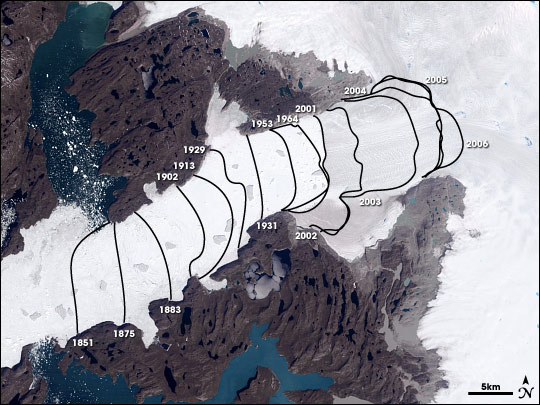
This is a Google Earth photo of Jakobshavn Isbrae, Greenland’s largest outlet glacier…The red lines represent the calving front’s retreat from 1851-1942.If the calving front retreated almost 20 km over that 90-yr period and Greenland’s ice sheet is supposedly vanishing (according to the Warmists), why does the Google Earth image show so much ice downstream of the calving front?
Surely if Jakobshavn Isbrae’s calving front retreated by nearly 20 km before SUV’s, it must have retreated much more than 20 km farther upstream that the 1942 front by now… Right?
(Wikipedia)
It appears to have only retreated by a bit more than 10 km since 1942… But, why is there still so much ice downstream of the calving front? If the Greenland ice sheet is disappearing, surely that must be open ocean… erm… open fjord by now… Right?
All that moving around of the calving front and all that lack of disappearing ice might lead someone to think that glaciers are rather dynamic…
Jakobshavn Isbrae – Greenland Glacier Has Always Changed With The Climate
By News Staff | July 16th 2011
New research on Jakobshavn Isbrae, a tongue of ice extending out to sea from Greenland’s west coast, shows that large, marine-calving glaciers don’t just shrink rapidly in response to global warming, they also grow at a remarkable pace during periods of global cooling. *Glaciers change.
[…]
Jakobshavn Isbrae has been the focus of intense scientific interest because it is one of the world’s fastest-flowing glaciers, releasing enormous quantities of Greenland’s ice into the ocean. It is believed that changes in the rate at which icebergs calve off from the glacier could influence global sea level rise. The decline of Jakobshavn Isbrae between 1850 and 2010 has been documented, mostly recently through aerial photographs and satellite photographs.
“We know that Jakobshavn Isbrae has retreated at this incredible rate in recent years, and our study suggests that it advanced that fast, also,” said Jason Briner, the associate professor of geology at the University of Buffalo, who led the research. “Our results support growing evidence that calving glaciers are particularly sensitive to climate change.”
[…]

(Wikipedia and Google Earth)
“Our results support growing evidence that calving glaciers are particularly sensitive to climate change.”Greenland’s climate is always changing… Always has and always will change… And the climate changes observed over the last few decades are not unprecedented. The Greenland ice sheet is no more disappearing this year than it was last year and it is physically impossible for the ice sheet to “collapse” into the ocean.
Discover more from Watts Up With That?
Subscribe to get the latest posts sent to your email.
Gunga Din says:
August 17, 2012 at 3:56 pm
OK. So what is the Greenland Ice supposed to be? If the melting is abnormal due to Man, what is normal?
Without knowing what “normal” is, how can anyone say what is happening is “abnormal”?
My question remains unanswered.
My own view is that we are in the later part of an interglacial, with changes in Earth’s orbital eccentricity gradually cooling high latitudes of the Northern Hemisphere as we move towards the next glacial period. Arctic ice should be getting thicker in Winter and gradually more extensive at all times of year. The Greenland ice sheet should be gaining mass and glaciers getting longer. Average temperatures worldwide should be dropping by about 0.6C per milennium and CO2 decreasing from 280ppm towards 200ppm.Sea level should decline as water accumulates in expanding glaciers and ice sheets.
This is what the information available suggests happened at this stage in previous interglacials. The end result in a few millenia should be ice sheets down to about 50N latitude for the next 90,000 years.
Entropic man says:
The satellite’s been up thirteen years and has so far given 12 years of data.
Reasking that which remains unanswered: You hold that 12 years of data produces a distribution that assigns exactly what meaning to the terms “divergence” and “normal variation”, exactly?
As to the validity of my analysis, if n<30 the variance gets very large, but it does not affect the basic technique.
It does affect the relevance of the results that are obtained by applying the basic technique. Principally by adding an “IR”.
“Real world”? There is one, unless you are a solipsist.
Oh, that isn’t in dispute. But your use of the term suggests that you also conceptualize an unreal world which somehow determines sub 2 sigma deivations from the mean here on earth. Do tell.
What are you doing?
Laughing at your posts.
Say, how goes the effort putting numbers to the other scary stories that you were telling about melting ice on the other thread:
http://wattsupwiththat.com/2012/08/13/sea-ice-news-volume-3-number-10-arcus-august-sea-ice-outlook-posted-plus-worries-over-arctic-storm-breaking-up-sea-ice/#comment-1059199
Perhaps when you did, you found it wasn’t so scary anymore, huh?
Entropic man says:
August 17, 2012 at 11:17 am
To simplify, the GRACE satellite keeps a running check on its position based on the GPS satellite network. This allows its orbit to be monitored to sufficient accuracy to detect changes due to mass concentrations like the Greenland ice sheet, effectively measuring the mass of the ice sheet.
Greenland floats on the Earth’s mantle like a boat in water. Like a boat, if weight is removed it floats higher. This is the GIA and happens if the ice mass decreases.
Since the effect of the ice sheet’s gravity on GRACE increase with mass and closeness to the satellite, ground based GPS measures of the uplift of the underlying rock are needed. This allows orbital changes due the mass of the ice to be distinguished from changes due to uplift, giving a more accurate measurement of ice mass and a better view of whether ice mass is changing with time.
In theory, yes.
But the inherent problem with the GRACE results is their very many but very much unknown and unverifiable “corrections” to the basic satellite movement data – and, more important, the many thousands of assumptions over each region that are combined to make the corrections.
The total mass (of icecap + continental crust + surface granite) over a region is probably fairly accurate from the data analysis of the relative movement of the two satellites. The total calculated mass (of continental crust + surface rock) where there is no ice is probably reliable. From a baseline, one can use the corrected GRACE data to probably generate reliable data for the change in continental mass over time.
But here is the problem, the elephant and the gorilla in the room downstairs for GRACE: they know the total of the elephant + the gorilla downstairs are changing, but they can’t tell which is getting larger, and which is getting smaller. They can (sort of) tell the total mass in the room is changing and that it is changing location because they are measuring the movement of the floor in the room above caused by the movement in the floor of the room below, but they can’t tell what is food, what is water, what is manure, and what is elephant and what part of that change in the floor position is gorilla. Nor can they absolutely tell if the whole building is tilting or twisting.
They are literally, measuring a baseline for Greenland isostatic continental bedplate + mountain rebound + mountain growth at the only two visible parts of Greenland that they can measure: the tips of the mountains on both coasts. Between? They have no baseline, no change in baseline, and no change in baseline trend (acceleration) measured over time. It is equal to pretending they are “measuring” the change in Niagara Falls’ whirlpool depth in upstate New York by measuring the height of the seawater water at New York City and the height of the water at Lake Michigan at Chicago by satellite. The distance between measurements of the two mountain tops is just that: the distance between New York and Chicago, and they don’t know the elevation of the Appalachian Mountains in between, much less the smaller Niagara Escarpment, nor the Niagara River bed itself. Worse, they don’t know if the Appalachians in between are raising or lowering elevation.
So they correct for tides, correct for water temperature changes, correct for saltwater expansion compared to freshwater expansion, correct for what they assume is isostatic rebound of the ground at both locations due to the glaciers melting, correct for continental drift, correct for the dredging of the harbor and the new sidewalk on Manhattan coast. Then they calculate the change in the height of the falls from year to year. And decided they can tell us whether the depth of the Niagara River bed is increasing.
They have one bore hole starting into the Greenland cap. No data for whether the icecap is increasing mass, or decreasing mass. Even though we have found aircraft frozen under the ice by hundreds of feet since WWII, they have decided that the Greenland Ice Cap IS melting, and that the entire change in mass they observe is due to the icecap melting, and NOT any other movement of the trillions of tons of rock getting pushed down by the increased icecap load.
Smokey says:
August 17, 2012 at 4:09 pm
Entropic says:
“Climate scientists have to convince ME that there is something going on that is not typical of Earth’s climate.”
^That^ statement shows unequivocally that Entropic is not a scientist.
———————————————————————————
Sorry to disappoint you, Smokey, but Gail Combs made that statement in her August 17th, 12.50pm comment.
8/18/2012 heavy snow fall in australia up to a 1mt 24 hours in some ski resorts more to come bring on global warming read what the CSIRO have to say http://www.abc.net.au/news/2008-05-28/global-warming-to-shorten-ski-season-csiro/2450790
A great post here to use against the endless media blitz on ice melt/sea level rise that we’re used to.
I also read the Lomborg post on Slate referred to above. A lot of confused comments on that. Inconsistent, tho there were the usual regulars who resented anyone from “the outside” treading on what they considered to be their territory (not uncommon on blog site comment threads).
I put up this comment myself on Lomborg’s Slate post, ideas I think the common thread there has never considered:
“Thank you to Slate for getting a rational person like Lomborg to post here. The long litany of carbon dioxide’s ills now sounds like a broken record. Some readers are apparently obsessed. It is not possible to change the weather by driving your car or building a power plant. Droughts come and droughts go, so do hurricanes and tornadoes. A tiny molecule consisting of two atoms of oxygen and one atom of carbon cannot move the jet stream at 200 miles per hour (to direct a storm), or create a giant 1000-mile wide high pressure dome (to bake the earth with descending air).”
“One fatal flaw in CO2 theory is conceptual. Some folks seem to give the molecule a kind of spirtual “essence of evil”. It is to them “The Evil Gas with Roots in Hell”. But CO2 is a material object. It is not an actor in weather, it is acted UPON. The theory’s proponents have never identified a MECHANISM by which CO2 would be capable of doing all the nasty things it is reviled for.”
“It must have quite a potent essence of evil to be able to do what it is accused of. It’s only 4 molecules out of every 10,000 in the atmosphere. That’s a puny amount. We are dealing with theology here, not science.”
From Smokey on August 17, 2012 at 4:09 pm:
*ahem*
Um, Smokey? You must have mis-copied something, as that particular line was from Gail Combs here.
David, It’s somewhat misleading to talk about glaciers flowing downhill in the context of Greenland. Greenland is basically a large ice filled depression surrounded by mountains. The weight of the ice pushes the edges of the ice out through gaps in the mountains forming outlet glaciers. It’s analogous to toothpaste being squeezed out of a tube.
For me the interesting point is the albedo change. Its a +ve feedback and must be contributing a significant proportion of the melt. To what extent is the albedo change natural, and to what extent is it due to anthropogenic particulates? And to what extent is the melt due to insolation changes?
Elsewhere in the world we see south facing glaciers (in the NH) retreating, while north facing ones aren’t (Himalayas, Cascade volcanoes). I strongly suspect this also the case in Greenland.
dorlomin, from the declining Guardian, is living in denial. Get with the program!!! Greenland will not all melt in your grandchildren’s lifetime.
RACookPE1978 says:
August 17, 2012 at 4:28 pm
“Even though we have found aircraft frozen under the ice by hundreds of feet since WWII, they have decided that the Greenland Ice Cap IS melting, and that the entire change in mass they observe is due to the icecap melting, and NOT any other movement of the trillions of tons of rock getting pushed down by the increased icecap load.”
This is the only part of your comment that I can answer in the short time I have left.Talk to David Middleton about GRACE.
The Greenland ice sheet grows from above each Winter as snowfall accumulates.Finding an aircraft like the P-38 now restored as “Glacier Girl” 260 feet down indicates that ice accumulates at about 4 feet a year. The weight on top of the ice sheet causes it to spread, with most melting taking place from the bottom and the edges, with some surface melt from warming in Summer and during occasional flash warming events like July 12th. It might take up to 100,000 years for a water molecule falling as snow on the icecap to return to the ocean. Whether the ice volume increases or decreases depends on the relative rates of accumulation and melting.
You might like to read the links in my 3.41pm comment. Some of these processes are discussed.
Goodnight , all.
Entropic man says:
August 17, 2012 at 3:32 pm
Consider Gail Combs. She has a hypothesis that the temperature variations we see are driven by three interlocking cycles of different lengths. Does she present data and calculations to demonstrate that this is so?……
============================
ROLLS EYES ~~ I am not the one who did the research turning up those cycles in the geologic record. It is people like Dr Richard Feynman’s sister who have.
AND You still have it Ass Backwards. I am not the one who is asking everyone in the world to start living like some medieval monk doing penance for enjoying life and GASP using energy to make my life comfortable. It is Climate Scientists/Activists and politicans who are.
The null hypothesis is nothing abnormal is happening and humankind can continue to use the energy that makes life more than a living hell. Climate Scientists are supposed to provide the proof there is a problem. Said Climate Scientists have had TRILLIONS of dollars thrown at them over a forty year period to do just that. (Which in itself is suspect) So what do they have to show for all that time and money???
1. A mangled, mutilated, ever changing temperature record that even they say is not showing the warming modeled.
2. A record of evading FOIA requests and even the Parliamentary request to get the Australian National Audit Office to reassess the BOM records. In response, the BOM, clearly afraid of getting audited, and still not providing all the data, code and explanations that were needed, decided to toss out the old so called High Quality (HQ) record, and start again. The lawsuit on the same subject in New Zealand has also been evaded. NIWA is squirming and squiggling in response. link A, From the “A goat ate my homework” excuse book: and link B and link C That does not include two lawsuits here in the USA and lots of dancing around the shoddy weatherstation siting that has been reluctantly addressed.
3. Then there is the fact TEMPERATURE is not even a good measure of the energy in the atmosphere! Forty years and they are measuring the wrong parameter. You have to include humidity and that is not increasing but decreasing. Therefore with the temperatures more or less stable for the last 10 to 15 years and the Global Atmospheric Specific Humidity decreasing the system energy is not increasing it is decreasing. graph
Which brings us to point
4. The temperature – CO2 response is logarithmic (actually it is a logarithmic relationship between IR absorption and CO2 concentration.) The more CO2 the less bang for the buck until it saturates and there is no more response. Graph (Wm2) and Graph temp response Also this discussion on the IPCC Logarithmic Formula SEE more technical discussions at Steve McIntyre’s Climate Audit
The Warmist/IPCC view is one of strong positive feedback playing a major role with the main culprit being H20 in all forms increasing in the atmosphere, and being viewed in all forms as a positive feedback on multidecadal and greater time frames. Only in this way can you get a “Run away” global warming from a gas near saturation.
And that is where the theory runs smack dab into reality. There is already enough CO2 in the atmosphere that additional amounts have smaller and smaller effects per the graphs above. More important the all important feed back that multiplies the effect of CO2 by a factor of three, Atmospheric Specific humidity is headed in the WRONG DIRECTION.
All I see at this point is an example of practical politics.
“The whole aim of practical politics is to keep the populace alarmed (and hence clamorous to be led to safety) by menacing it with an endless series of hobgoblins, all of them imaginary.” ~ H. L. Mencken
That means you are going to have to come up with something rock solid with all the data and methods open to validation and verification. Only in this way can you undo all the distrust generated by the scientific fraud being uncovered in all areas of science.
Entropic man says:
August 17, 2012 at 11:51 am
Sorry Entropic,
We do not have to convince “climate scientists”. They have to convince us that the null hypothesis, namely the existence of natural climate change cycles, is not the dominant factor in observed climate fluctuations. On the basis that there are times in the Holocene that have been warmer than the present and that historical evidence shows cyclical advances and retreats in glaciation, the onus is on your vaunted “climate scientists” to prove their hypothesis to us, the tax payer and their ultimate employer. They convince us, not we convince them. Capiche?
Entropic,
If you won’t listen to me, at least pay attention to Robert Austin.
The southern third of Greenland is too far south to have an ice-sheet. The summer solar insolation is too high to allow glaciers to build up. The only reason the ice-sheet is there is because of the ice accumulation in the centre/north during the ice ages.
If the interglacials last for 20,000 to 25,000 years (rather than the typical 10,000 to 15,000 years), the southern third of Greenland melts out and the centre/north height will drop by 500 metres or so.
The last time this happened was the interglacial at 400,000 years ago, which was not a particularly warm one (less than current temperatures probably), and the southern third of Greenland melted out and small trees even grew there.
The Greenland ice-sheet has been shrinking since the last glacial maximum and will continue to do so for 50,000 years or even 120,000 years (when the Milankovitch Cycles turn low enough for the next ice age to begin – they don’t until then).
That is the science .
Mr Lynn says:
August 17, 2012 at 9:19 am
Robin says:
August 17, 2012 at 8:53 am
Well here’s the latest in the related junk science education push. NSF just granted $19 million to push the manmade global warming meme in US classrooms on malleable, captive minds.
http://blogs.edweek.org/edweek/curriculum/2012/08/nsf_promotes_climate-change_ed.html?print=1
Good grief! How can we put a stop to the federal government promulgating junk science to kids?
Just electing a new President isn’t going to do it. The entrenched bureaucracies aren’t going to change unless people are fired and replaced.
/Mr Lynn
========================
Put me in the position and I can show even D. Trump how and when to speak the “two words”. 😉
Entropic man says:
August 17, 2012 at 4:25 pm
Sounds like you believe that we might be able to delay the next ice age through our profligate CO2 emissions. Not exactly the CAGW disaster that most warmists are promoting. Can one believe the hypothesized man made warming to be beneficent without summery excommunication from the warmist congregation?
summery excommunication
lol Best climate pun I’ve seen in a while.
Entropic man says:
August 17, 2012 at 4:25 pm
Gunga Din says:
August 17, 2012 at 3:56 pm
OK. So what is the Greenland Ice supposed to be? If the melting is abnormal due to Man, what is normal?
Without knowing what “normal” is, how can anyone say what is happening is “abnormal”?
My question remains unanswered.
E-Man says: My own view is that we are in the later part of an interglacial, with changes in Earth’s orbital eccentricity gradually cooling high latitudes of the Northern Hemisphere as we move towards the next glacial period. Arctic ice should be getting thicker in Winter and gradually more extensive at all times of year. The Greenland ice sheet should be gaining mass and glaciers getting longer. Average temperatures worldwide should be dropping by about 0.6C per milennium and CO2 decreasing from 280ppm towards 200ppm.Sea level should decline as water accumulates in expanding glaciers and ice sheets.
This is what the information available suggests happened at this stage in previous interglacials. The end result in a few millenia should be ice sheets down to about 50N latitude for the next 90,000 years.
========================================================================
Thanks for giving your view.
As far as Greenland goes, the information from the ice cores in the post shows that the current melting is right on schedule. Nothing “unprecedented”. No indication that Man has made anything “abnormal”.
The only thing that would be abnormal about it would be if the CAGWers passed up the opportunity to spin a headline from it.
A very interesting article, thank you. Also, some excellent comments.
The Entropic Man was making waves for a while there, but ultimate PWNAGE at the hands of Gail Combs, JJ and Robert Austin was inevitable. No wonder he scooted ‘off to bed’!
}:o)
@Gail
TAR
Section 1.3.1 of TAR stated:
…It has been suggested that the absorption by CO2 is already saturated so that an increase would have no effect. This, however, is not the case. Carbon dioxide absorbs infrared radiation in the middle of its 15 mm band to the extent that radiation in the middle of this band cannot escape unimpeded: this absorption is saturated. This, however, is not the case for the band’s wings. It is because of these effects of partial saturation that the radiative forcing is not proportional to the increase in the carbon dioxide concentration but shows a logarithmic dependence. Every further doubling adds an additional 4 Wm-2 to the radiative forcing.
Actually, I’d dispute this as a distortion,the assumption about this falls out of the Comparison of Earth and Venus (1, and 100ATM atmospheres ) Spectrographic analysis shows that the width of the CO2 absorption band is wider on Venus than Earth. But Lets add in Mars, Mars has an atmospheric pressure of 0.007 ATM or about 0.7% of that of the earth, almost all carbon dioxide, while the Earths CO2 partial pressure is about 0.04% (400ppm) so Mars has 0.7/0.04 or 17.5 times the CO2 in its atmosphere than Earth does, but has NARROWER absorption bands than Earth. This leads my mind to conclude that the width of the CO2 Absorption band is related to Atmospheric density and not the amount (partial pressure) of CO2.
The corollary of this is that for CO2 to widen the absorption band, it must add to the volume of the atmosphere, however we note that when we burn things, we combine two oxygen atoms from the atmosphere with carbon from the fuel and produce the same amount of carbon dioxide as the oxygen we extract. CO2 does not therefore add to Atmospheric pressure and is incapable of widening the absorption bands. CO2 will therefore actually saturate. I don’t think the Physics here is quite right.
It may be that I am wrong here, so I’m quite open to being corrected.
I suggest you actually read the post before commenting.
Bobl says:
August 17, 2012 at 9:07 pm
As far as I remember from the course some 45 years ago, it is the total number of molecules in the light pathway which is of interest. In the CO2 case, that is percentage of CO2 molecules x air density x length of the pathway. Thus for Mars, the percentage of CO2 is high, but density and pathway are way smaller than on earth…
Entropic man says:
August 17, 2012 at 10:57 am
Thank you, for the answer and the link, however the link does not seem to work… eventually could you write it in full so that I can copy-paste and try to read the article?
Lars P:
re. your post at August 18, 2012 at 2:08 am which is addressed to the paid troll who posts as Entropic man.
Please see my post addressed to JJ at August 17, 2012 at 2:32 pm.
As you can see, despite repeated requests the paid troll has not answered JJ’s question but he/she/they have made several subsequent posts which include evasions and excuses.
As I said in my post addressed to JJ, this is what that troll always does and I gave my understanding of why he/she/they does it. (I assume it pleases his/her/their paymasters).
I suggest that he/she/they should be ignored.
Richard
Bobl says:
August 17, 2012 at 9:07 pm
@Gail
TAR
Section 1.3.1 of TAR stated:
…It has been suggested that the absorption by CO2 is already saturated ….
Actually, I’d dispute this as a distortion,…..
The corollary of this is that for CO2 to widen the absorption band, it must add to the volume of the atmosphere, however we note that when we burn things, we combine two oxygen atoms from the atmosphere with carbon from the fuel and produce the same amount of carbon dioxide as the oxygen we extract. CO2 does not therefore add to Atmospheric pressure and is incapable of widening the absorption bands. CO2 will therefore actually saturate. I don’t think the Physics here is quite right.
It may be that I am wrong here, so I’m quite open to being corrected.
__________________________________
Bobl, I was only using the TAR quote to validate the log relationship. The widening of the absorption bands may be due to the increase in partial pressure not the absolute pressure. BTW. Even with that you are still not talking ‘CATASTROPHIC’ warming because the evidence says there is no increase in H2O so the factor of three multiplier is just not there and at 400 ppm we are at the diminishing returns end of the logarithmic curve.
So even using their physics, their logarithmic response at higher ppm of CO2 and the proven reduction in Atmospheric Specific Humidity from NOAA they do not have the data supporting the theory of a ‘CATASTROPHIC’ increase in temperature.
You could even say the CO2 curve and the temperature curve for the last twenty years is following the log response curve! (snicker)