Guest Post by David Middleton
“Satellites See Unprecedented Greenland Ice Sheet Surface Melt… Right On Time”

I guess Professor Tedesco missed this…
“Ice cores from Summit show that melting events of this type occur about once every 150 years on average. With the last one happening in 1889, this event is right on time,” says Lora Koenig, a Goddard glaciologist and a member of the research team analyzing the satellite data.
How can an ice sheet surface melt be both “unprecedented” and “right on time”?
It can’t. However, nothing is impossible when you combine govt bureaucrats and the junk science of anthropogenic global warming…

Satellites See Unprecedented Greenland Ice Sheet Surface Melt
07.24.12
For several days this month, Greenland’s surface ice cover melted over a larger area than at any time in more than 30 years of satellite observations. Nearly the entire ice cover of Greenland, from its thin, low-lying coastal edges to its two-mile-thick center, experienced some degree of melting at its surface, according to measurements from three independent satellites analyzed by NASA and university scientists.
[…]
“Ice cores from Summit show that melting events of this type occur about once every 150 years on average. With the last one happening in 1889, this event is right on time,” says Lora Koenig, a Goddard glaciologist and a member of the research team analyzing the satellite data. “But if we continue to observe melting events like this in upcoming years, it will be worrisome.”
[…]
Summit Station’s summer peak temperatures flirted with 0°C for a few hours in late July.

Hence the somewhat unusual wide-spread, right-on-time melt.
This melt shows up very clearly in the Greenland Ice Sheet Albedo…

The “normal” summer melt season albedo minimum at 2500-3200m is in the range of 0.79-0.82. This year, it briefly dropped to just below 0.74.

“Normal” is based on 12 years of data. The GRACE measurements upon which the accelerating ice loss claims are based are heavily dependent on the Glacial Isostatic Adjustment (GIA). While not as large as Antarctica (where the GIA’s margin of error is nearly as large as the asserted ice loss), GIA variations can result in totally different ice loss values… And the GRACE time series isn’t any longer than the MODIS time series.
Wu et al., 2010 determined that the GIA commonly assumed for Greenland was way too high and that the 2002-2008 ice loss rate was 104 Gt/yr rather than the oft cited 230 Gt/yr. Even at 230 Gt/yr, it would take 1,000 years for Greenland to lose 5% of its ice mass.
Riva et al., 2007 concluded that the ice mass-loss rate in Antarctica from 2002-2007 could have been anywhere from zero-point-zero Gt/yr up to 120 Gt/yr. Dr. Riva recently co-authored a paper in GRL (Thomas et al., 2011) which concluded that GPS observations suggest “that modeled or empirical GIA uplift signals are often over-estimated” and that “the spatial pattern of secular ice mass change derived from Gravity Recovery and Climate Experiment (GRACE) data and GIA models may be unreliable, and that several recent secular Antarctic ice mass loss estimates are systematically biased, mainly too high.”
So… We have barely a decade’s worth of data and no idea if the modern melt rates and albedo changes are anomalous relative to the early 20th century Arctic warming, Medieval Warm Period or any of the other millennial-scale Holocene warming periods.
I’m gonna go out on a limb and say that unless some alarmist can tell me what the albedo was in 1899, 1127, 1143 and 1939, during the vast majority of the Holocene or during the Sangamonian, my response is, “Very interesting. Now, move along, there’s nothing more to see here.”

http://wattsupwiththat.com/2011/09/29/warming-island-greenland-sea-regional-climate-and-arctic-sea-ice-reconstruction/

(After Alley, 2000)

(NGRIP)
Manhattan-sized Icebergs!!!

(MSNBC)
Manhattan-sized Icebergs are insignificant relative to Greenland-sized ice sheets.
- Manhattan: 34 square miles.
- Greenland ice sheet: 660,235 square miles.
Manhattan = 0.005% of Greenland ice sheet. 99.995% of the Greenland ice sheet did not participate in this event.
If one Manhattan-sized chunk of ice calved into the ocean every year and there was no snow accumulation in Greenland for 1,000 years, Greenland would lose 5% of its ice sheet.

(Wikipedia and Google Earth)

(Climate4you)
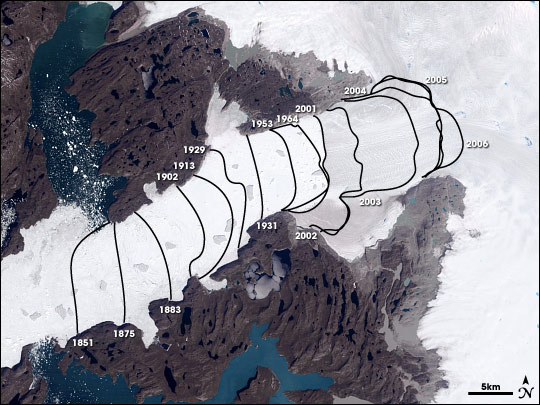
This is a Google Earth photo of Jakobshavn Isbrae, Greenland’s largest outlet glacier…The red lines represent the calving front’s retreat from 1851-1942.If the calving front retreated almost 20 km over that 90-yr period and Greenland’s ice sheet is supposedly vanishing (according to the Warmists), why does the Google Earth image show so much ice downstream of the calving front?
Surely if Jakobshavn Isbrae’s calving front retreated by nearly 20 km before SUV’s, it must have retreated much more than 20 km farther upstream that the 1942 front by now… Right?
(Wikipedia)
It appears to have only retreated by a bit more than 10 km since 1942… But, why is there still so much ice downstream of the calving front? If the Greenland ice sheet is disappearing, surely that must be open ocean… erm… open fjord by now… Right?
All that moving around of the calving front and all that lack of disappearing ice might lead someone to think that glaciers are rather dynamic…
Jakobshavn Isbrae – Greenland Glacier Has Always Changed With The Climate
By News Staff | July 16th 2011
New research on Jakobshavn Isbrae, a tongue of ice extending out to sea from Greenland’s west coast, shows that large, marine-calving glaciers don’t just shrink rapidly in response to global warming, they also grow at a remarkable pace during periods of global cooling. *Glaciers change.
[…]
Jakobshavn Isbrae has been the focus of intense scientific interest because it is one of the world’s fastest-flowing glaciers, releasing enormous quantities of Greenland’s ice into the ocean. It is believed that changes in the rate at which icebergs calve off from the glacier could influence global sea level rise. The decline of Jakobshavn Isbrae between 1850 and 2010 has been documented, mostly recently through aerial photographs and satellite photographs.
“We know that Jakobshavn Isbrae has retreated at this incredible rate in recent years, and our study suggests that it advanced that fast, also,” said Jason Briner, the associate professor of geology at the University of Buffalo, who led the research. “Our results support growing evidence that calving glaciers are particularly sensitive to climate change.”
[…]

(Wikipedia and Google Earth)
“Our results support growing evidence that calving glaciers are particularly sensitive to climate change.”Greenland’s climate is always changing… Always has and always will change… And the climate changes observed over the last few decades are not unprecedented. The Greenland ice sheet is no more disappearing this year than it was last year and it is physically impossible for the ice sheet to “collapse” into the ocean.
The Danish DMI noted on July 27, 2012 that the Greenland Summit regularly gets above 0.0C in the summer.
This DMI report was done in response to the original “science/myth” pushed out by NASA and a NASA-based Greenland ice core scientist Lora Koenig.
Google English translation version of the DMI on July 27, 2012 and they don’t sound pleased.
http://translate.google.ca/translate?hl=en&ie=UTF8&u=http://www.dmi.dk/dmi/t_vejr_pa_gr_nlands_top
http://www.dmi.dk/dmi/groenland2.gif
Record temp at the Summit is +4.4C.
Entropic man says:
August 17, 2012 at 10:05 am
I notice from the graph of albedo against day of the year that mean…
___________________________________
The earth’s climate is not static. You have just found evidence that it is not static. Congratulations.
See my last comment on the ~ 1500 yr Bond events and Dansgaard- Oeschger oscillations and the ~ 88 yr and the ~ 200 yr cycles found by Dr Alexander Ruzmaikin and Dr. Joan Feynman of NASA.
“If the calving front retreated almost 20 km over that 90-yr period and Greenland’s ice sheet is supposedly vanishing (according to the Warmists), why does the Google Earth image show so much ice downstream of the calving front?”
I’m not particularly an expert on the subject, but aren’t you simply confusing sea ice and ice shelves? Every winter, sea ice forms around most of Greenland; every summer most of that seas ice around Greenland melts again. http://igloo.atmos.uiuc.edu/cgi-bin/test/print.sh?fm=03&fd=01&fy=2011&sm=09&sd=01&sy=2011
This sea ice is typically no more than 5 m thick. The front of the Peterman Glacier is ~ 50 m thick. So sea ice several meters thick (varying by season) would be expected “downstream” from the end of the glacier/ice shelf. The calving front could and would be FAR upstream from the end of the thin sea ice.
Gail, please show me, with numbers, that the warming effect observed is consistent with the cycles you mention. You need to show that the overall effect of the three cycles shows a warming trend at present and that the amount of energy they are pumping into the system is consistent with the changes we see. If you want to convince the climate scientists that these cycles, and not cAGW, responsible for the changes we see, you ned to demonstrate that they better fit the real world data.
Neil Gundel says:
August 17, 2012 at 11:24 am
“The portion relating to calving seems to be making the unremarkable point that this is normal during periods of global warming, which he seems to concede is now happening.”
————————————————
A glacier forms inland and flows downhill. On land it melts when it reaches the 0C temperature contour, this defines the tip. In Winter the lower temperatures allow the tip to move downhill and in Summer it retreats uphill. The highest tip position during Summer is used to define the length of the glacier
If the climate warms, the Summer 0C contour moves uphill and the glacier melts higher up the valley. If climate cools the 0C contour moves downhill and so does the melting tip of the glacier.
If a glacier reaches the sea, the end floats and, as well as melting, pieces break off the tip or the entire tip detaches. This is calving and happens every year at the position where the tip of the glacier reaches 0C.
In Winter or in a a cold period the glacier extends the full lenght of its fjord and the tip pushes out into the sea ice. In Summer it calves in the fjord. As the Summer warms the calving front recedes up the fjord, furthest inland at the peak Summer temperatures.
A long-term warming trend causes a trend in calving points, with the Summer minimum moving further inland over the years. This shows in the Jakobshavn Isbrae photos, in which the ice flows from a source on the right towards the sea on the left, while the Summer maximum calving point has moved inland to the right over the last 162 years.
If the calving front retreated almost 20 km over that 90-yr period and Greenland’s ice sheet is supposedly vanishing (according to the Warmists), why does the Google Earth image show so much ice downstream of the calving front?
The calving front is the position where the glacier breaks up into bergs, it does not mean that the bergs cease to exist downstream of the front, in fact a glacier like Jakobshavn which advances at about 20m/day you’d expect a continuous production of bergs to keep the fjord downstream filled.
Entropic man says:
August 17, 2012 at 11:51 am
…..If you want to convince the climate scientists that these cycles, and not cAGW, responsible for the changes we see, you ned to demonstrate that they better fit the real world data. that these cycles, and not cAGW, responsible for the changes we see, you ned to demonstrate that they better fit the real world data.
_____________________
NOPE, you have it backwards. Climate scientists have to convince ME that there is something going on that is not typical of Earth’s climate.
A look at the last five interglacials Vostok Graph show there is no excess heating in the Holocene. The Holocene isn’t even as hot as other interglacials were. A look at the Greenland Holocene Graph shows the earth is not warming but gradually cooling during the Holocene. And more than one paper states were are heading into a glaciation.
Entropic man says:
For the statistically naive among you, sigma is a measure of how much individual measurements spread above and below the mean.The probability of seeing a measurement more than 2 sigma away from the mean is less than 5%.
This is the generally accepted threshold at which a scientist would become interested and start looking for a reason for the divergence, rather than just accepting it as part of the normal variation.
The statistically astute among as would like to ask you to describe the period of observation that produced the distribution against which you are comparing this “extreme” event, and to reconcile that with your use of the terms “divergence” and “normal variation”. Ooh! and “real world”. That is a doozy.
From Tim Folkerts on August 17, 2012 at 11:48 am:
Google Maps: Jakobshavn Isbrae (zoom out as needed)
From DMI: Satellite images of Disko region
Recent AQUA satellite image, Jakobshavn Isbrae calving area clearly visible:
http://ocean.dmi.dk/arctic/images/MODIS/Disko/20120816AQUA.jpg
Do you think that could be sea ice instead of calved-off ice shelf chunks? With the calving front more that 30 miles inland?
Paul Homewood says:
August 17, 2012 at 10:10 am
I am intrigued to know what the Warmists thought would have happened to the Peterman glacier if it had not calved off. Would it have continued to grow forever?
===============================================================
I would have become Peterman’s p ….. no. Better not.
“The world’s most viewed site on global warming and climate change”
Really?
Which is the most viewed site on the science of global warming and climate change?
[Reply: One and the same, note the content and the awards on the sidebar. ~mod]
YIKES! Typo.
“I would have become Peterman’s p ….. no. Better not.”
Should be “IT would have become Peterman’s p ….. no. Better not.”
JJ:
Don’t hold your breath waiting for a reply. The paid troll snows a thread with untrue assertions phrased to imply he/she/they knows something about the subject and makes arrogant excuses if pressed to justify the assertions.
The purpose of this behaviour seems to be to mislead ‘lurkers’ who are unfamiliar with the subject.
Richard
The applicability of statistics to things like sea ice is very questionable. As soon as an event occurs like the wind driven melt in 2007 the baseline period has no meaning. It’s now apples and oranges. These are not random events and the use of statistics requires a little thinking instead of throwing out worthless numbers.
But then why am I not surprised that a true believer would either be ignorant or try to fool people with statistical lies.
Gail Combs says:
August 17, 2012 at 12:50 pm
Entropic man says:
August 17, 2012 at 11:51 am
…..If you want to convince the climate scientists that these cycles, and not cAGW, responsible for the changes we see, you ned to demonstrate that they better fit the real world data. that these cycles, and not cAGW, responsible for the changes we see, you ned to demonstrate that they better fit the real world data.
_____________________
NOPE, you have it backwards. Climate scientists have to convince ME that there is something going on that is not typical of Earth’s climate.
=======================================================================
A few times on different post I’ve asked just what (ice, sea level, temps, climate, etc.) is SUPPOSED to be if Man’s influence were removed from the equation. I’ve never seen anyone answer that.
I didn’t even notice… LOL.
It literally was an unintended pun… Must’ve been Freudian… 😉
The raw GRACE measurements indicate a net mass gain (44 ±20 Gt/yr) from October 2003 through February 2007. Figure 2. Total Mass Difference: TMD = Actual GRACE measurements. TMD – IJ05 and TMD – ICE5G = GRACE measurements adjusted for GIA (Riva et al., 2007).
We know that the crust is rising due isostatic rebound from the last glacial maximum; but we don’t know the rate of crustal rebound. Most GIA’s are model-derived. Over the last 5 years, a lot of work with GPS measurements of isostatic rebound have shown that the model-derived GIA’s “are systematically biased, mainly too high.” The GPS measurements indicate that GIA is generally much lower than the model-derived GIA in both Greenland and Antarctica,
The problem is that the GRACE-based pronouncements of accelerating ice mass loss are based on model-derived, rather than measured, GIA.
GRACE is a really cool instrument package. However, its measurements are nearly worthless if they are modified with a GIGO GIA.
JJ says:
August 17, 2012 at 1:28 pm
The satellite’s been up thirteen years and has so far given 12 years of data. As to the validity of my analysis, if n<30 the variance gets very large, but it does not affect the basic technique.
"Real world"? There is one, unless you are a solipsist. I'm trying to understand it better using whatever comes to hand. What are you doing?
“nothing is impossible when you combine govt bureaucrats and the junk science of anthropogenic global warming”
Would Lora Koenig fall into the category of govt bureaucrat? I guess the important thing to remember is believe the bureaucrat that best expresses your own world view.
Gunga Din says:
August 17, 2012 at 2:35 pm
Gail Combs says:
August 17, 2012 at 12:50 pm
NOPE, you have it backwards. Climate scientists have to convince ME that there is something going on that is not typical of Earth’s climate.
=======================================================================
A few times on different post I’ve asked just what (ice, sea level, temps, climate, etc.) is SUPPOSED to be if Man’s influence were removed from the equation. I’ve never seen anyone answer that.
_-_-_-_-_-_-_-_-_
I get that a lot here, Gunga Din. These people are negative. They are good at sounding doubtful about cAGW, but have problems coming up with alternatives.
Consider Gail Combs. She has a hypothesis that the temperature variations we see are driven by three interlocking cycles of different lengths. Does she present data and calculations to demonstrate that this is so?
She does not.
This double standard is very evident here. I am constantly asked to prove my own ideas, , but few of the sceptics ever even try to prove their own. Those that do try, tend to present strange graphs and say “Look, this proves it!”. They provide no background argument or explaination.
The only time Gail convinced me of anything was to improve my understanding of the complexity of air conditioner/ weather station interactions. Even then I had to do most of the legwork.
In any proper scientific forum these people would be slaughtered, which is probably why they hide here among friends instead of doing real science and taking it out into the real world.
Mr. Watts 2012 paper is a valiant effort to operate at the level of professional scientific debate. I hope it reaches publishable standard. Most of the rest of the sceptic comments here follow the old rule that 90% of everything is rubbish.
David Middleton says:
August 17, 2012 at 3:04 pm
The problem is that the GRACE-based pronouncements of accelerating ice mass loss are based on model-derived, rather than measured, GIA.
GRACE is a really cool instrument package. However, its measurements are nearly worthless if they are modified with a GIGO GIA.
————————-
Maybe this upgrade to the system will help.
http://researchnews.osu.edu/archive/gpsspring.htm
http://www.pnas.org/content/109/30/11944.full?sid=1a3dc591-09fd-46ed-a2c8-fa61848ec70f
KD Knoebel,
Thanks for those links — I learned a bit more about glaciers. In particular:
“Icebergs breaking from the glacier are often so large (up to a kilometer in height) that they are too tall to float down the fjord and lie stuck on the bottom of its shallower areas, sometimes for years, until they are broken up by the force of the glacier and icebergs further up the fjord. ”
and
“Thinning causes the glacier to be more buoyant, even becoming afloat at the calving front, and is responsive to tidal changes. ”
(Both from Wikipedia)
So the calving front is “inland” but not “on land” — still in a deep fjord that can have water in the bottom. Ice breaks free but then can’t easily escape. So we have “crushed ice” potentially 100’s of meters thick getting pushed in front of the actual glacier. This region is neither glacier nor ice shelf nor sea ice
Entropic man says:
August 17, 2012 at 3:32 pm
Gunga Din says:
August 17, 2012 at 2:35 pm
Gail Combs says:
August 17, 2012 at 12:50 pm
NOPE, you have it backwards. Climate scientists have to convince ME that there is something going on that is not typical of Earth’s climate.
=======================================================================
Me: A few times on different post I’ve asked just what (ice, sea level, temps, climate, etc.) is SUPPOSED to be if Man’s influence were removed from the equation. I’ve never seen anyone answer that.
_-_-_-_-_-_-_-_-_
E-man: I get that a lot here, Gunga Din. These people are negative. They are good at sounding doubtful about cAGW, but have problems coming up with alternatives.
==============================================================
OK. So what is the Greenland Ice supposed to be? If the melting is abnormal due to Man, what is normal?
Without knowing what “normal” is, how can anyone say what is happening is “abnormal”?
My question remains unanswered.
Entropic says:
“Climate scientists have to convince ME that there is something going on that is not typical of Earth’s climate.”
^That^ statement shows unequivocally that Entropic is not a scientist. A scientist abides by the scientific method. But Entropic trying to put scientific skeptics in the position of having to prove a negative. That is not the scientific method; that is wild-eyed witch doctor territory.
I recommend that Entropic get up to speed on the null hypothesis, which shows clearly that nothing unusual is happening. Everything we observe today, from Arctic ice cover to temperatures, has routinely happened before. The null hypothesis has never been falsified, which destroys the CAGW science fiction fantasy.