Guest Post by David Middleton
“Satellites See Unprecedented Greenland Ice Sheet Surface Melt… Right On Time”

I guess Professor Tedesco missed this…
“Ice cores from Summit show that melting events of this type occur about once every 150 years on average. With the last one happening in 1889, this event is right on time,” says Lora Koenig, a Goddard glaciologist and a member of the research team analyzing the satellite data.
How can an ice sheet surface melt be both “unprecedented” and “right on time”?
It can’t. However, nothing is impossible when you combine govt bureaucrats and the junk science of anthropogenic global warming…

Satellites See Unprecedented Greenland Ice Sheet Surface Melt
07.24.12
For several days this month, Greenland’s surface ice cover melted over a larger area than at any time in more than 30 years of satellite observations. Nearly the entire ice cover of Greenland, from its thin, low-lying coastal edges to its two-mile-thick center, experienced some degree of melting at its surface, according to measurements from three independent satellites analyzed by NASA and university scientists.
[…]
“Ice cores from Summit show that melting events of this type occur about once every 150 years on average. With the last one happening in 1889, this event is right on time,” says Lora Koenig, a Goddard glaciologist and a member of the research team analyzing the satellite data. “But if we continue to observe melting events like this in upcoming years, it will be worrisome.”
[…]
Summit Station’s summer peak temperatures flirted with 0°C for a few hours in late July.

Hence the somewhat unusual wide-spread, right-on-time melt.
This melt shows up very clearly in the Greenland Ice Sheet Albedo…

The “normal” summer melt season albedo minimum at 2500-3200m is in the range of 0.79-0.82. This year, it briefly dropped to just below 0.74.

“Normal” is based on 12 years of data. The GRACE measurements upon which the accelerating ice loss claims are based are heavily dependent on the Glacial Isostatic Adjustment (GIA). While not as large as Antarctica (where the GIA’s margin of error is nearly as large as the asserted ice loss), GIA variations can result in totally different ice loss values… And the GRACE time series isn’t any longer than the MODIS time series.
Wu et al., 2010 determined that the GIA commonly assumed for Greenland was way too high and that the 2002-2008 ice loss rate was 104 Gt/yr rather than the oft cited 230 Gt/yr. Even at 230 Gt/yr, it would take 1,000 years for Greenland to lose 5% of its ice mass.
Riva et al., 2007 concluded that the ice mass-loss rate in Antarctica from 2002-2007 could have been anywhere from zero-point-zero Gt/yr up to 120 Gt/yr. Dr. Riva recently co-authored a paper in GRL (Thomas et al., 2011) which concluded that GPS observations suggest “that modeled or empirical GIA uplift signals are often over-estimated” and that “the spatial pattern of secular ice mass change derived from Gravity Recovery and Climate Experiment (GRACE) data and GIA models may be unreliable, and that several recent secular Antarctic ice mass loss estimates are systematically biased, mainly too high.”
So… We have barely a decade’s worth of data and no idea if the modern melt rates and albedo changes are anomalous relative to the early 20th century Arctic warming, Medieval Warm Period or any of the other millennial-scale Holocene warming periods.
I’m gonna go out on a limb and say that unless some alarmist can tell me what the albedo was in 1899, 1127, 1143 and 1939, during the vast majority of the Holocene or during the Sangamonian, my response is, “Very interesting. Now, move along, there’s nothing more to see here.”

http://wattsupwiththat.com/2011/09/29/warming-island-greenland-sea-regional-climate-and-arctic-sea-ice-reconstruction/

(After Alley, 2000)

(NGRIP)
Manhattan-sized Icebergs!!!

(MSNBC)
Manhattan-sized Icebergs are insignificant relative to Greenland-sized ice sheets.
- Manhattan: 34 square miles.
- Greenland ice sheet: 660,235 square miles.
Manhattan = 0.005% of Greenland ice sheet. 99.995% of the Greenland ice sheet did not participate in this event.
If one Manhattan-sized chunk of ice calved into the ocean every year and there was no snow accumulation in Greenland for 1,000 years, Greenland would lose 5% of its ice sheet.

(Wikipedia and Google Earth)

(Climate4you)
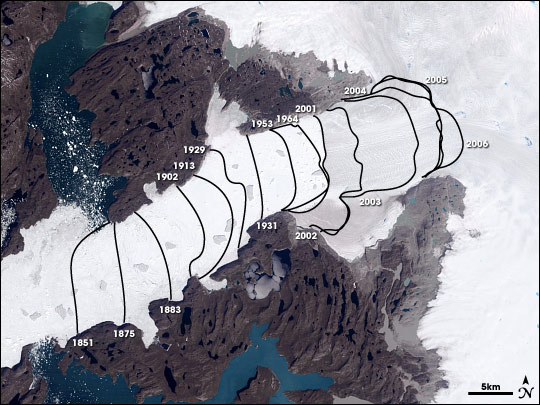
This is a Google Earth photo of Jakobshavn Isbrae, Greenland’s largest outlet glacier…The red lines represent the calving front’s retreat from 1851-1942.If the calving front retreated almost 20 km over that 90-yr period and Greenland’s ice sheet is supposedly vanishing (according to the Warmists), why does the Google Earth image show so much ice downstream of the calving front?
Surely if Jakobshavn Isbrae’s calving front retreated by nearly 20 km before SUV’s, it must have retreated much more than 20 km farther upstream that the 1942 front by now… Right?
(Wikipedia)
It appears to have only retreated by a bit more than 10 km since 1942… But, why is there still so much ice downstream of the calving front? If the Greenland ice sheet is disappearing, surely that must be open ocean… erm… open fjord by now… Right?
All that moving around of the calving front and all that lack of disappearing ice might lead someone to think that glaciers are rather dynamic…
Jakobshavn Isbrae – Greenland Glacier Has Always Changed With The Climate
By News Staff | July 16th 2011
New research on Jakobshavn Isbrae, a tongue of ice extending out to sea from Greenland’s west coast, shows that large, marine-calving glaciers don’t just shrink rapidly in response to global warming, they also grow at a remarkable pace during periods of global cooling. *Glaciers change.
[…]
Jakobshavn Isbrae has been the focus of intense scientific interest because it is one of the world’s fastest-flowing glaciers, releasing enormous quantities of Greenland’s ice into the ocean. It is believed that changes in the rate at which icebergs calve off from the glacier could influence global sea level rise. The decline of Jakobshavn Isbrae between 1850 and 2010 has been documented, mostly recently through aerial photographs and satellite photographs.
“We know that Jakobshavn Isbrae has retreated at this incredible rate in recent years, and our study suggests that it advanced that fast, also,” said Jason Briner, the associate professor of geology at the University of Buffalo, who led the research. “Our results support growing evidence that calving glaciers are particularly sensitive to climate change.”
[…]

(Wikipedia and Google Earth)
“Our results support growing evidence that calving glaciers are particularly sensitive to climate change.”Greenland’s climate is always changing… Always has and always will change… And the climate changes observed over the last few decades are not unprecedented. The Greenland ice sheet is no more disappearing this year than it was last year and it is physically impossible for the ice sheet to “collapse” into the ocean.
Discover more from Watts Up With That?
Subscribe to get the latest posts sent to your email.
Good article by Lomborg over at Slate. Strikes back at the alarmist nonsense spewed by Krugman that global warming is causing everything.
http://www.slate.com/articles/health_and_science/project_syndicate/2012/08/lomborg_paul_krugman_is_wrong_to_say_that_climate_change_causes_extreme_weather_.html
Good stuff Dave Middleton.
If possible, please separate your article into two different articles on WUWT.
Your “Manhattan-sized Icebergs!!!” section is very interesting and should be a stand alone article, so it gets more views. You can still put in links from one article to the other, but I think a lot of people would like to see your Manhattan-sized Icebergs!!! write-up by itself. It could give it more widespread distribution. As it is, it may be buried so far into the first article and missed by too many people, who would like to see it and pass it on. Just a suggestion.
Well here’s the latest in the related junk science education push. NSF just granted $19 million to push the manmade global warming meme in US classrooms on malleable, captive minds.
http://blogs.edweek.org/edweek/curriculum/2012/08/nsf_promotes_climate-change_ed.html?print=1
Part of their on-going campaign to use our tax money and education and the social sciences to influence perceptions of reality. Actual reality that is inconveniently not supporting the useful collectivist political theory and treasury looting scheme for political cronies can be ignored if you can just catch that filtering mindset at the right time.
What an expensive farce that is to be going on in schools.
Seconded!
@Ben Klijn,
Thanks!
There are already several separate WUWT articles on these two subjects. I wanted to combine the alarmism into one summary. Much of this post was built from comments of mine on those posts.
I got it, I know where the lost ice has gone – It fell on Canberra!
I do not think they know what “unprecedented” means.
Good grief! How can we put a stop to the federal government promulgating junk science to kids?
Just electing a new President isn’t going to do it. The entrenched bureaucracies aren’t going to change unless people are fired and replaced.
/Mr Lynn
Thanks David, nothing like a little historical perspective to counter the modern hysterical perspective.
I love the way they have nicked the albedo graph from a real scientist, Jason Box’s blog. People should read Jasons blog rather than this empty headed psuedoscience.
REPLY: Pay “dorlomin” no mind, he obviously can’t reconcile the fact that the graphs and discussion he’s whining about don’t show what he wants, so therefore he must issue the usual condemnation. Watching “dorlomin” over the years, he has yet to contribute anything to the debate except complaints. He’s one of those commenters who’s comments are entirely predictable. – Anthony
“Satellites See Unprecedented Greenland Ice Sheet Surface Melt… Right On Time”
David, you appear to imply that Prof Tedesco actually said this whereas I see no evidence of that.
Glaciers reached a peak in the 1700s and have been retreating long before the industrial revolution,” This is posted online here from the National Park Service:
http://www.fs.fed.us/r10/tongass/districts/mendenhall/faq.html
I notice from the graph of albedo against day of the year that mean and 1 sigma values are 80.5+/- 1.5%. This makes the 95% confidence limits (2 sigma)+/-3%.
For the statistically naive among you, sigma is a measure of how much individual measurements spread above and below the mean.The probability of seeing a measurement more than 2 sigma away from the mean is less than 5%.
This is the generally accepted threshold at which a scientist would become interested and start looking for a reason for the divergence, rather than just accepting it as part of the normal variation. The lower 2 sigma boundary for this data is 77.5%. Anything below that indicates that something may have changed in the real world.
The 2010 minimum was 77.2%, just outside 2 sigma and with a probability just below 5%. The 2011 minimum reached 73%, 5 sigmas below the mean and a probability well below 1%.
With each of 2009,2010,2011 and 2012 minima lower than its predecessor and the last two significantly outside the normal range ,it is hard to escape the conclusion that some real world change is affecting the behaviour of the ice sheet surface. Candidates, anyone?
I am intrigued to know what the Warmists thought would have happened to the Peterman glacier if it had not calved off. Would it have continued to grow forever?
Don’t leave out the thoroughly naive/incompetent/duplicitous journalists/editors doing their bit in the spread of disinformation.
Good job David and very enlightening.
I particularly appreciated the amount of work you put into the graphics. They really put the issue into much needed perspective.
P.S. I presume the acronym of your subtitle was an intentional pun : )
Alarmists Gone Wild…AGW…Anthropogenic Global Warming
I suspect that like the more famous Muir Glacier (Glacier Bay, Alaska), this glacier blossomed during the Little Ice Age and has been retreating since the warming commenced around 1850.
Interestingly enough, Indian legends and recent botanical/paleoclimate studies concur on the history of Glacier Bay. And the park rangers up there, some being Indians, have little belief in CAGW. Particularly since their ancestors experienced catastrophic natural cooling.
Thank you, I enjoyed reading your article. What causes this 150 year surface melt cycle?
“The GRACE measurements upon which the accelerating ice loss claims are based are heavily dependent on the Glacial Isostatic Adjustment (GIA). While not as large as Antarctica (where the GIA’s margin of error is nearly as large as the asserted ice loss), GIA variations can result in totally different ice loss values…”
This is very important information I was not aware of.
Can somebody explain in which way is it depending on it? Do I correctly understand that they assume Greenland and Antarctica are lifting up even with the whole ice on them?
So the ice lost measurement by GRACE are again dependent of a modelled quantity…
Speaking of this John Daly had an interesting posting about the whole sea level rise in 20th century:
http://www.john-daly.com/ges/msl-rept.htm
“The world’s public was given the clear impression that the claimed 18 cm sea level rise for the 20th century was an observed quantity. It is now clear that this is not the case. The 18 cm figure arrived at is the product of combining data from tide gauges with the output of the ICE-3G de-glaciation model.
The logical equation here is simple.
an observed quantity ± a modeled quantity = a modeled quantity
Thus, the claimed 18 cm sea level rise is a model construct, not an observed value at all.
Worse still, the model which has created it is primarily focused on the North Atlantic basin which shows relative sea level trends quite unlike those observed outside that region. Thus, global estimates cannot be inferred with any confidence from modeled trends which mainly affect only that basin.”
Somebody said it already…models all the way down..
Mr. Middleton, do you know on what dates your photos in figures 11 and 12 of the Jakobshavn Isbrae were taken? The calving fronts labelled reflect the minimum extent of the glacier at the warmest part of the thaw.
The position of the ice front in the photograph and the lack of snow suggest that the picture was taken considerably later in the season after the ice front had moved seaward once more, but before the first snowfall. That would explain why ice is visible downstream of the minimum extent fronts.
Lars P. says:
August 17, 2012 at 10:33 am
“The GRACE measurements upon which the accelerating ice loss claims are based are heavily dependent on the Glacial Isostatic Adjustment (GIA). While not as large as Antarctica (where the GIA’s margin of error is nearly as large as the asserted ice loss), GIA variations can result in totally different ice loss values…”
This is very important information I was not aware of.
Can somebody explain in which way is it depending on it? Do I correctly understand that they assume Greenland and Antarctica are lifting up even with the whole ice on them?
———————————————————————-
This paper discusses ground level measurements of the isostatic uplift or sinking of Greenland rocks, to give a more accurate GIA to complement the GRACE data.
http://adsabs.harvard.edu/full/2005GeoJI.163..865D
James says:
August 17, 2012 at 10:31 am
Thank you, I enjoyed reading your article. What causes this 150 year surface melt cycle?
There is no 150 year cycle, over the last 1,000 years there have been 4 such events (not including this year, three of them clustered about 1,000 years ago. The 150 year value is the average over the last 10,000 years with the peak occurring about 7,000 years ago, when the frequency was about 1 per 25 years. At that time July insolation was higher than now.
To simplify, the GRACE satellite keeps a running check on its position based on the GPS satellite network. This allows its orbit to be monitored to sufficient accuracy to detect changes due to mass concentrations like the Greenland ice sheet, effectively measuring the mass of the ice sheet.
Greenland floats on the Earth’s mantle like a boat in water. Like a boat, if weight is removed it floats higher. This is the GIA and happens if the ice mass decreases.
Since the effect of the ice sheet’s gravity on GRACE increase with mass and closeness to the satellite, ground based GPS measures of the uplift of the underlying rock are needed. This allows orbital changes due the mass of the ice to be distinguished from changes due to uplift, giving a more accurate measurement of ice mass and a better view of whether ice mass is changing with time.
I don’t know what this author is so excited about. I read several articles on this event. All of them plainly stated that melting of the entire surface has been unprecedented in the satellite era, but scientists are aware from other evidence that it has happened every 150 years or so historically, so on that scale, not particularly surprising.
The potion relating to calving seems to be making the unremarkable point that the is normal during periods of global warming, which he seems to concede is now happening.