By Dr. Nicola Scafetta
It is time to update my widget comparing the global surface temperature, HadCRUT3 (red and blue), the IPC 2007 projection (green) and my empirical model (black thick curve and cyan area) based on a set of detected natural harmonics (period of approximately: 9.1, 10-11, 20 and 60 years) which are based on astronomical cycles, plus a corrected anthropogenic warming projection of about 0.9 oC/century. The yellow curve represents the harmonic model alone without the corrected anthropogenic warming projection and represents an average lower limit.
The proposed astronomically-based empirical model represents an alternative methodology to reconstruct and forecast climate changes (on a global scale, at the moment) which is alternative to the analytical methodology implemented in the IPCC general circulation models. All IPCC models are proven in my paper to fail to reconstruct all decadal and multidecadal cycles observed in the temperature since 1850. See details in my publications below.

As the figure shows, the temperature for Jan/2012 was 0.218 oC, which is a cooling respect to the Dec/2011 temperature, and which is about 0.5 oC below the average IPCC projection value (the central thin curve in the middle of the green area). Note that this is a very significant discrepancy between the data and the IPCC projection.
On the contrary, the data continue to be in reasonable agreement with my empirical model, which I remind, is constructed as a full forecast since Jan/2000.
In fact the amplitudes and the phases of the four cycles are essentially determined on the basis of the data from 1850 to 2000, and the phases are found to be in agreement with appropriate astronomical orbital dates and cycles, while the corrected anthropogenic warming projection is estimated by comparing the harmonic model, the temperature data and the IPCC models during the period 1970-2000. The latter finding implies that the IPCC general circulation models have overestimated the anthropogenic warming component by about 2.6 time on average, within a range between 2 to 4. See original papers and the dedicated blog article for details: see below.
The widget also attracted some criticisms from some readers of WUWT’s blog and from skepticalscience
Anthony asked me to respond to the criticism, and I am happy to do so. I will respond five points.
- Criticism from Leif Svalgaard.
As many readers of this blog have noted, Leif Svalgaard continuously criticizes my research and studies. In his opinion nothing that I do is right or worth of consideration.
About my widget, Leif claimed many times that the data already clearly contradict my model: see here 1, 2, 3, etc.
In any case, as I have already responded many times, Leif’s criticism appears to be based on his confusing the time scales and the multiple patterns that the data show. The data show a decadal harmonic trending plus faster fluctuations due to ElNino/LaNina oscillations that have a time scale of a few years. The ENSO induced oscillations are quite large and evident in the data with periods of strong warming followed by periods of strong cooling. For example, in the above widget figure the January/2012 temperature is out of my cyan area. This does not mean, as Leif misinterprets, that my model has failed. In fact, such pattern is just due to the present La Nina cooling event. In a few months the temperature will warm again as the El Nino warming phase returns.
My model is not supposed to reconstruct such fast ENSO induced oscillations, but only the smooth decadal component reconstructed by a 4-year moving average as shown in my original paper figure: see here for the full reconstruction since 1850 where my models (blue and black lines) well reconstruct the 4-year smooth (grey line); the figure also clearly highlights the fast and large ENSO temperature oscillations (red) that my model is not supposed to reconstruct.
As the widget shows, my model predicts for the imminent future a slight warming trending from 2011 to 2016. This modulation is due to the 9.1 year (lunar/solar) and the 10-11 year (solar/planetary) cycles that just entered in their warming phase. This decadal pattern should be distinguished from the fast ENSO oscillations that are expected to produce fast periods of warming and fast period of cooling during these five years as it happened from 2000 to 2012. Thus, the fact that during LaNina cooling phase, as right now, the temperature may actually be cooling, does not constitute a “proof” that my model is “wrong” as Leif claimed.
Of course, in addition to twist numerous facts, Leif has also never acknowledged in his comments the huge discrepancy between the data and the IPCC projection which is evident in the widget. In my published paper [1], I did report in figure 6 the appropriate statistical test comparing my model and the IPCC projection against the temperature. The figure 6 is reported below

The figure reports a kind of chi-squared statistical test between the models and the 4-year smooth temperature component, as time progress. Values close to zero indicate that the model agrees very well with the temperature trending within their error range area; values above 1 indicate a statistically significant divergence from the temperature trending. It is evident from the figure above that my model (blue curve) agrees very well with the temperature 4-year smooth component, while the IPCC projection is always worst, and statistically diverges from the temperature since 2006.
I do not expect that Leif changes his behavior against me and my research any time soon. I just would like to advise the readers of this blog, in particular those with modest scientific knowledge, to take his unfair and unprofessional comments with the proper skepticism.
- Criticism about the baseline alignment between the data and the IPCC average projection model.
A reader dana1981 claimed that “I believe Scafetta’s plot is additionally flawed by using the incorrect baseline for HadCRUT3. The IPCC data uses a baseline of 1980-1999, so should HadCRUT.”
This reader also referred to a figure from skepticalscience, shown below for convenience,

that shows a slight lower baseline for the IPCC model projection relative to the temperature record, which give an impression of a better agreement between the data and the IPCC model.
The base line position is irrelevant because the IPCC models have projected a steady warming at a rate of 2.3 oC/century from 2000 to 2020, see IPCC figure SPM.5. See here with my lines and comments added

On the contrary, the temperature trending since 2000 has been almost steady as the figure in the widget clearly shows. Evidently, the changing of the baseline does not change the slope of the decadal trending! So, moving down the baseline of the IPCC projection for giving the illusion of a better agreement with the data is just an illusion trick.
In any case, the baseline used in my widget is the correct one, while the baseline used in the figure on skepticalscience is wrong. In fact, the IPCC models have been carefully calibrated to reconstruct the trending of the temperature from 1900 to 2000. Thus, the correct baseline to be used is the 1900-2000 baseline, that is what I used.
To help the readers of this blog to check the case by themselves, I sent Anthony the original HadCRUT3 data and the IPCC cmip3 multimodel mean reconstruction record from here . They are in the two files below:
itas_cmip3_ave_mean_sresa1b_0-360E_-90-90N_na-data
As everybody can calculate from the two data records that the 1900-2000 average of the temperature is -0.1402, while the 1900-2000 average of the IPCC model is -0.1341.
This means that to plot the two records on the common 1900-2000 baseline, there is the need to use the following command in gnuplot
plot “HadCRUT3-month-global.dat”, “itas_cmip3_ave_mean_sresa1b_0-360E_-90-90N_na.dat” using 1:($2 – 0.0061)
which in 1850-2040 produces the following graph

The period since 2000 is exactly what is depicted in my widget.
The figure above also highlights the strong divergences between the IPCC model and the temperature, which are explicitly studied in my papers proving that the IPCC model are not able to reconstruct any of the natural oscillations observed at multiple scales. For example, look at the 60-year cycle I extensively discuss in my papers: from 1910 to 1940 a strong warming trending is observed in the data, but the warming trending in the model is far lower; from 1940 to 1970 a cooling is observed in the data while the IPCC model still shows a warming; from 1970 to 2000, the two records present a similar trending (this period is the one originally used to calibrate the sensitivities of the models); the strong divergence observed in 1940-1970, repeats since 2000, with the IPCC model projecting a steady warming at 2.3 oC/century , while the temperature shows a steady harmonically modulated trending highlighted in my widget and reproduced in my model.
As explained in my paper the failure of the IPCC model to reconstruct the 60-year cycle has large consequences for properly interpreting the anthropogenic warming effect on climate. In fact, the IPCC models assume that the 1970-2000 warming is 100% produced by anthropogenic forcing (compare figures 9.5a and 9.5b in the IPCC report) while the 60-year natural cycle (plus the other cycles) contributed at least 2/3 of the 1970-2000 warming, as proven in my papers.
In conclusion, the baseline of my widget is the correct one (baseline 1900-2000). My critics at skepticalscience are simply trying to hide the failure of the IPCC models in reconstructing the 60-year temperature modulation by just plotting the IPCC average simulation just since 2000, and by lowering the baseline apparently to the period 1960-1990, which is not where it should be because the model is supposed to reconstruct the 1900-2000 period by assumption.
It is evident that by lowering the base line a larger divergence would be produced with the temperature data before 1960! So, skepticalscience employed a childish trick of pulling a too small coversheet from a too large bed. In any case, if we use the 1961-1990 baseline the original position of the IPCC model should be shifted down by 0.0282, which is just 0.0221 oC below the position depicted in the figure above, not a big deal.
In any case, the position of the baseline is not the point; the issue is the decadal trend. But my 1900-2000 baseline is in the optimal position.
- Criticism about the chosen low-high boundary levels of the IPCC average projection model (my width of the green area in the widget).
Another criticism, in particular by skepticalscience, regards the width of the boundary (green area in the widget) that I used, They have argued that
“Most readers would interpret the green area in Scafetta’s widget to be a region that the IPCC would confidently expect to contain observations, which isn’t really captured by a 1-sigma interval, which would only cover 68.2% of the data (assuming a Gaussian distribution). A 2-sigma envelope would cover about 95% of the observations, and if the observations lay outside that larger region it would be substantial cause for concern. Thus it would be a more appropriate choice for Scafetta’s green envelope.”
There are numerous problems with the above skepticalscience’s comment.
First, the width of my green area (which has a starting range of about +/- 0.1 oC in 2000) coincides exactly with what the IPCC has plotted in his figure figure SPM.5. Below I show a zoom of IPCC’s figure SPM.5

The two red lines added by me show the width at 2000 (black vertical line). The width between the two horizontal red lines in 2000 is about 0.2 oC as used in my green area plotted in the widget. The two other black lines enclosing the IPCC error area represent the green area enclosure reported in the widget. Thus, my green area accurately represents what the IPCC has depicted in its figure, as I explicitly state and show in my paper, by the way.
Second, skepticalscience claims that the correct comparison needed to use a 2-sigma envelope, and they added the following figure to support their case

The argument advanced by skepticalscience is that because the temperature data are within their 2-sigma IPCC model envelope, then the IPCC models are not disproved, as my widget would imply. Note that the green curve is not a faithful reconstruction of my model and it is too low: compare with my widget.
However, it is a trick to fool people with no statistical understanding to claim that by associating a huge error range to a model, the model is validated.
By the way, contrary to the claim of sckepticalscience, in statistics it is 1-sigma envelope width that is used; not 2-sigma or 3-sigma. Moreover, the good model is the one with the smallest error, not the one with the largest error.
In fact, as proven in my paper, my proposed harmonic model has a statistical accuracy of +/- 0.05 oC within which it well reconstructs the decadal and multidecadal modulation of the temperature: see here.
On the contrary, if we use the figure by skepticalscience depicted above we have in 2000 a 1-sigma error of +/- 0.15 oC and a 2-sigma error of +/- 0.30 oC. These robust and fat error envelope widths are between 3 and 6 times larger than what my harmonic model has. Thus, it is evident from the skepticalscience claims themselves that my model is far more accurate than what the IPCC models can guarantee.
Moreover, the claim of skepticalscience that we need to use a 2-sigma error envelope indirectly also proves that the IPCC models cannot be validated according the scientific method and, therefore, do not belong to the realm of science. In fact, to be validated a modeling strategy needs to guarantee a sufficient small error to be capable to test whether the model is able to identify and reconstruct the visible patterns in the data. These patterns are given by the detected decadal and multi-decadal cycles, which have amplitude below +/- 0.15 oC: see here. Thus, the amplitude of the detected cycles is well below the skepticalscience 2-sigma envelope amplitude of +/- 0.30 oC, (they would even be below the skepticalscience 1-sigma envelope amplitude of +/- 0.15 oC).
As I have also extensively proven in my paper, the envelope of the IPCC model is far larger than the amplitude of the temperature patterns that the models are supposed to reconstruct. Thus, those models cannot be properly validated and are useless for making any useful decadal and multidecadal forecast/projection for practical society purpose because their associated error is far too large by admission of skepticalscience itself.
Unless the IPCC models can guarantee a precision of at least +/- 0.05 oC and reconstruct the decadal patterns, as my model does, they cannot compete with it and are useless, all of them.
- Criticism about the upcoming HadCRUT4 record.
Skepticalscience has also claimed that
“Third, Scafetta has used HadCRUT3 data, which has a known cool bias and which will shortly be replaced by HadCRUT4.”
HadCRUT4 record is not available yet. We will see what happens when it will be available. From the figures reported here it does not appear that it will change drastically the issue: the difference with HadCRUT3 since 2000 appears to be just 0.02 oC.
In any case for an optimal matching the amplitudes of the harmonics of my model may need to be slightly recalibrated, but HadCRUT4 already shows a clearer cooling from 1940 to 1970 that further supports the 60-year natural cycle of my model and further contradicts the IPCC models. See also my paper with Mazzarella where the HadSST3 record is already studied.
- Criticism about the secular trending.
It has been argued that the important issue is the upward trending that would confirm the IPCC models and their anthropogenic warming theory.
However, as explained in my paper, once that 2/3 of the warming between 1970 and 2000 is associated to a natural cycle with solar/astronomical origin (or even to an internal ocean cycle alone) the anthropogenic warming trending reproduced by the models is found to be spurious and strongly overestimated. This leaves most of the secular warming tending from 1850 to 2012 as due to secular and millennial natural cycles, which are also well known in the literature.
In my published papers, as clearly stated there, the secular and millennial cycles are not formally included in the harmonic model for the simple reason that they need to be accurately identified: they cannot be put everywhere and the global surface temperature is available only since 1850, which is a too short period for accurately locate and identify these longer cycles.
In particular, skepticalscience has argued that the proposed model (by Loehle and Scafetta) based only on the 60-year and 20-year cycles plus a linear trending from 1850 to 1950 and extrapolated up to 2100 at most, must be wrong because when the same model is extrapolated for 2000 years it clearly diverges from reasonable patterns deduced from temperature proxy reconstructions. Their figure is here and reproduced below

Every smart person would understand that this is another skepticalscience’s trick to fool the ignorant.
It is evident that if, as we have clearly stated in our paper, we are ignoring the secular and millennial cycles and we just approximate the natural millennial harmonic trending with a first order linear approximation that we assume can be reasonable extended up to 100 years and no more, it is evident that it is stupid, before than being dishonest, to extrapolate it for 2000 years and claim that our result is contradicted by the data. See here for extended comment by Loehle and Scafetta.
As said above in those models the secular and millennial cycles were excluded for purpose. However, I already published in 2010 a preliminary reconstruction with those longer cycles included here (sorry in Italian), see figure 6 reported below

However, in the above model the cycles are not optimized, which will be done in the future. But this is sufficient to show how ideologically naïve (and false) is the claim from skepticalscience.
In any case, the secular trending and its association to solar modulation is extensively addressed in my previous papers since 2005. The last published paper focusing on this topic is discussed here and more extensively here where the relevant figure is below

The black curves represent empirical reconstruction of the solar signature secular trending since 1600. The curve with the upward trending since 1970 is made using the ACRIM TSI composite (which would be compatible with the 60-year cycle) and the other signature uses the PMOD TSI composite which is made by manipulating some of the satellite records with the excuse that they are wrong.
Thus, until the secular and millennial cycles are accurately identified and properly included in the harmonic models, it is the studies that use the TSI secular proxy reconstructions that need to be used for comparison to understand the secular trending, like my other publications from 2005 to 2010. Their results are in perfect agreement with what can be deduced from the most recent papers focusing on the astronomical harmonics, and would imply that no more that 0.2-0.3 oC of the observed 0.8 oC warming since 1850 can be associated to anthropogenic activity. (Do not let you to be fooled by Benestad and Schmidt 2009 criticism that is filled with embarrassing mathematical errors and whose GISS modelE performance is strongly questioned in my recent papers, together with those of the other IPCC models) .
I thank Anthony for the invitation and I apologize for my English errors, which my above article surely contains.
Relevant references:
[1] Nicola Scafetta, “Testing an astronomically based decadal-scale empirical harmonic climate model versus the IPCC (2007) general circulation climate models.” Journal of Atmospheric and Solar-Terrestrial Physics, (2012). DOI: 10.1016/j.jastp.2011.12.005
[2] Adriano Mazzarella and Nicola Scafetta, “Evidences for a quasi 60-year North Atlantic Oscillation since 1700 and its meaning for global climate change.” Theor. Appl. Climatol. (2011). DOI: 10.1007/s00704-011-0499-4
[3] Craig Loehle and Nicola Scafetta, “Climate Change Attribution Using Empirical Decomposition of Climatic Data.” The Open Atmospheric Science Journal 5, 74-86 (2011). DOI: 10.2174/1874282301105010074
[4] Nicola Scafetta, “A shared frequency set between the historical mid-latitude aurora records and the global surface temperature.” Journal of Atmospheric and Solar-Terrestrial Physics 74, 145-163 (2012). DOI: 10.1016/j.jastp.2011.10.013
[5] Nicola Scafetta, “Empirical evidence for a celestial origin of the climate oscillations and its implications.” Journal of Atmospheric and Solar-Terrestrial Physics 72, 951–970 (2010). DOI: 10.1016/j.jastp.2010.04.015
Additional News and Links of Interest:
Global Warming? No, Natural, Predictable Climate Change, Larry Bell
http://scienceandpublicpolicy.org/images/stories/papers/reprint/astronomical_harmonics.pd
Willis Eschenbach says: March 13, 2012 at 5:32 pm
“Where is the phase, amplitude, and frequency of the underlying cycles he is using coming from?”
read my papers.
Bart says:
March 13, 2012 at 4:52 pm
In other words, you still won’t point out a single thing wrong with what I did. OK, I’ll take another tack. I pointed to the data, unlike Scafetta I cite my work. So go get it and come back and post a proper Fourier analysis. I may be totally wrong as you say, Bart. I’ve been wrong before, I don’t like it when it happens, but that’s one way I learn. But claiming I’m wrong without explaining where and why I’m wrong? Sorry, that won’t fly.
Regarding resonances, certainly, they exist lots of places. The difficulty is that in the barycentric data, the big cycle is the twenty year cycle. It’s about ten times the size of the 60 year cycle.
In the Scafetta model, that’s reversed. The sixty year cycle is ten times the size of the twenty year cycle.
Your response to this is “resonance”. But what is resonating where? Without something behind it, it’s just a magical word, “resonance”, that names but does not explain.
All the best,
w.
Interesting that most of the protractors are not understanding the two cycles separately that control solar output and climate.
1. There is a clear 60 year cycle in the temperature and auroral records that is basically the PDO. This cycle correlates with the Jupiter/Saturn synodic cycle.
2. There is a clear 172 (approx) cycle solar grand minima that is controlled by the extra angular momentum from Neptune and Uranus that works separately from the ocean cycle. One cycle controls the Sun, the other the oceans. The N/U cycle also influences overall solar modulation outside of grand minima. This powerwave is often described as the Gleisberg cycle.
Both cycles have predictive power which are right on track at present. Hindcasting has also been shown to be just as accurate.
Willis Eschenbach says: March 13, 2012 at 5:47 pm
read my papers.
I am not using just the the barycentric data, where the big cycle is the twenty year cycle. It’s about ten times the size of the 60 year cycle.
There are astronomical records where the 60-year cycle is big and the 20 is small.
In any case, that is irrelevant, because you are not undestanding that the issue is also how the climate respond to the cycles as Bard says, and usually the thermal inertia smooth out the faster cycles relative to the slow ones.
try this one, for example
Nicola Scafetta, “A shared frequency set between the historical mid-latitude aurora records and the global surface temperature.” Journal of Atmospheric and Solar-Terrestrial Physics 74, 145-163 (2012). DOI: 10.1016/j.jastp.2011.10.013
Willis, Dr. Scaffeta has an established history of behavior one does not normally tolerate in adult discussion.
See his comments here at CA.
jeez says: March 13, 2012 at 6:06 pm
exactly Jeez. You are fully right.
In adult discussion, one does not tollerate when people think that it is ok to criticize somebody without even spending any time reading what somebody has written hundred times and clearly written in his papers everywhere since in the abstracts of its papers.
For example, Willis is continuously asking
“Where is the phase, amplitude, and frequency of the underlying cycles he is using coming from?”
Geoff above responded
“There is a clear 60 year cycle in the temperature and auroral records that is basically the PDO. This cycle correlates with the Jupiter/Saturn synodic cycle.”
How could Geoff know it? I never told him anything nor he never asked!
Let me guess, Geoff read my papers, Willis did not but he criticizes, criticizes, criticizes…..
And never reads my papers where the answer is evident at the first sight.
Bart is right when he said: “I am trying to be helpful and constructive to Nicola. You are trying to plug your ears and go “Nah, Nah, Nah”.
From:
http://www.john-daly.com/sun-enso/sun-enso.htm
“The four giant planets, which regulate the sun’s motion, carry more than 99 percent of the angular momentum in the solar system, while the sun is confined to less than 1 percent. So there is enough angular momentum that can be transferred from the outer planets to the revolving sun and eventually to the spinning sun.
I have shown that cycles derived from the sun’s motion about the center of mass make it possible to predict different facets of solar activity, including solar eruptions, and climate phenomena like temperature anomalies, droughts, and El Niños.”
Nicola Scafetta says:
March 13, 2012 at 5:39 pm
Dear Dr. Scafetta:
I must say, I do love a scientist, complete with PhD, who is unwilling to cite chapter and verse of his own work in order to prove me wrong. It warms my heart to see a man unwilling to blow his own horn, unwilling to pull out his big guns and blast me to smithereens.
I mean, just about every single scientist I know is more than happy to promote their own prior art in that manner. Me, I’m always happy to be able to say something on the order of “see Figure 2 on page 4 of my peer-reviewed paper called “Why I’m Right”, read’em and weep, sucka”, except of course in more polite terms. Well, usually more polite terms. And most scientists are quite glad to do that. Citing their scientific opponent’s work might be hard for some, but most scientists are overjoyed to cite the exact page and paragraph of their deathless prose that will blow my skinny ass out of the water and end my nagging repetition of the same question once and for all.
So when someone like you refuses to do that, I gotta stand in awe at the sense of humanity and humility that prevents you from pointing out where you are getting your cycles. I gotta figure you’re doing it as a gesture of friendship, to spare me the embarrassment of being wrong in public or something.
I mean, it simply reaffirms my belief in the scientific method. It’s a funny method because it’s a public method. Someone makes a scientific claim, and backs it up with whatever they have in the way of logic and data and observations and computer code and the like.
Then everyone tries to falsify the scientific claim, by investigating the ideas, and asking the originator of the claim questions about the results and the logic and the data and such.
Of course, this all depends on and is a slave to transparency. When someone has a question about the data, they need to be able to access the data to understand what the originator is talking about. When someone needs to understand the inner workings of what was done on the computer, they need the code. If someone has a question about the logic, they need to be able to have the originator explain what might not be as clearly expressed as the originator thought when it was written. In short, the originator of the scientific claim needs to facilitate the investigation of the idea.
Sometimes, as with you, Dr. S, the excuse is made that the questioning or the questioner is hostile. But the best thing to do with your brilliant new scientific idea is to give it to your worst enemy. If that joker can’t find fault with it, that’s the best news possible.
One of the beauties of the web is that this process can be made much faster and more public. I’ve been doing a scientific analysis and investigation of the Argo ocean temperature dataset. My work has been greatly aided and influenced by the comments I’ve received. And yes, in the past (and likely in the future) some of my brilliant ideas get totally blown out of the water … just think of how much time that has saved me from going down a wrong path, perhaps for years.
Sadly, Dr. S., I see that you are no fan of the scientific method. Which is ok, but precludes me from playing your game. Real scientists ask the tough questions, and real scientists answer those tough questions. Your refusal to answer them speaks volumes.
So I’m not going to ask any more, doc, where you got your frequencies and amplitudes and phases. As far as I’m concerned, your refusal to cite chapter and verse of your own work reveals that what you have done is nothing more than trivial curve fitting. I’m just going to put you in the category of “scientists” who say things like “Why should I give you the data when you’ll just try to find fault with it”, and leave you alone to talk to the folks who ask easy questions.
It’s sad for me, because as I said, I think that the barycentric motion of the sun could well have an effect on the climate. And it’s sad because I hate to see your kind of unscientific attitude here on WUWT.
But my best to you anyhow, I do wish you well,
w.
Willis Eschenbach says: March 13, 2012 at 6:48 pm
“Real scientists ask the tough questions, and real scientists answer those tough questions. ”
You are not asking tough questions. You are being lazy in educating yourself before asking questions. And thinking that you can criticize a work without reading it.
You are behaving like those students that go to a professor “pretending” a help for the homework without coming to the lesson and without even having tried to studying the topic first at home, and looking just that the professor solves the exercise for them.
And the professor gets irritated when he immediately realizes that the student not only never opened the book before coming at the office, but he behaves also arrogantly and pretends direct answers to solve his homework and nothing else: of the type: “Professor, this problem asks we to calculate the kinetic energy of a moving particle, tell me the page and the equation number that I need to use and where should I put the numbers”!
When I said that you need to read my paper first, it is because I realized that it was not possible to answer your questions in a way that you could have properly understood it because you did not appear to have the philosophical background approach right, which needs the harder work to read my papers first.
You need first to understand the philosophy of my work. That cannot be done by simply pointing you a line number and a page number. You need to start reading the papers from the beginning, that is, the Introduction of the paper. Then you need to become familiar with the data and the equations that I use and why I am using them. And go on. The philosophy comes first, the data and the analysis comes later.
And you need to understand better how to interpret geophysical signals where, for example, a detected cycle of 60 years is not truly different from a cycle of 61 year, because the data contain a lot of errors and biases and other limitations. And this in particular true when I continuously refer to a “quasi-60 year cycle”, and not to a “rigorous 60-year cycle”.
Every geophysicist would laugh at you if you claim that their work is wrong just because there exists a fundamental difference between 60 and 61 year cycles. You are reasoning from a purely and naively mathematical point of view without understanding the limitations implicit in both the data and the technique of analysis, which are also discussed in the papers.
I gave you a list of papers, you may start with this one and go on
Nicola Scafetta, “Empirical evidence for a celestial origin of the climate oscillations and its implications.” Journal of Atmospheric and Solar-Terrestrial Physics 72, 951–970 (2010). DOI: 10.1016/j.jastp.2010.04.015
good reading.
Agnostic says: (March 13, 2012 at 3:02 pm) “@Willis, I think what you are running into here is something of a culture clash.”
Very perceptive and worthy of contemplation by all concerned.
Well said (fellow) Aussie.
Geoff Sharp says:
March 13, 2012 at 5:59 pm
Umm … the “synodic cycle”, as far as I know, is calculated as abs((per1*per2)/(per1-per2)) where per1 and per2 are the orbital periods of the two planets. For Jupiter (11.86 years) and Saturn (29.42 years), this works out to 19.87 years. Here’s the calculation:
abs((11.86y) * (29.42y)) / ((11.86y) – (29.42y)) = 19.87 …
Ooops.
Then Dr. Scafetta picks up the wrong end of the stick …
Double oops. Maybe both of you should have asked.
Since both of you are wrong about the length of the Jupiter/Saturn synodic cycle, you might want to wait until dawn before you start crowing about “how could Geoff know it” …
w.
PS—Geoff, you say:
Cite?
Nicola
There will be no underlying anthropogenic effect at all for the reasons explained in my new paper Radiated Energy and the Second Law of Thermodynamics.
I accept that, technically, “points” are dimensionless and I used the term colloquially in the Abstract for the paper, but I would also say that what I am talking about can be physically a very small volume of matter. I suggest, some such volume with only perhaps a million molecules would be quite sufficient for the Second Law of Thermodynamics to be applicable.
Wikipedia puts it this way: In classical thermodynamics, the second law is a basic postulate applicable to any system involving measurable heat transfer …
It is all based on probabilities, of course, but we just need radiation with the full range of frequencies indicated by the Planck curve in order for temperature information to be conveyed. In reality, molecules react to frequencies and it is all to do with frequency distributions, not any characteristic of an individual photon or molecule.
At the outset, let me be honest and say that I too do not necessarily agree with everything that every author in Slaying the Sky Dragon has written. There are some subtle contradictions in fact between authors. I do however, agree with Prof Claes Johnson’s general concept that radiation from a cooler blackbody merely resonates with molecules in a warmer blackbody, without any of its energy being converted to thermal energy. And Claes also read my paper prior to publication and commented that I was one of only a few who understood his Computational Blackbody Radiation and that he fully endorsed my paper. (I understand that Claes is not a member of the Slayers.) But I chose Principia Scientific International because they have a growing number of scientists joining their ranks who participate in “open review” of the papers they publish on their site – six in total now. PSI comprises many more scientists than the few authors of the book.
May I ask that people do in fact read the paper before commenting. You will find, for example, that I explain why lasers, microwave ovens and microbolometers do not disprove the hypothesis. Whilst I don’t mention it, I anticipate that there will be experiments published later this year using spectrometers to demonstrate that warm gases do not absorb emission from cooler sources.
It is not appropriate to assume, for example, that I am discussing thermal energy accumulating in the atmosphere somehow warming the whole Earth system. That concept, I understand, has been dismissed by the IPCC who now argue that it is all about “backradiation” slowing the rate of cooling of the surface. Thermal energy is not transferred from a cold atmosphere to a warmer surface (nor to warmer layers of the lower atmosphere where we live) by any physical process. Thus the slowing of the cooling process is not due to the addition of thermal energy to the surface. Rather, it is due to resonance of the radiation itself, which does not involve absorption in the usual sense involving conversion of radiated energy to thermal energy.
Radiation from a cooler source merely undergoes what I call “resonant scattering” when it strikes a warmer target. As I have said, there is no conversion of its radiated energy into thermal energy, which is quite a different thing. If the radiation from the cooler (macro) source is (close to) that of a blackbody it will have frequencies across the appropriate Planck curve. Most radiation from the atmosphere will not have all these frequencies, but it will (to some extent) oppose equivalent radiation from the warmer surface while it experiences resonant scattering by the surface.
When it is scattered by the surface, it becomes a part of the emission of the surface, but, because it already has its own energy, it does not need energy from the surface itself. Thus it slows the rate of cooling of the surface because it “uses up” some of the potential radiation frequencies which the surface would otherwise have used to dispose of its own energy.
However, carbon dioxide does not radiate like a blackbody, so its few spectral lines are relatively ineffective compared with even water vapour radiation, let alone a blackbody.
So water vapour is the major contributor, having probably at least 100 times the effect of carbon dioxide when you take into account its greater presence and greater effectiveness per molecule.
Even so, only the radiative cooling process is affected by radiation from the atmosphere, not all of which is actually “backradiation” as such, because it may have originated from energy carried up by convection.
Now, there are other processes, mostly evaporative cooling and diffusion (sometimes called conduction) which involves molecular collision between surface and atmospheric molecules.
These other processes are not affected by radiation from the atmosphere. Yet they probably account for more than half the thermal energy transfer between surface and atmosphere, and they will tend to compensate by increasing their rate if the radiation rate decreases.
There are reasons for this explained in the Appendix.
Now, some don’t realise just how much of the incident solar radiation is actually in the near infra-red. Some of this is absorbed by water vapour and, to a small extent, also by carbon dioxide. This SW-IR radiation has much more energy per photon than does the LW-IR radiation from the surface. Some will be absorbed and this helps explain why the thermosphere gets very hot, often well above 400 degrees K in fact. By sending backradiation to space a cooling effect results, which is almost certainly greater than any warming effect due to carbon dioxide.
Temperatures on the Moon (without an atmosphere) vary from about -153°C at night to +107°C during the lunar day. Over 40% of solar insolation is either reflected or absorbed by the Earth’s atmosphere, so our atmosphere keeps the surface cooler than the Moon’s in daylight hours, by reducing incident solar radiation. Then, both day and night, the atmosphere slows the rate at which solar radiation (which was absorbed by the surface) then exits back to into the atmosphere and to space.
What does not happen is any transfer of thermal energy from cooler regions of the atmosphere to warmer regions on the surface, for any such heat transfer would violate the Second Law of Thermodynamics. For example, radiation from the atmosphere does not penetrate even 1cm below the surface of warmer water and add thermal energy to that sub-surface water. If it did, such warmer water could then rise to the surface by convection and its thermal energy could then get back into the atmosphere by evaporative cooling. Hence we would have had a stand-alone process transferring thermal energy from a cooler atmosphere to a warmer sub-surface layer of the water and warming it even more. Such a process would violate the Second Law.
Over the course of 4 billion years an approximate equilibrium point has been reached at any particular location on the Earth’s surface. Even though the atmosphere is roughly similar at the South Pole, the equilibrium temperature is very different from that at the Equator, due to different mean solar radiative flux over the course of each year. This clearly indicates that the temperature is mostly determined by the Sun’s radiation, not so much the properties of the atmosphere.
In regard to experiments, some are being arranged. My own “backyard” experiments with sand and soil in wide necked vacuum flasks indicated no difference in cooling rates between the contents of the flask which was shielded from backradiation at night, and that which was not. Try it yourself using a digital meat thermometer and a sheet of plate glass with an additional shield on top of it, all about 20cm above one flask and at a 10 degree angle to the horizontal to allow convection.
I suggest the onus should have been upon the IPCC to produce evidence to the contrary with a similar obvious experiment. I suspect it has been tried and failed, thus never being published. Correct me if I’m wrong anyone, and link me to any experiment showing backradiation warms anything.
I am the first to agree that it can slow that component of the surface cooling which is by radiation. However, in the context of anthropogenic effects, the role of carbon dioxide is minuscule because of its limited radiation frequencies and the fact that it is only one molecule in over 2,500 other molecules. Because it also has a cooling effect radiating energy to space, it is highly improbable that it causes any net warming at all.
It would be appreciated if people would actually read the paper and this comment in full.
Even though many clearly believe what has been the “usual” explanation involving heat transfer in both directions, it should be apparent that Prof Claes Johnson and myself disagree with this and are putting forward a hypothesis that there is another mechanism that explains what actually happens and yet still gives the same quantitative result as does application of SBL.
I really do not need to hear again the “standard” explanation of photons supposedly transferring thermal energy to everything they collide with – and “not knowing” the temperature of the source. You will find all these matters are addressed in the paper.
But, as I politely asked above, either please read the paper and all of this comment before commenting, or otherwise consider refraining from joining the discussion herein. I believe the paper itself, (perhaps with the additional explanation in this comment which may help some to understand) covers all the objections anyone has thus far raised, both here and on other forums as well.
My paper will now be subjected to “open peer review” by dozens of members of Principia Scientific International (PSI) who will shortly receive an email from the organisation.
http://principia-scientific.org/publications/psi_radiated_energy.pdf
@ur momisugly Doug Cotton:
Your points signify that Scafettas blue area forecast of some cut-in half
AGW is NOT what we can expect in the future……too high,much too high…
Only the yellow line is what counts……and I even think, this line is ABOVE
the real future values, because temps will lose 0.1’C GMT per decade, as my
now actualized calculations demonstrate…..
JS
Willis Eschenbach says:
March 13, 2012 at 8:50 pm
You really are out of your field here Willis and perhaps you are making a fool of yourself. You obviously have not read Dr. Scafetta’s or my paper judging by the incorrect assumptions you are making. You did this last time and wasted much time and effort.
Anyone in the astronomical world would recognize the 60 year Jupiter/Saturn period which is clearly laid out in Nicola’s papers. There is also a 60 year period in the Jupiter/Sun distance which is a product of the same cycle. There is no question of this being incorrect.
The 172 year cycle (approx) not the 142 year as you stated has been shown to you before. I suggest you spend a few days on my website and bring yourself up to speed. Once you have read all the relevant data I will be happy to answer any questions, but not before.
Doctor Scafetta, thank you for the citation to your paper. It is indeed the one of your papers that answers my questions. This way, we can start from the start without me having to read everything you’ve ever written. Much appreciated.
On a quick read, i have two issues.
First, I am confused by your Fig. 5(b). The text says:
The synodic period of Saturn/Jupiter is 19.87 years … but what explains the 60 year cycle?
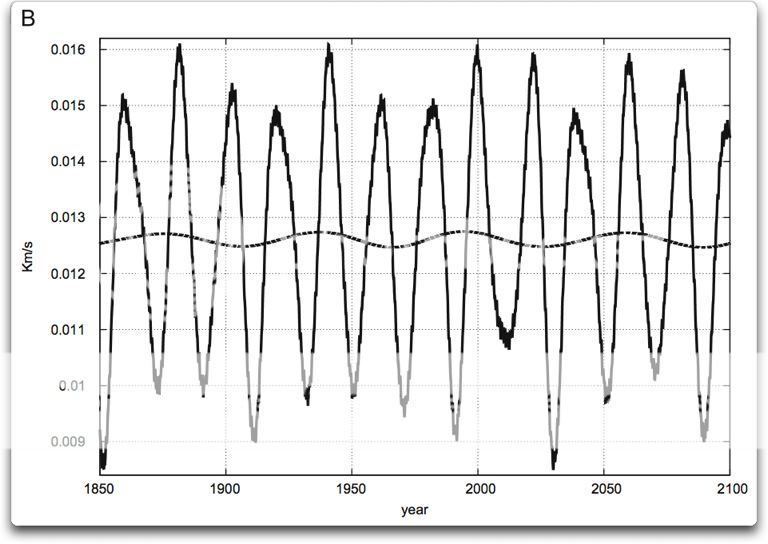
Here’s the figure:
ORIGINAL CAPTION: Fig. 5. (A) Distance and (B) speed of the Sun relative to the CMSS. Note the 20 and 60 year oscillations (smooth dash curves), which are due to the orbits of Jupiter and Saturn.
Here’s the part I don’t understand. The velocity of the sun around the center of mass of the solar system (CMSS) is shown by the large curve with the frequency that varies between about 15 and 20 years. As you’d expect (or at least as I’d expect) my own barycentric spreadsheet shows exactly the same curve with the same amplitude and phase, identical.
But what my spreadsheet doesn’t show is the 60 year oscillations. The big curve, with what you call the “20 year oscillations”, is indeed the velocity of the sun around the CMSS … but what is the “60 year oscillations” curve.
So that’s the first question. Where did you gat the “60 year oscillations”? I can’t find any information other than what I quoted above. It’s not a 60 year average, I tried that. What am I missing?
My second issue is the claim that the 9.1 year cycle is lunar in nature. You say:
When I ran a shipyard in the Solomon Islands, I needed tide tables. But there were none, so I had to make my own. It’s a strange location, with one tide per day for part of the year, and two tides per day for the other part of the year. So I learned a bit about the tides in the process. One of the things I learned is that there are really a lot of moon/sun/earth periods with a variety of cycle lengths. These are called “tidal constituents”. In no particular order these include:
M2 – Principal lunar semidiurnal
S2 – Principal solar semidiurnal
N2 – Larger lunar elliptic semidiurnal
K1 – Lunar diurnal
M4 – Shallow water overtides of principal lunar
O1 – Lunar diurnal
M6 – Shallow water overtides of principal lunar
MK3 – Shallow water terdiurnal
S4 – Shallow water overtides of principal solar
MN4 – Shallow water quarter diurnal
NU2 – Larger lunar evectional
S6 – Shallow water overtides of principal solar
MU2 – Variational
2N2 – Lunar elliptical semidiurnal second-order
OO1 – Lunar diurnal
LAM2 – Smaller lunar evectional
S1 – Solar diurnal
M1 – Smaller lunar elliptic diurnal
J1 – Smaller lunar elliptic diurnal
MM – Lunar monthly
SSA – Solar semiannual
SA – Solar annual
MSF – Lunisolar synodic fortnightly
MF – Lunisolar fortnightly
RHO – Larger lunar evectional diurnal
Q1 – Larger lunar elliptic diurnal
T2 – Larger solar elliptic
R2 – Smaller solar elliptic
2Q1 – Larger elliptic diurnal
P1 – Solar diurnal
2SM2 – Shallow water semidiurnal
M3 – Lunar terdiurnal
L2 – Smaller lunar elliptic semidiurnal
2MK3 – Shallow water terdiurnal
K2 – Lunisolar semidiurnal
M8 – Shallow water eighth diurnal
MS4 – Shallow water quarter diurnal
So I fear that I don’t find your argument at all compelling, that the 9.1 year cycle is the result of the equation
9.1 ≈ (2X + Y) / 4
where X is one lunar constituent, and Y is another lunar constituent. That seems like a very curious claim. I’m not saying that somewhere in the earth-moon-sun-planets sytem there isn’t a 9.1 year cycle. I’m saying that your explanation, that it is (2X + Y) / 4, seems very unlikely.
This is a recurring problem. There some 37 cycles above that are tidal constituents, most of which involve some combination of the earth/moon/sun. In addition you have the synodic combinations of those constituents. So when you begin without clear ex-ante criteria for what constitutes a valid cycle, you essentially have unlimited choice of cycles with which to simulate a very short (N = 160 years) temperature dataset.
In any case, that’s what I see on a quick look.
1. I don’t understand where you got the 60 year cycle. Everything else on that chart is the barycentric distance or the barycentric speed … but what is the 60 year data?
2. The justification for the 9.1 years seems labored. Given the choices for cycles, fitting the temperature seems like a trivial task.
Finally, I didn’t find the explanation of the “10-11 year cycle” in the paper either. Since the average sunspot cycle is ~ 11.5 years, it doesn’t seem to be that. Is it explained in the paper?
Again, don’t get me wrong. I’d love for this all to be true, I’m not disagreeing on political grounds. It’s just that with literally hundreds of cycles, stitching a chosen few together to simulate the temperature is a trivial task which doesn’t prove or even support anything.
All the best, thank you for finally specifying the paper that contained the answers to the questions I asked.
w.
One other issue, Dr. Scafetta. I am totally unable to replicate your Figure 10b. This is the detrended HadCRUT3 data lagged by 61.5 years. Here is your Figure 10b and my attempt to replicate it.
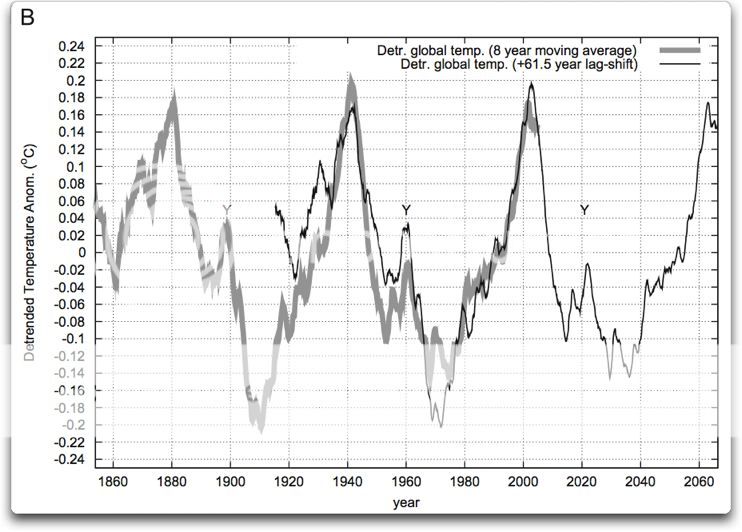
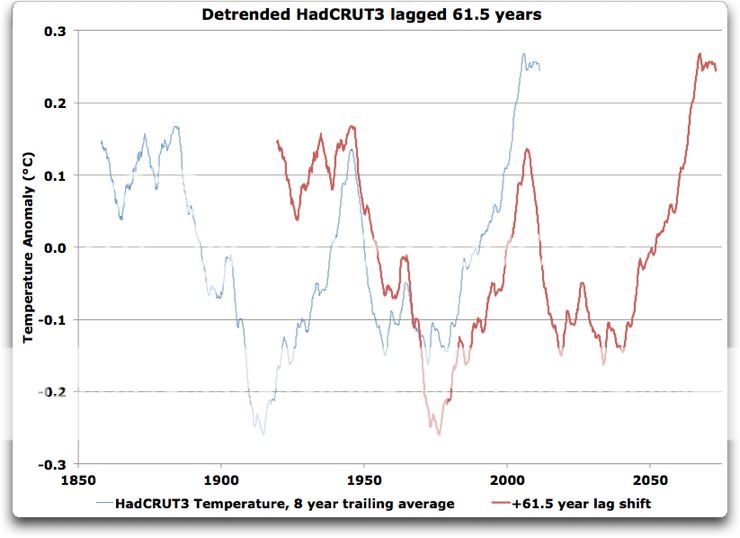
Not sure where the problem is. I’ve double-checked my figures, and that’s what I get. In all cases I was using an 8-year trailing average of the actual data.
Despite appearances, the r^2 during the overlap is bad, very bad. This is why we have mathematical tests, because data can look related but not be related. For the raw data (monthly) the r^2 is only 0.02, and the p-value is 0.22. After doing the 8-year trailing average, the r^2 goes up a bit to 0.17, but the p-value is still 0.13. In other words, the relationship between detrended HadCRUT3 and the same data lagged 61.5 years is not statistically significant.
Part of the problem is the smoothing by the 8-year average. Because it greatly increases the autocorrelation, although the r^2 has gone up, there is still no statistically significant relationship.
w.
[UPDATE: Ahhh, I see what you have done. My bad. I noticed it on my first read, but I couldn’t believe it. You have not “detrended” the data in the normal sense of the word. You have fit a quadratic model with
That has no less than four free parameters in it (2.8e-5, 1850, 2, and 0.41) … so of course you can make it all fit. We’re back to trivial curve fitting again.]
Dr. Scafetta
Willis Eschenbach has a point: But if you claim it has an astronomical cause, you have to show your figures regarding the phase, frequency, and amplitude of the cycles.
Event that is controlled (modulated, synchronised or both) by planetary cycles has to be repeatable and calculable as is the case with tides. Astronomy deals with precise numbers: 62 will not do for a 60 year cycle. Here is another example where numbers with 3 decimal points are required :
http://www.vukcevic.talktalk.net/LFC2.htm
12 will not do instead of 11.862 ! For time being, considering the sun is a ‘messy place’(L.S. quote) is holding the line, but time will tell if it is just a coincidence. No mechanism available (I suspect is electro-magnetic with possibly a bit of gravitation thrown in) but if correlation is good then….. may be.
Do I fervently believe that I am correct?
No. In practical and applied science one has to question if the laws of physics are understood and importantly applied correctly in any particular case you may be dealing with.
I think you could personally benefit if you occasionally consider that you may be wrong, or to put it bluntly, ask yourself is this a case of ‘flogging a dead horse’.
@Willis
started off polite as could be. It was only when he blew me off with his handwaving “read my papers”, and then started saying things like
You were relatively polite, but he was in a defensive mindset from his exchange between some of the resident clowns. It’s nothing to do with what I think you should or shouldn’t do – IMO your tone was perfectly acceptable, but having had experience with Europeans from a perspective such as yours I have learnt that their expectations of politeness are far far higher in general discourse. Speaking in European languages is akin to using Shakespeare like formalism.
@Dale Rainwater Scafetta:
It seems Willis has modified his tone for you and I think questions are interesting and valid. I am very very interested to hear what you have to say about them. I do appreciate to understand where you are coming from you need to read your papers and understand them, but for the purposes of a science blog, it is usually sufficient to give a bottom line answer and refer the questioner to a specific place in a paper for a detailed explanation. What happens is some people will do that, gain some of your insights and respond with their own thoughts with no more time wasted by you.
I genuinely believe Willis was asking his questions in good faith, he was not attacking your work in the manner some of the other commentators were. An exchange with Willis on this is just what is needed at this point. I am very interested in what you have to say.
Nicola Scafetta says:
March 13, 2012 at 5:35 pm
“Resonances phenomena are driven by collective synchronization, in my opinion.”
Nicola – resonance phenomena are manifestations of energy storage. When energy accumulates and alternates between kinetic and potential forms with a low rate of dissipation, that is what creates a resonance. This way, a small input can excite a large output, because the energy keeps on accumulating until the rate at which it is dissipated equilibrates with the rate at which it is input.
There are many energy storage mechanisms in the Earth climate system, particularly in oceanic and atmospheric waves and currents. With ready mechanisms for alternating between potential and kinetic forms, there are myriad resonant modes available. Each resonant mode has an associated natural frequency at which it will tend to store sympathetically alternating input energy. And, it will tend not to accept and store energy input at any other frequency.
Consider a swing set. A child makes the swing go by alternatingly extending his legs at the downswing, and curling them back at the upswing. If he extends or curls his legs at other times, the swing will not generally increase its height above the ground. He has to input his motion in sympathy with the oscillation of the swing. Starting at the ground with a little push back, the child can swing higher and higher with the same leg motion – the energy he adds to the swinging motion is accumulating, and it will continue to do so until friction with the air and with the pivot from which the swing is hanging carries away energy at a rate equal to what he is putting in.
So, similarly, if a small astronomical forcing creates climate variation at a frequency which is sympathetic to a natural mode of the Earth, then the energy associated with that forcing will accumulate, and could create a large oscillation given enough time. That has been my point, and that is the only way I can see that, what must be very small input forcing, can create a large climate effect.
I hope that may be helpful. I will read over your papers when I find the time. Thanks.
Geoff Sharp says:
March 13, 2012 at 10:53 pm
You made that claim about my Fourier analysis, but you have steadfastly refused to say what is wrong with it. Do you think I and others don’t notice that or will ignore it?
As to being “out of my field”, I’ve spent hundreds and hundreds of hours studying this very subject. I wrote a damn spreadsheet that calculates the barycentric orbits a decade ago. So you can stuff your “out of your field here Willis” BS into some dank and malodorous personal internal space. I may be wrong, as any man may be, but this is a field I know a goodly amount about.
Oh, wait … Geoff Sharp, I’ve heard that name before … weren’t you the brilliant fellow who was claiming upthread that the synodic cycle of Saturn/Jupiter was 60 years, when in fact it’s 19.87 years? … Yeah, that was you. And now you want to tell me I’M out of my field? I got schooled and instructed in this stuff by Ted Landscheidt himself, but I’m the one that’s out of my field …
Put your money where your mouth is or go home, Geoff. I’m tired this vague BS about being “out of my field.” If you think I’ve made a mistake, show me where, I’m happy to discuss it. Your nasty insinuations that amount to ‘you’re wrong, Willis, but I WON’T TELL YOU WHERE’ go nowhere without something to back them up.
w.
jeez says:
March 13, 2012 at 6:06 pm
Thanks, Jeez, I hadn’t seen that. You’re right, this is not the first time that Dr. Scafetta has tried the withholding stuff. His comments in that thread are priceless … and near as I can tell he never did release his code for his paper.
I am constantly surprised by the number of scientists, even young scientists, who have not grasped the nettle of full transparency demanded by 21st century science. We don’t have time for all that secrecy BS any more, the web is moving at lightspeed. I don’t have time to try to guess where Dr. S got his phases, or read 20 of his papers to find out. I don’t have time to try to figure out what some scientist has actually done with his code. He may not even know what his code is doing, bugs are a fact of life. Modern science requires and demands transparency, full and complete transparency, and when someone doesn’t practice that, we all suffer.
So it’s frustrating when someone like Dr. Scapetta tries to play his little games. I’m not asking much. Just point me at the answers. I’m not asking him to read me the damn thing, just lift a finger and point to where the answer can be found.
Why is that so hard for him? I truly don’t know … but he seems like a smart guy, so I do wish he’d come to the party.
w.
Willis Eschenbach says:
March 14, 2012 at 1:53 am
Oh, wait … Geoff Sharp, I’ve heard that name before … weren’t you the brilliant fellow who was claiming upthread that the synodic cycle of Saturn/Jupiter was 60 years, when in fact it’s 19.87 years? … Yeah, that was you. And now you want to tell me I’M out of my field? I got schooled and instructed in this stuff by Ted Landscheidt himself, but I’m the one that’s out of my field
Your style belittles you. I am surprised Anthony still puts up with you after your recent fiasco. You have absolutely no understanding of planetary theory and you have learned nothing from Theodor, you failed last time when not able to recognize 2nd order harmonics. Instead of shooting your mouth off, try educating yourself.
MAVukcevic says:
March 14, 2012 at 1:15 am
Dr. Scafetta
Willis Eschenbach has a point: But if you claim it has an astronomical cause, you have to show your figures regarding the phase, frequency, and amplitude of the cycles.
Event that is controlled (modulated, synchronised or both) by planetary cycles has to be repeatable and calculable as is the case with tides. Astronomy deals with precise numbers: 62 will not do for a 60 year cycle.
I am surprised to hear this from you Vuk. You of all people should know that nothing in the solar system complies to rigid mathematical constraints. The shape of the Holocene isotope record is testimate to that, along with the fallacy of the Jose 178.8 year cycle.
http://tinyurl.com/2dg9u22/?q=node/226
Agnostic says:
March 14, 2012 at 1:18 am
Quite possible, Agnostic. However, as I said above, objecting to the tone of the questions or the motives of the questioner simply won’t do. That’s just a way to avoid answering the questions. This is not some California feel-good deal, it’s a discussion of the science, man up. Science is the issue, not me or whether I’m polite enough.
I’m not saying that I don’t make an effort to be polite and generous and kind and the like. I do. And when I get the same, I’m a happy man.
But I’ve had it up to my eyeballs with obstructionist scientists. I made the very first, lonely FOIA request to Phil Jones of the CRU because he was pulling the kind of BS that Dr. Scafetta is pulling. So I’ve been there, done that, and as a result I don’t accept that kind of evasion at all these days. Those times are over, when Dr. Jones could just hide away his data and Mann could just hide away his code. I have no patience for that at all.
w.
Greenland temperature data (GISP2) is often mentioned in various papers with spectral response not either clear or even accurate. Here is an alternative version to the graph that Willis Eschenbach has kindly provided, but it is a bit easier to read.
http://www.vukcevic.talktalk.net/GISP2spec.htm
Graph is produced by a program specifically developed for analysing electronic signals, it is slow, made of several separate units, but it produces good results.
If anyone likes to use the graph you are welcome, or if Anthony thinks that it may be suitable to stick somewhere in the references even better.
Willis Eschenbach says:
March 14, 2012 at 2:57 am
But I’ve had it up to my eyeballs with obstructionist scientists.
You are all talk, my website and paper has all the supporting data which is mainly JPL data, if there is something missing let me know and I will send you the spreadsheets. Leif has been unable to find any flaws in the data, let’s see how you go?