I found this post interesting, especially after looking at some of the images that show what appears to be a tight hot spot upwelling off the coast of Costa Rica. But I simply can’t see enough energy in this venting to account for the massive energies dissipating in ENSO events. But, let’s give it a shakedown. I welcome comments from readers on this topic. – Anthony
Argo Data Confirms El Niño/El Niña Caused By Underwater Volcanoes
Guest post by AJ Strata of The Strata-Sphere
Last week I postulated that the El Niño/El Niña effect was not due to solar or atmospheric conditions, but actually caused by underwater volcanic activity along ocean ridges off the West coast of South America. To see whether my theory held water I decided to look into the Argo Float data to see if there it was showing a warm upwelling of water in this region. I apparently was correct.
My initial assessment was that the frigid Humboldt Current that comes north from the Antarctic region along the west coast of South America (the mirror image of the current that drops down from the Arctic along the west coast of North America) could not be warmed so drastically in such a short time by sun and air alone. This is due to the physics of ocean currents and the massive amount of heat required to warm tons of cold water moving northward per second:
Gyres are caused by the Coriolis Effect; planetary vorticity along with horizontal and vertical friction, which determine the circulation patterns from the wind curl (torque).[1] The term gyre can be used to refer to any type of vortex in the air or the sea, even one that is man-made, but it is most commonly used in oceanography to refer to the major ocean systems.
…
The “South Pacific Gyre” is the Earth’s biggest system of rotating ocean currents, bounded by equator to the north, Australia to the west, the Antarctic Circumpolar Current to the south, and South America to the east.
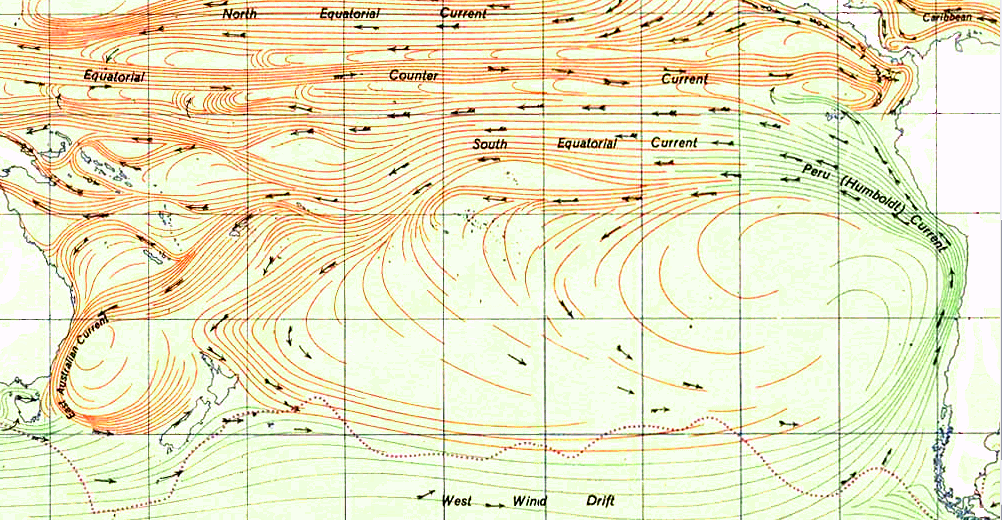
As can be seen in the graph above (click to enlarge), the Humboldt Current is one of the largest on the planet. It is infeasible that El Niño can arise from atmosphere and sun alone by warming this mass of water. Neither air temp or solar radiance change enough to cause this phenomena.
At this site you can watch animation of nearly 5 years of Argo data on the tropical region of the Pacific Ocean. It is fascinating and proves my earlier conclusion that the warm waters of El Niño arise from the eastern pacific and travel west – not the reverse as is the current (now defunct) theory. You need to set the start date on the left to the earliest date in 2007 and the end date to the latest in 2012.
I suggest you first watch the surface animation, then go the the 100m data. What you will see in the 100m is hot water upwelling off the coast of Costa Rica (which was not in the zone I originally predicted the upwelling would occur BTW). I have taken a few snaps of the data from Oct 2008 to Feb 2009 at 4 week interval to highlight what I discovered.
On this first image (click to enlarge) we see the very beginnings of the upwelling off the coast of Central America (area highlighted by red rectangle with a small blue dot). As time progresses the upwelling grows, moves west and another upwelling appears. The images are from 10_22_2008, 11_26_2008, 12_24_2008, 1_21_2009 and 2_25_2009.


Now some may ask why didn’t Argos detect the upwelling deeper (1000m)? The answer is in fluid dynamics. The hot spot is very narrow above whatever thermal vents are the source of this warming. The Argo floats are not very dense in this region. So the warm column of water upwelling has to spread out as it rises, making it more likely to be detected by the Argos floats. By the time it hits the surface the warm water really spreads out over top of the cooler layers below.
As this March 2009 surface image shows there are two upwellings in the area, but the one off Costa Rica is missed at the lower depths (again likely due to the density of sensors being so low in this area). And there appears to be a 3rd upwelling off the coast of Peru.

The activity of Nicaragua and Costa Rica is right along the Cocos Plate.

The Peruvian region I highlighted in the previous post and is linked to the Pacific Rise. Higher volcanic activity in these areas clearly cause more warm water to rise and heat the surface, creating the conditions for El Niño. Lower activity allows the cooler currents to dominate, bringing on El Niña.
The hot spot west of Costa Rica is associated with a surface eddy on 02/25/2009.
http://i.imgur.com/L2hMk.gif
More images at http://bulletin.mercator-ocean.fr/html/produits/bestproduct/welcome_anim_en.jsp?zone=pa1
1-2-3 for those short on time/motivation…
1. Near-Surface (850hPa) Wind:
http://i52.tinypic.com/nlo3dw.png
2. Column-integrated Water Vapor Flux with their Convergence:
http://i51.tinypic.com/126fc77.png
3. Wind-Driven Ocean Surface Currents:
http://upload.wikimedia.org/wikipedia/commons/6/67/Ocean_currents_1943_%28borderless%293.png
Question:
What drives the SHARED basin-loops (gyres) of 1-3?
Answer:
Net Surface Solar Radiation:
http://i53.tinypic.com/2r5pw9k.png
—
Extra – for those with time/stamina…
“Apart from all other reasons, the parameters of the geoid depend on the distribution of water over the planetary surface.” — N.S. Sidorenkov
4. Monthly Maximum of Daily Precipitation:
http://i41.tinypic.com/34gasr7.png
5. Evaporation Minus Precipitation:
http://i43.tinypic.com/2isvynb.png
6. Precipitable Water:
http://i52.tinypic.com/9r3pt2.png
Sidorenkov, N.S. (2005). Physics of the Earth’s rotation instabilities. Astronomical and Astrophysical Transactions 24(5), 425-439.
http://images.astronet.ru/pubd/2008/09/28/0001230882/425-439.pdf
Credit: Climatology animations have been assembled using JRA-25 Atlas [ http://ds.data.jma.go.jp/gmd/jra/atlas/eng/atlas-tope.htm ] images. JRA-25 long-term reanalysis is a collaboration of Japan Meteorological Agency (JMA) & Central Research Institute of Electric Power Industry (CRIEPI).
–
Suggestion for feet2thefire:
Consider the relationship between evaporation & wind.
–
For those wishing deeper understanding, carefully study ALL of the animations COMPARATIVELY…
http://wattsupwiththat.com/2012/01/31/a-japanese-puzzle/#comment-882297
…in conjunction with the first few google hits for “thermal wind“:
1. Thermal Wind
http://en.wikipedia.org/wiki/Thermal_wind
=—
“Jet Stream
A horizontal temperature gradient exists while moving North-South along a meridian because the curvature of the Earth allows for more solar heating at the equator than at the poles. This creates a westerly geostrophic wind pattern to form in the mid-latitudes. Because thermal wind causes an increase in wind velocity with height, the westerly pattern increases in intensity up until the tropopause, creating a strong wind current known as the jet stream. The Northern and Southern Hemispheres exhibit similar jet stream patterns in the mid-latitudes.
Using the same Thermal Wind argument, the strongest part of the jet stream should be in proximity where temperature gradients are the largest. Due to the setup of the continents in the North America, largest temperature contrasts are observed on the east coast of North America (boundary between Canadian cold air mass and the Gulf Stream/warmer Atlantic) and Eurasia (boundary between the boreal winter monsoon/Siberian cold air mass and the warm Pacific). Indeed, the strongest part of the boreal winter Northern Hemisphere jet is observed over east coast of North America and Eurasia as well. Since stronger vertical shear promotes baroclinic instability, so the most rapid development of extratropical cyclones (so called bombs) is also observed along the east coast of North America and Eurasia.
A similar argument can be applied to the Southern Hemisphere. The lack of continents in the Southern Hemisphere should lead to a more constant jet with longitude (i.e. a more zonally symmetric jet), and that is indeed the case in observations.”
—=
2. What is the thermal wind?
http://www.theweatherprediction.com/habyhints2/407/
=—
“The first word in the term is thermal. Thermal as you may have guessed deals with temperature. The thermal wind is set up by a change in temperature over a change in distance. When thinking of how the thermal wind sets up think of the polar jet stream. To the north of the polar jet stream the air is cold. Since the air is cold the thickness values (and heights) are lower since cold air is more dense. To the south of the polar jet stream the air is warm. Since air is warm the thickness values are higher since warm air is less dense. A north to south temperature gradient is set up and the height values slope over this distance. When height values slope (think of height contours close together on upper level charts) the pressure gradient force is put into action. It is the Pressure Gradient Force that causes the wind to blow. Whether it is the jet stream, a mid-latitude cyclone or a sea breeze it is the change in temperature over distance that sets the wind in motion. The thermal wind occurs above the boundary layer since friction is not an influence on altering the wind direction aloft.
The wind direction in association with the jet stream generally travels from west to east. This is because the Pressure Gradient Force moves air from higher heights toward lower heights and the Coriolis deflection deflects the air to the right of the path of motion in the Northern Hemisphere. Thus, air moving from south toward north is deflected to the east due to Earth’s rotation. […]
The thermal wind flow parallel to thickness lines. Remember that thickness is a function of temperature. […]
The magnitude of the wind will be a function of how strong the temperature gradient is. When the height contours or thickness values of packed close together then the wind will be strong.
[…] The thermal wind can be thought of as a steering influence for the direction and magnitude that storms move.
[…] the thermal wind is a wind that flow parallel to the temperature gradient in the troposphere. The thermal wind explains the magnitude and direction the wind will take when a temperature change occurs over a horizontal distance.”
—=
3. Thickness and Thermal Wind
http://www.aos.wisc.edu/~aalopez/aos101/wk12.html
=—
“Summary of the Thickness and Wind presentation [ http://www.aos.wisc.edu/~aalopez/aos101/wk12/ThermalWind.ppt ]:
• Cold air is more dense, therefore thinner
• Warm air is less dense, therefore thicker
• Temperature is the only factor that changes the thickness of a layer
• When you have a temperature contrast, you create height variations for a layer
• Height variation create a pressure gradient
• Pressure gradient creates a PGF [pressure gradient force]
• The change in the Geostrophic Wind is directly proportional to the horizontal temperature gradient
This is the Thermal (temperature) Wind relationship”
—=
4. Fronts and the Thermal Wind Equation – Narrowing the Jet Stream
http://www.mit.edu/~predawn/jetstream/thermalwind.html
=—
“One can combine the equations for the geostrophic wind and the hydrostatic balance as discussed in previous sections to obtain the Thermal Wind Equation as shown below. The thermal wind equation states that the change in wind speed with height (here expressed in pressure coordinates) is equal to the (-R/f) times the change in temperature across the front on a constant pressure surface, divided by the pressure. The most important concept from these relations, is that the steep temperature gradients created by the fronts generate winds to satisfy this thermal wind equation, proportional to the strength of the front. The winds are geostrophic and flow along the constant pressure isobars around both poles [2].”
“The effects of these polar fronts are two fold: they concentrate the west to east geostrophic flow at the frontal boundaries where the large temperature gradients induce large thermal winds. Secondly, they also increase the flow with altitude, creating the very fast Jet Stream at high levels around 250mb. […] The strong, high altitude wind centers indicate the location of the Jet Stream!”
—=
Regards.
I wasn’t saying that drilling was killing dolphins. I was quoting the article about the dolphin deaths and I guess I forgot the parenthesis. What I was trying to point out is that there is an unusual event occurring in the neighborhood of this anomaly. Hundreds of dolphins, and who knows how many anchovies, have died. Maybe it is connected in some way – or not.
Paul Vaughan says:
February 17, 2012 at 7:38 pm
No way I’m gonna hack my way through all of that verbiage, Paul. What is your point?
Re-read my request that you be BRIEF. CLEAR. INTERESTING.
I regret to say your post was none of the three. What is it you are trying to say? What is your point, your central core idea that you are trying to get across? It sounds like it might be interesting, so spit it out.
Never mind the citations, they are USELESS unless we first know what it is you are on about. Then, and only then, are they helpful. Until then, following your endless citations is just a guessing game trying to figure out what you mean … and I’m not even slightly interested in playing that game.
w.
If you want to learn about our oceans, I mean really learn,
go here:
http://bobtisdale.wordpress.com/
If you don’t, be careful what you say.
The Earth is a rotating sphere with an atmosphere. As we see with even the gas giant planets this sets-up a general pattern of atmospheric circulation. For Earth, the equatorial winds generally blow to the West, the mid-latitude winds generally blow to the East and vortexes are established at the poles. On Jupiter, there are more latitude bands, some going East, some going West. This is what a rotating sphere with an atmosphere does.
After that, Earth has continents and the geography of mid-depth continental shelves confines the ocean currents to a certain geography. Generally, at least 200 metres of ocean is required to carry a strong current.
ALL the ocean currents are driven by these prevailing winds subject to the confinement of continental geography (and the Earth’s rotation also contributes).
Watch this animation of winds and clouds over one full year, every hour. It is 40 mb but well worth downloading as it is the best explanation of the climate you will ever see.
https://www.ucar.edu/publications/nsf_review/animations/ccm3.512×256.mpg
Now observe the main ocean currents over 30 days last November.
http://www7320.nrlssc.navy.mil/global_nlom32/navo/WHOSP1_nlomw12930doper.gif
Now let’s zoom in and see how the Gulf Stream is really defined by these two issues; equatorial winds blowing west, confinement by mid-depth continental shelves, mid-latitude winds blowing east.
http://www7320.nrlssc.navy.mil/global_nlom32/navo/IASSP1_nlomw12930doper.gif
http://maps.google.ca/maps?hl=en&ll=20.920397,-70.092773&spn=29.197817,67.456055&t=k&z=5
The westerly Atlantic Trade Winds pile the water up against South America. The geography forces the water to the north into the Intra-Americas Sea, the water follows a path which is mid-depth and it flows between Cuba and Mexico into the Gulf of Mexico. Over time, the push of the water from the equator has formed a Loop Current in the Gulf of Mexico. It then flows between Florida and the Bahamas, confined by the available mid-depths again. It flows up to Virginia, where the prevailing winds now shift to blowing East. At 45N, it starts flowing directly across the Atlantic, eventually moving into the north Atlantic north of Norway where again the continental geography and the prevailing winds have forced it to. The Kuroshio Current in the Pacific follows exactly the same pattern. The Agulhas Current follows the same pattern, the Brazil-Malvinus Confluence follows the same pattern.
The Antarctic Circumpolar Current is also driven by the prevailing winds and the continental geography. Sailing Ships could not get through the Drake Passage to the Pacific because of the strong winds and strong currents caused by the West-East winds.
Now this is just the surface. Once the water piles up against a continent, it has to go somewhere. The wind is continually piling up the water. Sometimes it will flow down and form under-currents. Sometimes it will flow backwards against the winds, as the equatorial counter-currents. Most of the time, it will establish large ocean-wind gyres of which there at least 5 major ones.
Wind, geography and rotation.
JimF says:
February 17, 2012 at 6:55 pm
&
JimF says:
February 17, 2012 at 7:09 pm
Thank you JimF, for both posts and the link.
I put in the radioctivity quote for interest because I’d never heard of this before and thought the 10% a lot, doesn’t say where that figure came from.
The other link to http://www.fs.fed.us/ccrc/bibliography/5_3_holocene.shtml
“^ topLoubere, P., M. Richaud, Z. Liu, F. Mekik (2003). Oceanic conditions in the eastern equatorial Pacific during the onset of ENSO in the Holocene. Quaternary Research 60 (2): 142-148
“ABSTRACT: Records from South America show that modern ENSO (El Nino-Southern Oscillation) did not exist 7000 cal yr B.P. and has developed progressively since then. There has been little information available on oceanic conditions in the eastern equatorial Pacific (EEP) to constrain explanations for ENSO onset. etc.”
I found more interesting, but it’s only an abstract and I don’t have easy familiarity with the references, I wondered what the reason for ENSO not existing and then gradually coming into being – just my own speculation about the glacial conditions ‘relaxing’ somehow. I think this would be around the beginning of the Holocene Optimum for that region (but still exploring HO so not yet sure of the sequence), so sea levels would likely be coming up the 300′ plus they rose when we came out of the glaciation – and there would have been the accompanying rises in the land masses as the very great weight of ice disappeared. These don’t always do what one might think, like in Britain for instance, as Scotland rose a couple of hundred feet the South of England sank, Scotland was fully under ice while the South of England not before our Holocene. Anyway, is there an explanation of how it came into being?
@Willis Eschenbach (February 17, 2012 at 9:30 pm)
The comments of Bill Illis (February 18, 2012 at 4:31 am) might be a translation acceptable to you Willis. Note particularly Bill’s last 2 sentences:
“Most of the time, it will establish large ocean-wind gyres of which there at least 5 major ones.
Wind, geography and rotation.”
Thanks Bill – a post well-worth bookmarking and sharing to help efficiently enlighten others:
http://wattsupwiththat.com/2012/02/15/do-underwater-volcanoes-have-an-effect-on-enso/#comment-896133
Bill, it’s obvious that you have experience communicating these concepts.
Willis: Once people get these basics into their heads, we can revisit LeMouel, Blanter, Shnirman, & Courtillot (2010). They made a game-changing finding, but without a handle on the basics of atmospheric circulation, ocean surface currents, & the spatiotemporal nature of interannual terrestrial variability, almost no one around here has recognized the power, simplicity, & beauty of their seminal finding. That includes (very unfortunately) Judith Curry — and there’s really no longer a good excuse as there has now been plenty of time since 2010 to study works like the following to develop the background necessary to understand:
Zhou, YH; Yan, XH; Ding, XL; Liao, XH; Zheng, DW; Liu, WT; Pan, JY; Fang, MQ; & He, MX (2004). Excitation of non-atmospheric polar motion by the migration of the Pacific Warm Pool. Journal of Geodesy 78, 109-113.
http://202.127.29.4/yhzhou/ZhouYH_2004JG_PM_Warmpool.pdf
Gross, R.S. (2007). Earth rotation variations – long period. In: Herring, T.A. (ed.), Treatise on Geophysics vol. 11 (Physical Geodesy), Elsevier, Amsterdam, in press, 2007.
http://geodesy.eng.ohio-state.edu/course/refpapers/Gross_Geodesy_LpER07.pdf
http://geodesy.geology.ohio-state.edu/course/refpapers/Gross_Geodesy_LpER07.pdf
Sidorenkov, N.S. (2005). Physics of the Earth’s rotation instabilities. Astronomical and Astrophysical Transactions 24(5), 425-439.
http://images.astronet.ru/pubd/2008/09/28/0001230882/425-439.pdf
Paul Vaughan says:
February 18, 2012 at 11:34 am
You mean the part where Bill makes the extraordinary and unsupported claim that
I see this all the time. People get a good idea, and then they decide that their good idea is the best idea. Then they get the idea that every single thing is ruled by their good idea.
No, guys, ALL currents are not driven by the wind. If there were no atmosphere at all, we’d still have thermal currents and thermohaline currents. The latter in particular are some of the largest currents in the ocean, so the claim is totally false.
w.
Willis, your conception is wrong. You’ve just lost what little trust I had of you.
JimF re your previous: More efficiently, the innards (asthenosphere) of the Earth are hot enough to flow and thus convect, and bring hot stuff directly to the surface in the spreading centers (mostly hidden in the ocean basins, but cutting through Africa in the East African Rift). In other places, the asthenosphere puts up small plumes of hot material, forming volcanoes as in Yellowstone or Hawaii. Finally, the asthenosphere heats and partially melts cold oceanic crust that is dense enough to sink back into it, and forms arc-related volcanoes, just like the line of volcanos AJ depicts in one of the figures at the top of this page.
I’ve been looking at divergent boundries – http://geology.about.com/library/bl/blnutshell_divergence.htm
“In divergent zones this pulling motion uncovers the hot deep mantle rock of the asthenosphere. As the pressure eases on the deep rocks, they begin to partially melt even though their temperature may fall. (This is called adiabatic melting.) The melted portion expands (as melted solids generally do) and rises, having nowhere else it can go. This magma then freezes onto the trailing edges of the diverging plates, and so the plates grow.
New lithosphere is born hot and cools over millions of years. As it cools it shrinks, thus the fresh sea floor stands higher than the older lithosphere on either side. This is why divergent zones take the form of long, wide swells running along the ocean floor: mid-ocean ridges. The ridges are only a few kilometers high but hundreds wide. The very gentle slope of a ridge means that diverging plates get an assist from gravity, a force called “ridge push” that together with slab pull accounts for most of the energy driving the plates. On the crest of each ridge is a line of volcanic activity. This is where the famous black smokers of the deep sea floor are found.
Plates diverge at a wide range of speeds, giving rise to differences in spreading ridges. Slow-spreading ridges like the Mid-Atlantic Ridge have steeper-sloping sides because it takes less distance for their new lithosphere to cool. They have relatively little magma production so that the ridge crest can develop a deep dropped-down block, a rift valley, at its center. Fast-spreading ridges like the East Pacific Rise make more magma and lack rift valleys. ”
Seems to me could well explain this in AJStrata’s opening post:
“It is fascinating and proves my earlier conclusion that the warm waters of El Niño arise from the eastern pacific and travel west – not the reverse as is the current (now defunct) theory. You need to set the start date on the left to the earliest date in 2007 and the end date to the latest in 2012.”
I wonder if this divergent ridge in the East Pacific is different in being fast spreading because it is newer? If this could account for there being no such critter ENSO before 7000bp, and so, maybe does have something to do with heaving land masses after end of glaciation, and around the Holocene max?
“ABSTRACT: Records from South America show that modern ENSO (El Nino-Southern Oscillation) did not exist 7000 cal yr B.P. and has developed progressively since then.”
Hey, I’m quite taken with the idea…. 🙂
AP?
Thermohaline currents:
http://www.pik-potsdam.de/~stefan/thc_fact_sheet.html
“What is the thermohaline circulation (THC)?
As opposed to wind-driven currents and tides (which are due to the gravity of moon and sun), the thermohaline circulation (Fig. 1) is that part of the ocean circulation which is driven by density differences. Sea water density depends on temperature and salinity, hence the name thermo-haline. The salinity and temperature differences arise from heating/cooling at the sea surface and from the surface freshwater fluxes (evaporation and sea ice formation enhance salinity; precipitation, runoff and ice-melt decrease salinity). Heat sources at the ocean bottom play a minor role. ”
..or maybe they don’t.
http://www.killerinourmidst.com/THC.html for good pics.
P.S. Re my ENSO beginning idea – the abstract I quoted said not much is available on why this didn’t exist – so this idea could be important, couldn’t it (if it was right)? Would that make me a scientist???
Oh yeah, there is the thermohaline ocean circulation of the deep oceans and other medium-depth ocean currents as well. They are driven by the indirect magnetic influence of Saturn.
Myrrh says:
February 18, 2012 at 3:23 pm “…“It is fascinating and proves my earlier conclusion that the warm waters of El Niño arise from the eastern pacific and travel west…”
The spreading ridges have NOTHING to do with El Nino. The East Pacific Rise tops out several thousand meters below the surface – which is where El Nino cavorts. The ridges expand at dizzying rates of 0 to 6 cm (0 to 2.5 inches) a year – not exactly sloshing water around. They don’t contract – acting like an accordion – to put a back and forth motion into water.
They are fascinating in their own right, showing us how the interior earth handles its massive heat content, and giving rise to situations where materials of economic importance can be formed and concentrated. But they don’t have much effect on oceanic water movement, or Earth’s oceanic and atmospheric content, or lot and lots of other things.
Bill Illis says:
February 18, 2012 at 4:07 pm
Oh yeah, there is the thermohaline ocean circulation of the deep oceans and other medium-depth ocean currents as well. They are driven by the indirect magnetic influence of Saturn.
OK, I’m a newbie to all this, but, why can’t they both be in play? We’ve got two huge oceans around us, both heavy fluids subject to density variations. In the atmosphere this fluid is gas and it’s in the differences in density of the gas from temperature, as heated gases become less dense and rise and cooled gases become more dense and sink, which creates the great wind systems, which drive ocean currents. How does the fluid liquid water in the ocean get off being subject to similar effects from temperature differences producing its own convecting ‘winds’? Wind is volumes of air on the move.
If the Earth wasn’t spinning, the atmosphere currents, the winds, would form from the basic heated air rising at the equator and heading towards the poles with the colder polar air coming in beneath, with the spin we get an added pattern.
Maybe this similarly drives the fluid liquid water ocean.
http://www.killerinourmidst.com/grafix/THC%20Frakes.jpg
Actually, how can it not?
“is that part of the ocean circulation which is driven by density differences. Sea water density depends on temperature and salinity, hence the name thermo-haline. The salinity and temperature differences arise from heating/cooling at the sea surface and from the surface freshwater fluxes (evaporation and sea ice formation enhance salinity; precipitation, runoff and ice-melt decrease salinity”
Hot water rises, colder sinks, just as in the ocean of air above us, and salt alters temps, and so on, and, the pull of planets is bound to have an effect – our tides are two-thirds due to the Moon and one third to the Sun – or are you saying these are wind driven?
It would be interesting to contrast the two systems. The atmosphere currents don’t cross the equator.
AJ says in his text:
“It is fascinating and proves my earlier conclusion…”
I hate it when anyone – warmist, skeptic, indie – says something proves something. There are so few things that are actual proofs of anything whatsoever.
The correct assertion is that some bit of evidence “is consistent with” what someone’s conclusion is. Anything beyond ‘consistent with’ displays how black and white someone’s perspective is.’
The statements by Bob Tisdale and Willis are also sometimes couched in such terms, that it is already “known” that such and such is a fact. Given the number of ‘facts’ in science that have been shown to be wrong, I take such statements with a grain of salt, no matter who made them – even Nobel prize winners. After all, if Newtonian physics can be superceded, pretty much everything is fair game. Let’s not forget that everyone ‘knew’ that Aristotle was right – for 2,000 years. Heavy things fall faster than light things, right?
Especially in the field of climatology, every piece of evidence is only an interpretation. Every bit is seen by the warmists one way and by skeptics another. You couldn’t dream up a science that is less certain and less unsettled than climatology. It is, as so many here say, in its infancy. I started out with that perspective, that it is in its infancy, over ten years ago, and I have seen nothing in that time to disabuse me of that perspective. “Jump-to-conclusions-ology” might as well be its AKA.
No piece of evidence proves anything. Least of all in climatology. Climatology doesn’t even have its feed underneath itself yet, and won’t, for probably another 50-100 years. Years from now people WILL look back and laugh at all the claims of proof running around right now. And the one they will laugh loudest at is global warming being caused by humans and our CO2.
But let’s not give them more to laugh at.
Steve Garcia
Given how much statistics there are in climatology, let us never forget Mark Twain’s perspective:
Steve Garcia
Bill Illis (February 18, 2012 at 4:07 pm) wrote:
“Oh yeah, there is the thermohaline ocean circulation of the deep oceans and other medium-depth ocean currents as well. They are driven by the indirect magnetic influence of Saturn.”
Might as well be (for all the minor relative-amplitude they have) — Great sense of humor Bill – (no offense vukcevic!)
Ocean-atmosphere interactions occur guess-where? At the surface. They’re HUGE at the ANNUAL timescale. (yes that’s a sarcastic bite, intended to hopefully awaken those overlooking the obvious…)
I think sometimes that with all the drunken anomaly-think that goes on around here people loose proper perspective on the relative amplitude of THE YEAR.
It’s tragically comical seeing a regular, respected contributor putting multidecadal variations above the year in amplitude. Willis, you’re popular around here, but even you can’t get away with that!
Paul Vaughan says:
February 18, 2012 at 8:41 pm
Bill, you are the one that claimed that ALL currents were driven by the wind. When I point out they’re not, you fall into nonsense. How about a simple “Gee, folks, I was wrong about ALL of currents being caused by the wind.”

Not only that, but you seem to think that the thermohaline currents are in the “deep ocean” …
BZZZT! Nice try, but the thermohaline circulation is at the surface as well as down deep.
Bill, when you are wrong, trying to weasel out of it doesn’t work with me, even if you think it’s funny to bring in Saturn. It’s not, it’s just a sneaky way to avoid admitting you were wrong.
Get away with what? With pointing out that ALL ocean currents are not driven by the wind? You seem to be suffering from some strange fantasy that I said something about the amplitude of “multidecadal variations” … where did I do that, Paul?
As I have said many times, Paul, QUOTE MY WORDS if you disagree with them. Just exactly WHAT are you claiming that I said was wrong? Because your kind of vague attack is underhanded and scurrilous, you are very passionately and emphatically accusing me of doing something very wrong … but what?
w.
PS—And what is “drunken-anomaly think” when it’s at home, other than another way to attack people without actually providing a scrap of evidence for any of your nasty claims?
Of course, not every single ocean current on the planet is driven by the wind. My post was already way too long and I’ve talked about the thermohaline ocean circulation many times before.
There was just some confusion above about the utlimate driver of most of the surface ocean currents so I added in my perspective. It should have been viewed as helpful.
Bill Illis (February 19, 2012 at 4:08 am) wrote:
“There was just some confusion above about the utlimate driver of most of the surface ocean currents so I added in my perspective. It should have been viewed as helpful.”
I certainly viewed Bill’s comments positively.
The key word here is “surface”. Above Bill left it inferred from context when he wrote “ALL”. Here he has clarified explicitly. I often forget to write “surface” when writing of ocean surface currents, so this episode has been instructive.
Hopefully the clarification has resolved the issue for Willis.
To first order, ocean surface currents are wind-driven.
Near-Surface (850hPa) Wind:
http://i52.tinypic.com/nlo3dw.png
Wind-Driven Ocean Surface Currents:
http://upload.wikimedia.org/wikipedia/commons/6/67/Ocean_currents_1943_%28borderless%293.png
Best Regards to All.
Willis,
The diagram of the thermohaline currents you posted is the same as the one at wikipedia, where the explanation begins with the wind:
Wind-driven surface currents (such as the Gulf Stream) head polewards from the equatorial Atlantic Ocean, cooling all the while and eventually sinking at high latitude…
http://en.wikipedia.org/wiki/Thermohaline_circulation
So it appears that wind is an important factor in driving even that current.
This concept was first published at ClimateRealists.com in May of 2009 as “Motive force for All Climate Change” and read into the US Congressional Record as part of the Minority Report on AGW. This “Unified Earth Science Theory” has been further expanded in over 100 articles describing details of these complex processes and is the subject of my chapter in “Slaying the Sky Dragon”. These articles have been crosslinked to over 250,000 websites in twenty languages, and repeatedly dismissed by ‘experts’ who have more orthodoxy than objectivity.
The most revelant of these articles are now posted at the Faux Science Slayer website under the “Geo-nuclear” tab. The undersea “ring of fire” is in fact a near continuous vent line for thousands of miles, discharging massive amounts of heat and the “elemental” by-products of Earth’s variable fission furnace at 3000 to 7000 ft depths. In addition to controlling the climate, this process provides the feedstock for our atmosphere and our planets petroleum production. This is described in “Fossil Fuel is Nuclear Waste”.
An even more stunning insight was the manor in which this massive geothermal energy is stored and hidden in plain sight. That is explained in “Earth’s Missing Geothermal Flux”. All you ‘know’ about Earth Science is flawed and it is past time for a new paradigm
Bill Illis says:
February 19, 2012 at 4:08 am
Bill, what you actually said was:
Now you want to waffle about it, and say “Of course” your statement wasn’t true at all … but that’s what I said, that your statement wasn’t true.
Things are only helpful if they are accurate. Saying (as you did) that ALL surface currents are driven by the wind is neither helpful, nor is it true. You may not like that, and you may not like me for pointing it out … but it is not helpful in the slightest to spread misinformation.
w.
Paul, I’m still waiting for you to explain your attack … you said:
w.