I found this post interesting, especially after looking at some of the images that show what appears to be a tight hot spot upwelling off the coast of Costa Rica. But I simply can’t see enough energy in this venting to account for the massive energies dissipating in ENSO events. But, let’s give it a shakedown. I welcome comments from readers on this topic. – Anthony
Argo Data Confirms El Niño/El Niña Caused By Underwater Volcanoes
Guest post by AJ Strata of The Strata-Sphere
Last week I postulated that the El Niño/El Niña effect was not due to solar or atmospheric conditions, but actually caused by underwater volcanic activity along ocean ridges off the West coast of South America. To see whether my theory held water I decided to look into the Argo Float data to see if there it was showing a warm upwelling of water in this region. I apparently was correct.
My initial assessment was that the frigid Humboldt Current that comes north from the Antarctic region along the west coast of South America (the mirror image of the current that drops down from the Arctic along the west coast of North America) could not be warmed so drastically in such a short time by sun and air alone. This is due to the physics of ocean currents and the massive amount of heat required to warm tons of cold water moving northward per second:
Gyres are caused by the Coriolis Effect; planetary vorticity along with horizontal and vertical friction, which determine the circulation patterns from the wind curl (torque).[1] The term gyre can be used to refer to any type of vortex in the air or the sea, even one that is man-made, but it is most commonly used in oceanography to refer to the major ocean systems.
…
The “South Pacific Gyre” is the Earth’s biggest system of rotating ocean currents, bounded by equator to the north, Australia to the west, the Antarctic Circumpolar Current to the south, and South America to the east.
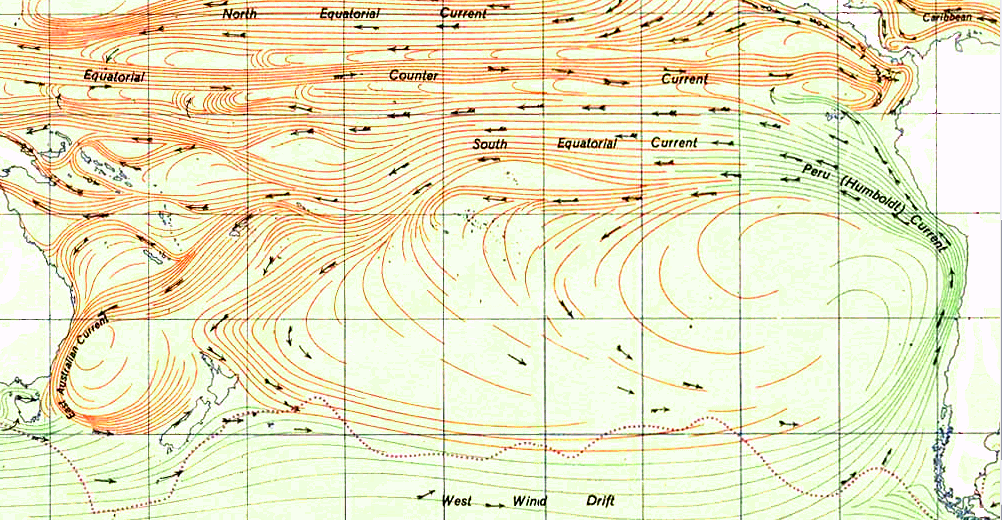
As can be seen in the graph above (click to enlarge), the Humboldt Current is one of the largest on the planet. It is infeasible that El Niño can arise from atmosphere and sun alone by warming this mass of water. Neither air temp or solar radiance change enough to cause this phenomena.
At this site you can watch animation of nearly 5 years of Argo data on the tropical region of the Pacific Ocean. It is fascinating and proves my earlier conclusion that the warm waters of El Niño arise from the eastern pacific and travel west – not the reverse as is the current (now defunct) theory. You need to set the start date on the left to the earliest date in 2007 and the end date to the latest in 2012.
I suggest you first watch the surface animation, then go the the 100m data. What you will see in the 100m is hot water upwelling off the coast of Costa Rica (which was not in the zone I originally predicted the upwelling would occur BTW). I have taken a few snaps of the data from Oct 2008 to Feb 2009 at 4 week interval to highlight what I discovered.
On this first image (click to enlarge) we see the very beginnings of the upwelling off the coast of Central America (area highlighted by red rectangle with a small blue dot). As time progresses the upwelling grows, moves west and another upwelling appears. The images are from 10_22_2008, 11_26_2008, 12_24_2008, 1_21_2009 and 2_25_2009.


Now some may ask why didn’t Argos detect the upwelling deeper (1000m)? The answer is in fluid dynamics. The hot spot is very narrow above whatever thermal vents are the source of this warming. The Argo floats are not very dense in this region. So the warm column of water upwelling has to spread out as it rises, making it more likely to be detected by the Argos floats. By the time it hits the surface the warm water really spreads out over top of the cooler layers below.
As this March 2009 surface image shows there are two upwellings in the area, but the one off Costa Rica is missed at the lower depths (again likely due to the density of sensors being so low in this area). And there appears to be a 3rd upwelling off the coast of Peru.

The activity of Nicaragua and Costa Rica is right along the Cocos Plate.

The Peruvian region I highlighted in the previous post and is linked to the Pacific Rise. Higher volcanic activity in these areas clearly cause more warm water to rise and heat the surface, creating the conditions for El Niño. Lower activity allows the cooler currents to dominate, bringing on El Niña.
Re “I’m wondering if I’ve found Trenberth’s missing heat”
Nope, found MUCH more than that. Trenberth’s missing energy is about 1 W.m2, see:-
http://4.bp.blogspot.com/_0ZFCv_xbfPo/S80kvmdKttI/AAAAAAAAAW0/dUxsHgoNpzo/s1600/tren.sci.jpg
That only equates to 510 GW (Surface Area of Earth: 510,065,600,000 m2 )
But 44,000 GW (KamLAND, geo science) – 45.9 GW (0.09 W.m2, climate science) = 43,954 GW
Trenberth’s missing heat (as per Global Net Energy Budget linked) is a minor problem.
KamLAND reports a geo flux of 44 TW (44,000 GW), If the area of the surface of the earth is 510 Gm2, the geo flux is 44,000/510 = 86 W.m2.
‘Earth’s Global Energy Budget’ (TF&K09) allocates a geo flux of, wait for it………
0 W.m2
The salt water/fresh water/land split is: Total salt water surface area: 69.03%; Total fresh water surface area: 1.77%; Total land surface area: 29.2%. http://chartsbin.com/view/wwu
Therefore;-
Geo flux to ocean = 44,000*0.6903 = 30,373 GW
Geo flux to land = 44,000*0.292 = 12,848 GW
I’ve been corrected, the area of the earth is 519,000,000,000,000 = 519 Tm2
519 Tm2 * 0.09 W.m2 = 45.9 TW (climate science geo flux)
This approximates 44 TW (geo-science geo flux)
The fact remains that the geo flux to the ocean is: 44*0.6903 = 30.37 TW
Getting interesting at Hot Topic, my last comment:-
Richard C2 March 6, 2012 at 12:34 am
Mike, working backwards.
My figures:-
84 TW / 510 Tm2 = 0.16 W.m2 (solar)
44 TW / 510 Tm2 = 0.09 W.m2 (geothermal)
Your figures (TF&K09)
82,000 TW / 510 Tm2 = 161 W.m2 (solar)
44 TW / 510 Tm2 = 0.09 W.m2 (geothermal)
I cannot find a reference to your figure of 82,000 TW (82 PW) but I can find 84 TW (Google it). Can you provide a link to a reference supporting 82 PW please?
http://hot-topic.co.nz/people-talking-6/#comment-30366
Off topic here but Rob Painting (Dappledwater), an officionado from Skeptical Science is pushing Peter Minnet’s (Real Climate) bastardization of the cool skin effect at the ocean surface in an attempt to invoke a GHG OHC “forcing” (actually an insulation effect apparently – and bogus) . The posited effect does not appear in IPCC AR4 2007 but the actual physics is documented in ‘Cool-skin warm layer’ Fairall et al 1996. Painting has regurgitated Minnet’s opining at Skeptical Science.
Painting’s response here:-
Dappledwater March 5, 2012 at 10:09 pm
Richard c2 – “The opinion of Peter Minnet that you have been pushing does not appear in IPCC AR4 2007. In short, you are making stuff up.”
Oh, the irony! So why is it that the spectra of outgoing radiation shows carbon dioxide blocking more heat escaping to space? Nothing to do with the tropical tropospheric hotspot by the way – that just shows, once again, that you don’t know what you’re on about.
http://hot-topic.co.nz/people-talking-6/#comment-30363