Bob has asked me to carry this post, and I’m happy to do so. For those who want to criticize without contributing anything but criticism, I offer this insight: The only real mistake is the one from which we learn nothing. ~John Powell
-Anthony
Revised Post – On Foster and Rahmstorf (2011)
Guest post by Bob Tisdale
ABOUT THE ERROR-LADEN FIRST VERSION OF THIS POST
I displayed my very limited understanding of statistics in my post On Foster and Rahmstorf 2011 – Global temperature evolution 1979–2010. This was pointed out to me a great number times by many different people in numerous comments received in the WattsUpWithThat cross post. My errors in that portion of the post were so many and so great that they detracted from the bulk of the post, which was about the El Niño-Southern Oscillation. For that reason, I have added a third update to my earlier post on Foster and Rahmstorf (2011), which asks readers to disregard that post and the cross post at WUWT. That update also includes a link that redirects readers here.
I learned a lot from my mistakes. Many of those who commented provided detailed explanations of the methods used by Foster and Rahmstorf (2011). Thanks go to them.
When an author of a blog post makes a major mistake, it needs to be acknowledged and/or corrected, and I have done this multiple times for that portion of my earlier post about Foster and Rahmstorf (2011). Now I’m reposting an expanded version of the discussion of ENSO. If you’d still like to discuss the errors I made in the earlier post, please comment on that thread, not this one.
OVERVIEW
This post discusses the assumption made in the paper Foster and Rahmstorf (2011) “Global Temperature Evolution 1979–2010”that the variations in the global temperature record due to El Niño-Southern Oscillation (ENSO) can be estimated from an ENSO index. This post excludes all discussions of the statistical methods used by Foster and Rahmstorf in their paper. Please limit the comments on this thread to ENSO and surface temperature responses to ENSO.
INTRODUCTION
Foster and Rahmstorf (2011) attempted to remove from 5 global temperature datasets the linear effects of 3 factors that are known to cause variations in global temperature. The paper covered the period of 1979 to 2010. The intent of their paper was to show that anthropogenic global warming continues unabated in all of those datasets. The independent variables listed in the abstract of Foster and Rahmstorf (2011) are El Niño-Southern Oscillation (ENSO), volcanic aerosols, and solar variations.
Foster and Rahmstorf (2011) used independent measures for these three factors. Total Solar Irradiance and aerosol optical depth data were used to estimate the effects of solar variability and volcanic aerosols on global surface temperatures. This post does not pertain to them. This post initially discusses the attempt by Foster and Rahmstorf (2011) to use an ENSO index as a measure of the effects of ENSO on global surface temperature. What will then be discussed and shown is that an ENSO index cannot account for the effects of ENSO on global surface temperatures.
Foster and Rahmstorf (2011) also makes two more assumptions that have little basis in reality. They assume the rise in surface temperatures since 1979 was linear and that it was due to anthropogenic factors. The sea surface temperature record of the global oceans since 1982 clearly disagrees with these assumptions.
ENSO IS NOT AN EXOGENOUS FACTOR
The following two papers discuss the problems with the assumption made by Foster and Rahmstorf (2011) about ENSO. One of the papers was cited by them in their paper.
Foster and Rahmstorf (2011) cited Trenberth et al (2002) Evolution of El Nino–Southern Oscillation and global atmospheric surface temperatures”as one of their ENSO references. But Trenberth et al (2002) include the following disclaimer in the second paragraph of their Conclusions, (their paragraph 52, my boldface):
The main tool used in this study is correlation and regression analysis that, through least squares fitting, tends to emphasize the larger events. This seems appropriate as it is in those events that the signal is clearly larger than the noise. Moreover, the method properly weights each event (unlike many composite analyses). Although it is possible to use regression to eliminate the linear portion of the global mean temperature signal associated with ENSO, the processes that contribute regionally to the global mean differ considerably, and the linear approach likely leaves an ENSO residual.
The ENSO “residuals” are a significant contributor to the rise in Global Sea Surface Temperatures during the satellite era, as will be shown later in this post. Did Foster and Rahmstorf (2011) consider these residuals in their analysis? No.
A more recent paper was overlooked by Foster and Rahmstorf (2011). Compo and Sardeshmukh (2010) “Removing ENSO-Related Variations from the Climate Record” seems to be a step in the right direction. They write (my boldface):
An important question in assessing twentieth-century climate is to what extent have ENSO-related variations contributed to the observed trends. Isolating such contributions is challenging for several reasons, including ambiguities arising from how ENSO is defined. In particular, defining ENSO in terms of a single index and ENSO-related variations in terms of regressions on that index, as done in many previous studies, can lead to wrong conclusions. This paper argues that ENSO is best viewed not as a number but as an evolving dynamical process for this purpose.
Note: While Compo and Sardeshmukh made a step in the right direction, they missed a very important aspect of ENSO. They overlooked the significance of the huge volume of warm water that is left over from certain El Niño events, and they failed to account for its contribution to the rise in global Sea Surface Temperature anomalies since about 1975/76.
ENSO IS A PROCESS NOT AN INDEX
I have discussed, illustrated, and animated the process of ENSO and its effects on global surface temperatures and lower troposphere temperatures for about three years. There are too many posts to list them all here. However, if the subject of ENSO is new to you, refer to the introduction post here. If you would prefer an introductory-level discussion about ENSO written by someone else, refer to the excellent answers to FAQ here by Bill Kessler of the NOAA Pacific Marine Environmental Laboratory. For those who believe La Niña events are the opposite of El Niño events refer to the posts here, here and here. And for those who believe ENSO is represented by an index, refer to the post here. I will provide a relatively detailed overview of the process of ENSO in the following.
ENSO is a coupled ocean-atmosphere process that periodically discharges heat to the atmosphere during an El Niño. The phrase “coupled ocean-atmosphere process” refers to the fact that many ocean and atmospheric variables in the tropical Pacific interact with one another. For that reason, a number of tropical Pacific variables are impacted directly by ENSO, including sea surface temperature, sea level, ocean currents, ocean heat content, depth-averaged temperature, warm water volume, sea level pressure, cloud amount, precipitation, the strength and direction of the trade winds, etc. I have presented the effects of ENSO on each of those variables in past posts. And since cloud amount for the tropical Pacific impacts downward shortwave radiation (visible light) there, I’ve presented and discussed that relationship as well. In fact, the videos included in the post here presented ISCCP Total Cloud Amount data (with cautions about that dataset), CAMS-OPI precipitation data, NOAA’s Trade Wind Index (5S-5N, 135W-180) anomaly data, RSS MSU TLT anomaly data, CLS (AVISO) Sea Level anomaly data, NCEP/DOE Reanalysis-2 Surface Downward Shortwave Radiation Flux (dswrfsfc) anomaly data, and Reynolds OI.v2 SST anomaly data.
During an El Niño, warm water from the west Pacific Warm Pool can travel thousands of miles eastward across the equatorial Pacific. Keep in mind that the equatorial Pacific stretches almost halfway around the globe. So as the convection, cloud cover, and precipitation all accompany that warm water, their relocation causes changes in atmospheric circulation patterns worldwide. In turn, this causes temperatures outside of the eastern tropical Pacific to vary, some warming, some cooling, but in total, the areas that warm exceed those that cool and global surface temperatures rise in response to an El Niño. The spatial patterns of warming and cooling during a La Niña are similar to an El Niño, but of the opposite sign. And all that a paper such as Foster and Rahmstorf (2011) can only hope to account for are the changes in global temperature that respond linearly to the changes in the ENSO index used in the analysis. As confirmation, a paper cited by Foster and Rahmstorf (2011) acknowledged that there are ENSO-related factors that impact global temperatures that are overlooked by linear regression analysis. See Trenberth et al (2002) linked above.
Because global spatial patterns for El Niño and La Niña events are similar but opposite, many persons believe that all of the effects of El Niño and La Niña events oppose one another. This is far from reality. A La Niña event is basically an exaggeration of the “normal” (or ENSO-neutral) state of the tropical Pacific, while an El Niño event is an anomalous state.
An El Niño can carry huge volumes of warm water from the surface and below the surface of the west Pacific Warm Pool eastward to the central and eastern equatorial Pacific. That warm water is not consumed fully by the El Niño, so it returns to the west during the La Niña. One of the ways the La Niña accomplishes this return of warm water is through a phenomenon called a slow-moving Rossby wave, which forms in the northeast tropical Pacific at about 5N-10N. After the 1997/98 El Niño, the Rossby wave is plainly visible in ocean heat content anomaly animations, and better still in sea level residual animations from the Jet Propulsion Laboratory.
I’ve highlighted the Rossby wave in screen captures from the JPL video in Figure 1. The upper right-hand cell shows the formation of the Rossby wave and the lower left-hand cell captures the Rossby wave travelling from east to west at approximately 5N-10N, carrying leftover warm water back to the western Pacific during the transition from the 1997/98 El Niño to the multiyear La Niña that followed.

Figure 1
The Rossby wave can be seen in the first 10 to 15 seconds of Video 1. And as you will note, if you allow the video to play through, there are no comparably sized Rossby waves carrying cool waters back to the western tropical Pacific at 5N-10N after the La Niña.
Video 1
And to further confirm this basic difference between El Niño and La Niña events, there are also no comparably-sized Rossby waves carrying cool waters back to the western tropical Pacific at 5N-10N after any La Niña event seen in the full version of the JPL animation, Video 2, which runs from 1992 to 2002.
Video 2
There are no ENSO indices presently in use that can account for the return of the warm water to the West Pacific during a La Niña event that follows an El Niño.
As I’ve noted in numerous posts, ENSO is also a process that redistributes the warm water that was leftover from the El Niño itself and enhances the redistribution of the warm water that resulted from the El Niño in waters outside of the eastern tropical Pacific. The redistribution carries that warm water poleward and into adjoining ocean basins during the La Niña that follows an El Niño. The impacts of this redistribution depend on the strength of the El Niño and the amount of water that was “left over”. Lesser El Niño events that are not followed by La Niña events obviously would not have the same impacts. There are no ENSO indices that can account for this redistribution and these differences.
La Niña events also recharge part of the warm water that was released during the El Niño. They accomplish this through an increase in downward shortwave radiation (visible light), and that results from the reduction in tropical Pacific cloud amount caused by the stronger trade winds of a La Niña. Sometimes La Niña events “overcharge” the tropical Pacific, inasmuch as they recharge more ocean heat in the tropical Pacific than was discharged during the El Niño that came before it. That was the case during the 1973/74/75/76 La Niña. Refer to Figure 2. Tropical Pacific Ocean Heat Content rose significantly during the 1973/94/75/76 La Niña, and that provided the initial “fuel” for the 1982/83 Super El Niño and the multi-year 1986/87/88 El Niño. The La Niña events that followed those El Niño only recharged a portion of the heat discharged by them. Tropical Pacific Ocean Heat Content declined until 1995. Then the 1995/96 La Niña event “overcharged” the Tropical Pacific Ocean Heat Content again and that provided the fuel for the 1997/98 “El Niño of the Century”.
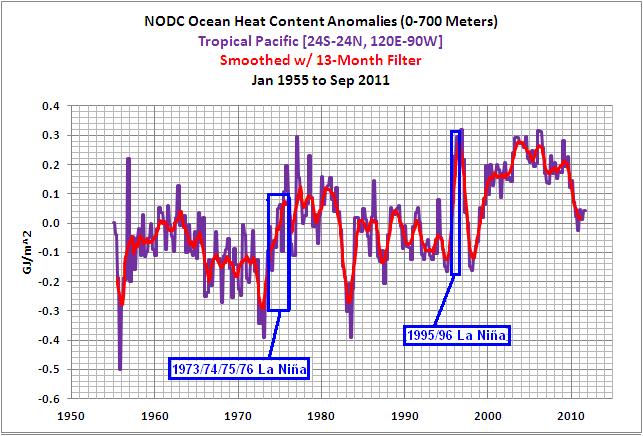
Figure 2
Refer also to the introductory level discussion in the post ENSO Indices Do Not Represent The Process Of ENSO Or Its Impact On Global Temperature.
THE TREND OF THE EAST PACIFIC SEA SURFACE TEMPERATURE ANOMALIES HAS BEEN RELATIVELY FLAT FOR 30 YEARS
The East Pacific Sea Surface Temperature anomalies from pole to pole, Figure 3, are dominated by the variations in tropical Pacific caused by ENSO, and as a result, the variations in the East Pacific Sea Surface Temperature anomalies mimic ENSO, represented by the scaled NINO3.4 Sea Surface Temperature anomalies. The trend of the East Pacific Sea Surface Temperature anomalies is relatively flat at 0.011 deg C/Decade.
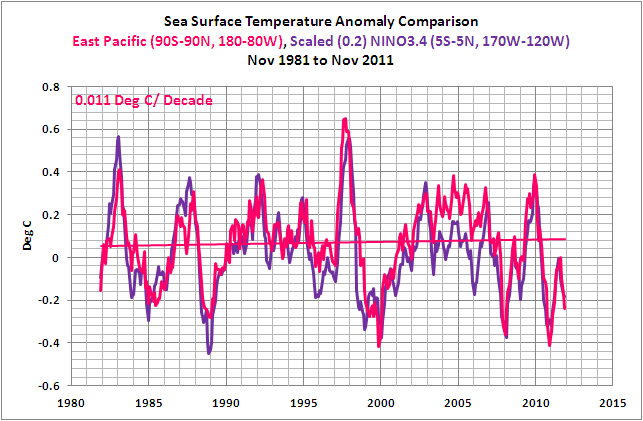
Figure 3
The reason the trend is so flat: warm water from the surface and below the surface of the west Pacific Warm Pool is carried eastward during an El Niño and spread across the surface of the eastern tropical Pacific, raising sea surface temperatures there. And during the La Niña events that follow El Niño events, the leftover warm water is returned to the western tropical Pacific. Due to the increased strength of the trade winds during the La Nina, there is an increase in upwelling of cool subsurface waters in the eastern equatorial Pacific, so the Sea Surface Temperatures there drop. In other words, the East Pacific is simply a temporary staging area for the warm water of an El Niño event. Warm water sloshes into this dataset from the western tropical Pacific and releases heat, and then the warm water sloshes back out.
WHAT EFFECT DOES THE WARM WATER HAVE WHEN IT RETURNS TO THE WESTERN TROPICAL PACIFIC DURING THE SUBSEQUENT LA NIÑA EVENT?
The warm waters released from below the surface of the West Pacific Warm Pool during a major El Niño are not done impacting Sea Surface Temperatures throughout the global oceans when that El Niño has ended, and they cannot be accounted for by an ENSO index. Keep in mind, during an El Niño like the 1997/98 event, a huge volume of water from below the surface of the west Pacific Warm Pool was spread across the surface of the eastern tropical Pacific. Consequently, warm water that had once been excluded from the surface temperature record, because it was below the surface, is now included in the surface temperature record. At the end of the El Niño, the trade winds push the warm water that’s now on the surface back to the western Pacific where it remains in the surface temperature record. The Sea Surface Temperature in the western Pacific rises as a result. Add to that the effects of the Rossby wave. As illustrated earlier, at approximately 5N-10N latitude, a slow-moving Rossby wave also carries leftover warm water from the eastern tropical Pacific back to the western Pacific during the La Niña. Ocean currents carry all of the leftover the warm water poleward to the Kuroshio-Oyashio Extension (KOE) east of Japan and to the South Pacific Convergence Zone (SPCZ) east of Australia, and the Indonesian Throughflow (an ocean current) carries the warm water into the tropical Indian Ocean. And as noted above, due to the increased strength of the trade winds during the La Nina, there is an increase in upwelling of cool subsurface waters in the eastern equatorial Pacific, so the Sea Surface Temperatures there drop. But that cooler-than-normal water is quickly warmed during the La Niña as it is carried west by the stronger-than-normal ocean currents that are caused by the stronger-than-normal trade winds. And the reason that water warms so quickly as it is carried west is because the stronger-than-normal trade winds reduce cloud cover, and this allows more downward shortwave radiation (visible sunlight) to warm the ocean to depths of 100 meters. This additional warm water helps to maintain the Sea Surface Temperatures in the West Pacific and East Indian Oceans at elevated levels during the La Niña and it also recharges the West Pacific Warm Pool for the next El Niño event. Refer again to Figure 2. (Keep in mind that the graph in Figure 2 is for the Ocean Heat Content for the entire tropical Pacific, not just the Pacific Warm Pool.)
And what happens when a major El Niño event is followed by a La Niña event? The Sea Surface Temperature anomalies for the Atlantic, Indian, and West Pacific Oceans (the Rest-Of-The-World outside of the East Pacific) first rise in response to the major El Niño; the 1986/87/88 and 1997/98 El Niño events for example. Then the Rest-Of-The-World Sea Surface Temperatures are maintained at elevated levels by the La Niña; the 1988/89 and 1998/99/00/01 La Niña events to complete the example. The results are the apparent upward shifts in the Sea Surface Temperature anomalies of the Atlantic, Indian, and West Pacific Oceans from pole to pole (90S-90N, 80W-180), as illustrated in Figure 14. Some have described it as a ratcheting effect, where the redistribution of warm waters during the major El Niño and La Niña events drive the surface temperatures up a notch.
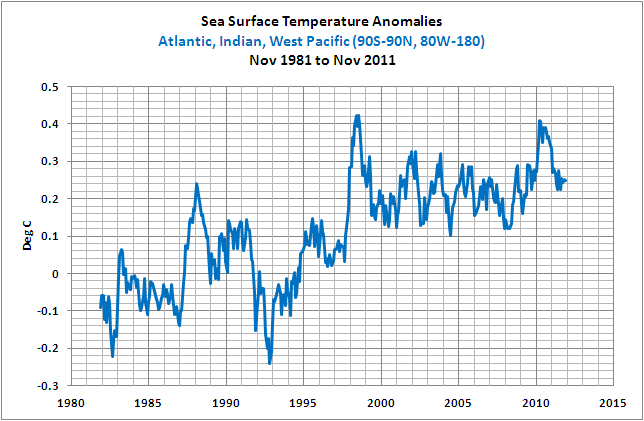
Figure 4
In Figure 4, the dip and rebound starting in 1991 is caused by the volcanic aerosols emitted by the explosive volcanic eruption of Mount Pinatubo. And the reason the Rest-Of-The-World Sea Surface Temperature anomalies respond so little to the 1982/83 Super El Niño is because that El Niño was counteracted by the eruption of El Chichon in 1982.
To assure readers that the upward shifts in Rest-Of-The-World Sea Surface Temperature anomalies coincide with the 1986/87/88 and 1997/98 El Niño events, I’ve included an ENSO index, NINO3.4 Sea Surface Temperature anomalies, in Figure 5. The NINO3.4 Sea Surface Temperature anomalies have been scaled (multiplied by a factor of 0.12) to allow for a better visual comparison, and shifted back in time by 6 months to account for the time lag between the variations in NINO3.4 Sea Surface Temperature anomalies and the response of the Rest-Of-The-World data.

Figure 5
But the ENSO Index data is visually noisy and it detracts from the upward shifts, so I’ve removed it in Figure 6. But in it, I’ve isolated the data between the significant El Niño events. To accomplish this, I used the NOAA Oceanic Nino Index (ONI) to determine the official months of those El Niño events. There is a 6-month lag between NINO3.4 SST anomalies and the response of the Rest-Of-The-World SST anomalies during the evolution phase of the 1997/98 El Niño. So the ONI data was lagged by six months, and the Rest-Of-The-World SST data that corresponded to the 1982/83, 1986/87/88, 1998/98, and 2009/10 El Niño events was excluded and left as black dashed lines. All other months of data remain and are represented by the blue curves.

Figure 6
And to help further highlight the upward shifts, the average Sea Surface Temperature anomalies between the major El Niño events are added in Figure 7.
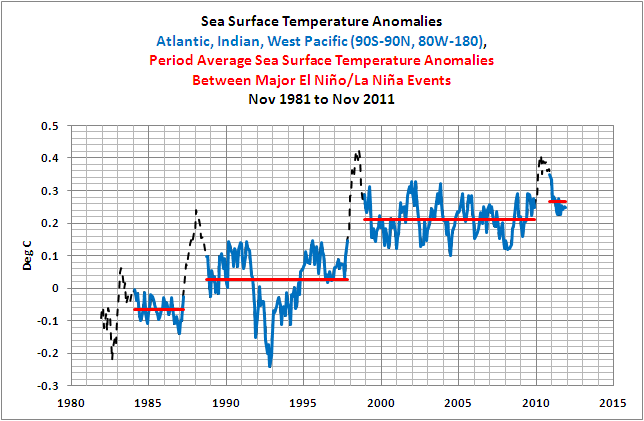
Figure 7
Based on past posts where I’ve presented the data the same way, some readers have suggested the period average temperatures are misleading and have requested that I illustrate the linear trends. Figure 8 shows how flat the trends are between the 1986/87/88 and 1997/98 El Niño events and between the 1997/98 and 2009/10 El Niño events.

Figure 8
Back to the East Pacific data: If we adjust the East Pacific Sea Surface Temperature anomalies for the effects of volcanic aerosols, Figure 9, the linear trend is slightly negative. In other words, for approximately 33% of the surface area of the global oceans, Sea Surface Temperature anomalies have not risen in 30 years.
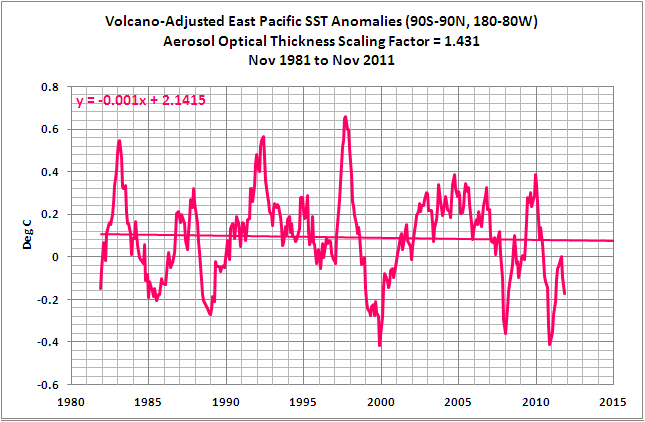
Figure 9
Note: The method used to adjust for the volcanic eruptions is described in the post Sea Surface Temperature Anomalies – East Pacific Versus The Rest Of The World, under the heading of ACCOUNTING FOR THE IMPACTS OF VOLCANIC ERUPTIONS.
And if we adjust the Rest-Of-The-World Sea Surface Temperature anomalies for volcanic aerosols, Figure 10, we reduce the effects of the dip and rebound caused by the 1991 eruption of Mount Pinatubo. And the trend of the Rest-Of-The-World data between the 1986/87/88 and 1997/98 El Niño drops slightly compared to the unadjusted data (Figure 8), making it even flatter and slightly negative.

Figure 10
Note: In the second part of a two part series (here), I further subdivided the Rest-of-the-World (90S-90N, 80W-180) sea surface temperature data to isolate the North Atlantic, due to its additional mode of natural variability. The sea surface temperatures for the remaining South Atlantic-Indian-West Pacific data decay between the major El Niño events. In other words, the sea surface temperatures there drop; the linear trends are negative, just as one would expect.
In summary, ENSO is a coupled ocean-atmosphere process and its effects on Global Surface Temperatures cannot be accounted for with linear regression of an ENSO index as attempted by Foster and Rahmstorf (2011)–and others before them. We can simply add Foster and Rahmstorf (2011) to the list of numerous papers that make the same error. Examples:
Lean and Rind (2009) How Will Earth’s Surface Temperature Change in Future Decades?
And:
Lean and Rind (2008) How Natural and Anthropogenic Influences Alter Global and Regional Surface Temperatures: 1889 to 2006
And:
Santer et al (2001), Accounting for the effects of volcanoes and ENSO in comparisons of modeled and observed temperature trends
And:
Thompson et al (2008), Identifying signatures of natural climate variability in time series of global-mean surface temperature: Methodology and Insights
And:
Trenberth et al (2002) Evolution of El Nino–Southern Oscillation and global atmospheric surface temperatures
And:
Wigley, T. M. L. (2000), ENSO, volcanoes, and record-breaking temperatures
IS THERE A LINEAR “GLOBAL WARMING SIGNAL”?
Foster and Rahmstorf (2011) assumed that the global warming signal is linear and that it is caused by anthropogenic factors, but those assumptions are not supported by the satellite-era Sea Surface Temperature record as shown above. The El Niño events of 1986/87/88 and 1997/98 are shown to be the cause of the rise in sea surface temperatures since November 1981, not anthropogenic greenhouse gases.
CLOSING COMMENTS
This post illustrated and discussed the error in the assumption that regression analysis can be used to remove the impacts of ENSO on Global Surface Temperature. ENSO is a process that is not fully represented by ENSO Indices. In other words, the ENSO indices only represent a small portion of the impacts of ENSO on Global Surface Temperatures. Attempting to use an ENSO index as Foster and Rahmstorf (2011) have done is like trying to provide the play-by-play for a baseball game solely from an overhead view of home plate.
The assumption made by Foster and Rahmstorf (2011) that a linear trend provides an approximate “global warming” signal was shown to be wrong using Sea Surface Temperature data. When broken down into two logical subsets of the East Pacific and the Atlantic-Indian-West Pacific Oceans, satellite-era Sea Surface Temperature data shows no evidence of an anthropogenic global warming signal. It only shows upward shifts associated with strong ENSO events.
If Foster and Rahmstorf (2011) were to exclude ENSO from their analysis, it is likely their results would be significantly different.
A closing note: I have also been illustrating, discussing, and documenting the ENSO-related processes behind these upward shifts for three years, using the East Indian-West Pacific subset (60S-65N, 80E-180). I first posted about it on January 10, 2008 in a two-part series here and here. The WattsUpWithThat cross posts are here and here.
ABOUT: Bob Tisdale – Climate Observations
SOURCES
The NODC OHC data is available through the KNMI Climate Explorer, on their Monthly observationswebpage.
The Reynolds OI.v2 Sea Surface Temperature data used in the ENSO discussion is available through the NOAA NOMADS website here.
The Aerosol Optical Thickness data used in the volcano adjustments of the Sea Surface Temperature data in Figures 9 and 10 is available from the GISS Stratospheric Aerosol Optical Thickness webpage here.
Bob Tisdale says: “KR: Thanks for linking Santer et al (2011). That’s a very odd paper to link in a discussion of the effects of ENSO on sea surface temperature as I’ve presented in this post.”
Then you do not seem to understand why I mentioned it – Santer 2011 points out that 3, 9, and 11 year time data (as you have used in your “step-change” arguments, Fig. 7) are too short a time period for statistical significance. It’s easy to “eye-ball” apparent trend lines in noisy data, but unless you test for whether it’s significant in the presence of said noise, you may easily be led astray.
Why did I mention the MEI? Because (a) that’s what F&R 2011 used as an ENSO index, and correlated it against global temperatures, and (b) whether there are non-linear effects or not (and as I pointed out, there certainly are), the MEI certainly indicates relative El Nino/La Nina strengths and timing. It would probably be worth running the regression with NINO3.4 SST anomalies in place of MEI or the SOI (which F&R 2011 experimented with – no significant difference), but unless you have done so there’s little to back up such an assertion. I will note, however, that NINO3.4 only covers 5°N-5°S, 120-170°W – a rather limited area.
Related: There is a considerable, pervasive disconnect in your article, and in your above reply. Namely, you are discussing regional SST temperatures, regional basin OHC, vs. ENSO indexes, when Foster and Rahmstorf 2011 concerns regression of ENSO, volcanic aerosols, TSI, and a linear trend against global temperatures. The effects of the ENSO on temperatures is well understood to be global in nature, whereas regional measures involve the possibility (likelyhood, even) of effects extending out the borders of the regions, and hence not been accounted for. You should at least be discussing the same topic.
As to the Tamino/SkS links – you are still arguing for multiple step changes (again, Fig. 7). Both of those links demonstrate why the data simply doesn’t support such a claim. But apparently you have not read them.
Using regional data to argue against a paper that examined global data, and invoking step changes that are not supportable by the data – oh well. I’ll look to see if you publish anything, with confidence intervals and evaluations of statistical significance, as have F&R, and Lean and Rind. Until then, you are (IMO) just waving your hands…
Kevin O’Neill and R. Gates and HAS: Sorry. My error. The sentence you quoted from the post wasn’t clear. I’ll add to it.
If Foster and Rahmstorf (2011) were to exclude ENSO from their analysis, it is likely their results would be significantly different, inasmuch as the adjusted data would still retain the ENSO variations, and, for example, while 2010 might become the new record year for the RSS TLT data after the adjustments, 1998 would still be a close second, not 2009.
That’s really the point I was trying to make.
Bob,
Thanks for another illuminating post. As a sailor (with too little time to sail) and skeptic, I’ve been fascinated by the research you and Willis have done on the effects of tropical weather and currents on each other and global climate.
But one point about the PDO:
There seem to be two positions (among sane researchers) on the subject —
a) The PDO oscillation determines the dominance of El Niño / La Niña events and constitutes a poorly-understood phenomenon that we need to investigate and explain; or
b) The PDO oscillation is a cumulative multiyear lag effect of the dominance of El Niño / La Niña events and constitutes a poorly-understood phenomenon that we need to investigate and explain.
I’ve read papers from both points of view, and my takeaway is: The PDO question is why we have this 60-year periodicity in ENSO. Once that’s answered, we’ll have a start on the answer to whether ENSO is a cause or an effect in the (probably long and complex) causal chain resulting in the PDO. But of course such dogged research as yours is a prerequisite to finding an answer to this question.
Thanks again.
Admitting your mistakes and correcting them, learning from them and proceeding to redo the analysis. Respect is what that gets you in my world! We can only hope you start a trend in climate science 🙂
R. Gates:
R. Gates says:
January 15, 2012 at 1:09 pm
Pamela Gray says:
January 15, 2012 at 12:30 pm
Gates, if u contend that heat loss has been hampered by CO2, what other metric can u link to that would demonstrate this? For example, I would look at OLR data to see if there is a mechanistic match.
_____
I make no such contention. My point was about the overall effect of El Ninos not releasing as much heat as La Ninas (and ENSO neutral periods) have been storing over the period of time that the Foster & Rahmstorf paper covered (1979-2010). leading to a net gain in ocean heat content. As fort the cause of this, it certainly might be that additional forcing from the added CO2, CH4, and N2O, over preindustrial levels might be involved, but there could be other natural factors working in combination as well. If we had reliable OLR that covered the entire earth for the period in question, we might be able to see some match or correlation between incrasing OHC
and decreasing OLR, but to my knowledge, this data does not exist. Certainly if more energy is going into the heat sink of the ocean, you’d think less must be be going into space.
Mr. Gates:
You are making an assumption that incoming energy reaching the surface is constant…..am I correct?
Mr. Tisdale:
Thank you for your integrity, and the sharing of your knowledge and thoughts.
KR January 15, 2012 at 10:30 am believes in a “… statistical requirement for a minimum of 17 years of global data to establish a linear trend (Santer 2011…)” supposedly because of noise. This is abject nonsense. Leaving aside Tisdale’s interpretation of data, he is fully justified in assuming the reality of these step changes. Santer et al. simply don’t know what they are talking about. They have no actual observations of nature and they don’t understand temperature curves. They rely upon model-making and there is no reason to think that their models are any better than Hansen’s were in 1988 when he predicted dangerous global warming by 2019. There is a simple way to demonstrate that real temperature data with a resolution a lot better than a year is contained in virtually all existent temperature curves, and for satellites it is better than a couple of months. What makes this possible is the ENSO oscillation. These oscillations are real and can be lined up accurately in all existing temperature curves. What is more, they have existed since the Isthmus of Panama rose from the sea and are guaranteed to exist in the foreseeable future. Sometimes even a bimonthly resolution can be obtained, with El Nino peaks defined accurately within this limit. The HadCRUT3 temperature curve, figure 23 in my book, is an example. It covers dates from 1850 to 2008. And this leaves no room for imaginary noise that can hide real features 17 years long.
Mr. Gates:
Without the large step change in OHC when XBT was replaced by ARGO, the statistical change in OHC over the past 30 years would not be statistically relevant.
What literature are you using to state that there are fewer clouds during a La Nina than during an El Nino? I am talking worldwide here, as a regional variation, while important over centuries, would not appear to be that important over a short time span such as 30 years.
Arno Arrak says:
January 15, 2012 at 7:24 pm
I agree in total with your analysis of Santer 2011. It was another poorly supported paper by Mr. Santer. He really needs to crack to books a bit more before he publishes again.
Bob Tisdale says:
January 15, 2012 at 6:12 pm
And you provided no evidence of a PDO led La Nina? You continue to misunderstand the PDO.
2011 is all the evidence you need, but let us look deeper:
1. The PDO index in 2011 led the ENSO 3.4 index. This should not happen if the PDO is an after effect of ENSO.
http://stateoftheocean.osmc.noaa.gov/atm/images/pdo_short.gif
http://stateoftheocean.osmc.noaa.gov/sur/images/nino34_short.gif
2.Prevailing winds were directing warm water towards the area above New Guinea prior to the building of the La Nina warm pool over New Guinea.
http://tinyurl.com/2dg9u22/images/bom_pred1.png
3. Anyone watching the daily building of the warm pool at http://weather.unisys.com/surface/sst_anom.gif would have seen the build up of the La Nina warm pool (over New Guinea). I will be building an animation soon.
And you have not answered my previous questions which also address the logic of your single only type of requirement necessary for La Nina.
“You are selling to the world that the PDO can have no effect on ENSO. I disagree with you and 2011 is just one example of your limited understanding on the topic. You still haven’t answered how we achieved the back to back La Nina or why the very strong La Nina of 2010 did not “charge” an El Nino event the following year.”
As Craig says above, this area of science is far from settled. We have not had a neg PDO since the 70’s, so little recent research is possible. A neg PDO will simply give more options for La Nina type events as well as giving boost to La Nina events with the extra supply of warm water.
markus says:
It is far worse then we thought. The ingrained rhetoric has entered our learning institutions, Their is no question of the theory’s legitimacy, effects or the realistic observations that hold up against the theory. What will become children’s relationship with authority when they discover there was no warming as hypothesized?
The children are fine. No child believes a teacher implicitly anymore. OK, I suppose my Maths class might believe me when I teach them Pythagoras or Algebra but only because they can’t really argue the toss. They would if they could, believe me.
The danger is at university, where people are fall into the trap of assuming that now they are getting the real stuff.
Most kids come out of school without believing they are world experts because they qualified from High School. A significant number of university graduates like to think that they are not only experts on some small topic, but are experts on everything. Which is why too many climate scientists think they should be listened to about public policy, let alone climate.
I think I’ve understood you Bob! A decade of El Ninos = 0.2 C global warming. The Earth is about 288 K on average so the Earth can’t possbily be older than (288/0.2) * 10 = 14,440 years.
Your work doesn’t just debunk the junk science peddled by climate alarmists, but also demolishes the work of those God-haters that say the Earth is billions of years old. Great job!
KR says: “Then you do not seem to understand why I mentioned it – Santer 2011 points out that 3, 9, and 11 year time data (as you have used in your “step-change” arguments, Fig. 7) are too short a time period for statistical significance.”
I understood why you mentioned it, and I also understand and presented to you that the CMIP3 models used in the Santer et al (2011) have no basis in reality, which is why I linked the earlier posts. Additionally, in the real world, the largest cause of year-to-year variability is ENSO. Santer et al (2011) never addressed the greatest cause of year-to-year variability in the models. Is it ENSO in the models? It can’t be for some, because some of the models do not attempt to simulate ENSO. Modelers rely on the ensemble mean due to the noise inherent in the models, noise that does not exist in the real world. My point is that the noise generated by the models, and used in the Santer et al (2011) signal to noise analysis, is noise that does not exist in the real world and any analysis of it has no bearing on the analysis of real world data.
You said, “Why did I mention the MEI? Because (a) that’s what F&R 2011 used as an ENSO index, and correlated it against global temperatures…”
Seems as though you’ve changed tacks, KR.
First, the link you provided in your earlier comment was to the short-term version of the MEI, not the long-term version “135 year ENSO record” you referred to. They are different, primarily in the number of variables used in the production of the data. The long-term version is discussed here:
http://www.esrl.noaa.gov/psd/enso/mei.ext/
F&R cited Wolter and Timlin 1993, 1998, but the long-term version that you mentioned was not introduced until 2011. Also, F&R could not have used the extended MEI because it ends in 2005.
Second, when you linked it, you wrote: “Why has this not happened before? (http://www.esrl.noaa.gov/psd/enso/mei/ – 135 year ENSO record)” So your new reasoning for linking it sounds like an attempt to redirect the discussion. My earlier questions to you still stand unanswered. How would it [the extended MEI] show whether these upward shifts have or haven’t happened in the past? Do you know for a fact that ENSO was or wasn’t responsible for the rise in SST anomalies from the early 1910s to the early 1940S?
You continued, “It would probably be worth running the regression with NINO3.4 SST anomalies in place of MEI or the SOI (which F&R 2011 experimented with – no significant difference), but unless you have done so there’s little to back up such an assertion. I will note, however, that NINO3.4 only covers 5°N-5°S, 120-170°W – a rather limited area.”
I never made an assertion, but it was a valient attempt on your part to spin what I had written. I simply said that I prefer the HADISST as a long-term ENSO index over the long-term MEI, and I did that because you had referred to the extended MEI “135 year ENSO record” (which was not used in F&R.) You introduced it to the discussion out of the blue. NINO3.4 SST anomalies are also available through the current month, while the extended MEI ends in 2005, another reason for my preference.
Your last sentence about the limited area of the NINO3.4 region is odd. Granted the MEI uses a number of different variables from across tropical Pacific including NINO3 SST anomalies, but the MEI, like NINO3.4 SST anomalies, is simply an index to mark the frequency, magnitude, and duration of ENSO events. Both fail to capture the process. The MEI was created during a time when researchers were looking for an index they could use in linear regression and correlation analyses to determine the linear effects of ENSO on global surface temperatures, precipitation, etc., and to use in the analysis of the portrayal of ENSO in climate models. NOAA selected NINO3.4 SST anomalies for its primary ENSO index, and they place a disclaimer on the MEI webpage (“The views expressed are those of the author and do not necessarily represent those of NOAA”). So your noting that the NINO3.4 region is “a rather limited area” is rather pointless. Regardless, the minor differences in the frequency, magnitude, and duration of ENSO events in the MEI and NINO3.4 data would have little impact on a paper like F&R. The point of my post was, ENSO indices do not capture the process of ENSO.
You wrote, “Related: There is a considerable, pervasive disconnect in your article, and in your above reply. Namely, you are discussing regional SST temperatures, regional basin OHC, vs. ENSO indexes, when Foster and Rahmstorf 2011 concerns regression of ENSO, volcanic aerosols, TSI, and a linear trend against global temperatures.”
I’m not sure how anyone could write that there is a “considerable, pervasive disconnect in your article, and in your above reply.” It could be that you simply fail to grasp the obvious. I divided the sea surface temperature anomalies of global oceans into two subsets to show very simply that their responses to ENSO are significantly different, which reinforced the disclaimer by Trenberth et al (2002) that I quoted toward the beginning of my post. More obviously, I divided the SST data into those two subsets to illustrate how the regression of an ENSO index against global temperatures would fail to capture that difference. I included the tropical Pacific OHC data in the post to help illustrate the discharge, recharge and “overcharge” modes of ENSO. The latter discussion of OHC in my reply to you was in response to your comment.
You wrote, “As to the Tamino/SkS links – you are still arguing for multiple step changes (again, Fig. 7). Both of those links demonstrate why the data simply doesn’t support such a claim. But apparently you have not read them.”
Of course I read them. If I had not read them, I would not have been able to present to you the long list of aspects I have discussed, illustrated and animated in my post and in the posts attached to it.
You wrote, “Using regional data to argue against a paper that examined global data, and invoking step changes that are not supportable by the data – oh well.”
Thanks, your statement made me laugh aloud. This post did not invoke step changes. It discussed the process of ENSO that caused those upward steps, a distinction that still eludes you for some reason.
I believe if we continue this discussion we’ll simply go around in circles.
Regards
Geoff Sharp: Regarding your January 15, 2012 at 7:50 pm reply, again, this post does not include a discussion of the 2011/12 La Niña. Why do you insist on discussing it? Since it interests you so, why don’t you write a post about it at your blog and then ask Anthony to cross post it here at WUWT.
I’d like to make a couple of suggestions before you do that. Use the correct names for variables and locations. The “prevailing winds” are called the trade winds in these discussions. The “La Nina warm pool over New Guinea” is commonly referred to as the west Pacific Warm Pool, and while there are a few variations of the name, I do not believe I’ve ever seen it referred to as the “La Nina warm pool over New Guinea”. The interrelationship between the trade winds and the Pacific Warm Pool is discussed in the NOAA FAQ webpage. It’s nice and simple and easy to read:
http://faculty.washington.edu/kessler/occasionally-asked-questions.html
Much of what you discussed in the rest of your comment are commonly know aspects of ENSO, which you will discover in the link.
You wrote, “You are selling to the world that the PDO can have no effect on ENSO. I disagree with you and 2011 is just one example of your limited understanding on the topic. You still haven’t answered how we achieved the back to back La Nina or why the very strong La Nina of 2010 did not “charge” an El Nino event the following year.”
It’s nice that you disagree with me, Geoff, but your understanding of the PDO is so flawed that your disagreement really does not surprise me. Regarding my “limited understanding on the topic” as you write, I have documented what the PDO is and what it isn’t in a series of posts, many of them cross posted here at WUWT. The data I have used to discuss what the PDO represents and what it does not represent is available to the public and it confirms my understandings. Your understanding of the PDO contradicts the data. My understandings of ENSO are also confirmed by data and a multitude of papers. The fact that this event is acting a little differently does not indicate that my basic understandings are flawed; it simply indicates that this one is different. But your insistence that this double-dip La Niña is caused by some magical switch in the PDO continues to broadcast your limited grasps of ENSO and the PDO.
And with respect to my selling the world something, I have never written that the sea surface temperatures of the North Pacific did not impact ENSO. The North Pacific Gyre dictates that it does. My argument with you is based on your misunderstandings of the PDO and what it represents. The PDO does not represent Sea Surface Temperatures of the North Pacific, north of 20N. The PDO represents the spatial patterns of those sea surface temperatures, which are a byproduct of ENSO and North Pacific Sea Level Pressure, and the SLP component is why the PDO can appear to lead NINO3.4 SST anomalies at times. It would all be so simple for you once you stop insisting that the PDO is something that it is not.
I answered your question, but you have responded to my request. It was: Please point me to the exact thread and comment in which you wrote something to the effect of, “how a PDO warm pool could trigger a La Nina event and in fact must do to induce back to back La Nina.”
The fact that you have not responded to it indicates that your earlier comment was also a fabrication on your part, Geoff.
Please write a post about the 2011/12 double dip La Niña. We can then discuss this further.
To end my replies to you on this thread, while you may not have hijacked the thread, I am still replying to your continued comments, so your insistence on discussing this has hijacked my time.
Geoff
Thank you for reminding me of the importance of the PDO, or rather the NPI. I was struggling with this for a few days: http://virakkraft.com/ENSO-OHC-Tropics.png. Nino3.4 and tropical OHC correlating (and anti-correlating in the other hemisphere), fine. Step change 2002/3 probably false and due to ARGO, fine, but what the h… happened around 1977?
Replacing Nino3.4 with PDO (PDO~-NPI) http://virakkraft.com/PDO-tropical-OHC.png and the puzzle was complete.
The NPI added lots of heat to eastern pacific around 1977, leading to imbalance between ocean and air temperature. The excess heat was released during the following strong ENSO events, my version of Bobs stairs using Nino3.4 and tropical: http://virakkraft.com/trop-temp-nino.png By 1998 balance was restored and the tropics has not warmed last 15 years.
http://virakkraft.com/excess-heat-tropics.png
lgl says:
January 16, 2012 at 8:51 am
Geoff
Thank you for reminding me of the importance of the PDO
The north western Pacific warm pool is the important factor of the PDO, and we are finally seeing Bob give ground on this. He may think nobody understands the PDO but perhaps some of us understand the process at lot more than him. It is not rocket science, the Walker Circulation pump needs low pressure and warm water above New Guinea to trigger a La Nina. If there is a large body of water above this region that has the capability of injecting heat, then we have one driver of La NIna and also another mechanism to reduce the power of El Nino. The PDO that controls this heat reservoir in the right region when in neg phase is a fundamental part of Earths climate system and it should be recognized and not pushed to the background.
I am currently preparing a paper with a well known author that may shed some insight into what controls the spatial patterns in the north Pacific, the 60 year PDO cycle is a fascinating subject and is actually the topic that started my interest in climate and solar research 4 years ago. I am glad to have helped out.
Geoff Sharp says: “The north western Pacific warm pool is the important factor of the PDO, and we are finally seeing Bob give ground on this. He may think nobody understands the PDO but perhaps some of us understand the process at lot more than him.”
Thanks, Geoff. Your comment made me laugh. “Give ground?” That’s funny. You wrote that as though your self-serving comments have influenced my research. That’s very funny. If you had any basic understanding of the topics you discussed, your comment would be sad. But your underhanded goal in all this is very obvious. We’ll put that aside till later.
Your failure to use commonly used names for locations and components is indicative of at least two things. One is sloppy research on your part. It indicates you haven’t taken the initiative to do basic research into the topics you’re attempting to discuss. The other is you’re being intentionally vague to allow yourself an escape route when others point out the failings in your writings.
Your phrase “north western Pacific warm pool” is a prime example. The first two questions that would pop into anyone’s mind are, What “north western Pacific warm pool”? and Where is this “north western Pacific warm pool” located? So they would Google it. I Googled “north western Pacific warm pool” in quotes. And Google replied, “No results found for ‘north western Pacific warm pool’”. And having tried Googling it, someone trying to understand your comment would still be unsure where you’re talking about. Can the rest of us assume the “north western Pacific warm pool” is the area east of Japan that shows up warm in a map of the “cool phase” of the PDO, the right-hand cell in the following link?
http://jisao.washington.edu/pdo/pdo_warm_cool3.jpg
Had you done your basic research, Geoff, you would have discovered the area you call “north western Pacific warm pool” is known as the Kuroshio Extension or the Kuroshio-Oyashio Extension, simplified as the KOE. Imagine that, Geoff! People before you found the area so important they even gave it a name, and since it’s discussed so often they use an acronym. The Kuroshio-Oyashio Extension is actually a current. It’s the name of the western boundary current extension in the North Pacific. It’s the coupling of two current extensions, actually, but don’t let reality get in the way of your failures to do basic research. The KOE is even discussed in the Wikipedia page on the Pacific Decadal Oscillation:
http://en.wikipedia.org/wiki/Pacific_decadal_oscillation
There, under the heading of Ocean Dynamics, Wikipedia writes, “Several dynamic oceanic mechanisms and SST-air feedback may contribute to the observed decadal variability in the North Pacific Ocean. SST variability is stronger in the Kuroshio Oyashio extension (KOE) region and is associated with changes in the KOE axis and strength…”
“SST variability is stronger in the Kuroshio Oyashio extension (KOE) region,” is the key phrase there for our discussion, Geoff. SST variability in the KOE is stronger than elsewhere in the North Pacific. The last sentence under that heading reads, “Remote reemergence occurs in regions of strong current such as the Kuroshio extension and the anomalies created near the Japan may reemerge the next winter in the central pacific.” Imagine that, Geoff, there’s a process called reemergence that allows SST anomalies formed in one season to reemerge the next winter.
Back to your comment, I had found the Kuroshio-Oyashio Extension and the process of reemergence so important that I wrote posts about them. So that part of your comment is correct. But I did not “give ground” to your comments, Geoff. Kuroshio-Oyashio Extension first appears in an April 29, 2008 post at my blog. Since then, the Kuroshio Extension or Kuroshio-Oyashio Extension has been discussed in 20 of my blog posts, including this post.
I found the KOE so important to the discussion of the rise in surface temperature and TLT that I wrote a December 8, 2010 post titled “The ENSO-Related Variations In Kuroshio-Oyashio Extension (KOE) SST Anomalies And Their Impact On Northern Hemisphere Temperatures”:
http://bobtisdale.wordpress.com/2010/12/08/the-enso-related-variations-in-kuroshio-oyashio-extension-koe-sst-anomalies-and-their-impact-on-northern-hemisphere-temperatures/
That post also ran here at WUWT:
http://wattsupwiththat.com/2010/12/12/tisdale-k-o-es-gisss-latest-warmest-year-nonsense/
I also discussed the process that causes the warming of the Kuroshio-Oyashio Extension in my post from September 2010. Read the paragraph under Figure 3:
http://bobtisdale.wordpress.com/2010/09/14/an-inverse-relationship-between-the-pdo-and-north-pacific-sst-anomaly-residuals/
I’ve also written posts about the re-emergence mechanism, Geoff. It was first mentioned in an April 29, 2009 post about the PDO. And here’s a link to my June 11, 2009 post with the title “The Reemergence Mechanism”:
http://bobtisdale.wordpress.com/2009/06/11/the-reemergence-mechanism/
If you’ll look at the dates of those posts, some in 2008 and 2009, you’ll see why I found your attempt to imply that your comments had forced me to “give ground” was laughable. There’s a very basic difference between you and me, Geoff. I document; you fabricate.
BTW: The rest of your recent comment is also filled with inaccuracies, so all you’ve done is broadcast your misunderstandings to those reading this thread.
The very obvious intent of your comments on this thread, Geoff, has been to cast doubt on my post. But, in reality, all you’ve done is force the loss of your own credibility with those who might have thought you had any left.
Have a nice day, Geoff.
Thanks, Anthony, especially for the introduction.
Bob,
I’ve been looking into one of the points you made in a previous thread regarding the lagged effects in F&R’s model. As I see it, their lagged effects have at least two issues:
1. Their data is monthly, so lags are in whole months. What if an effect takes 6-7 weeks? How does the averaging of monthly data smear or eliminate lagged effects that are less than monthly or are fractions of months long?
2. A lag assumes a one-time effect t months later. But what if it’s cumulative? Would, say, two months of extra-sunny days have a different effect t+1 months later than if there were only one month of extra-sunny days? I’ve found a package for doing Distributed Lag Linear Models (DLLM) and Distributed Lag Nonlinear Models (DLNM) in R and have been experimenting with it. Good news and bad news… Good news is I’ve been able to take F&R’s data without tau and create a reasonable model for GISS, numbers-wise, about as good as their straight linear model with tau. Bad news is that the resulting coefficients don’t seem to make sense physically.
Anyhow, I wanted to mention DLLM (also known as DLM, but I hate to use that abbreviation, since that’s also the abbreviation for Dynamic Linear Models, which are much more widely known), as it may help to deal with lags that are cumulative/distributed over time.
Of course, the data still includes MEI, which you argue against here. I wonder if distributed/cumulative models might make MEI more palatable, though. Any thoughts? Also, any thoughts on what kind of constraints would be physically reasonable on their variables MEI, SOLAR, and VOLC, across the variable’s range and over time? (That is, would the effect of SOLAR across its range be linear, or quadratic, or something else? Would the cumulative effect of VOLC be linear over time, or quadratic? Etc.)
lgl says: “Step change 2002/3 probably false and due to ARGO, fine, but what the h… happened around 1977?”
Is the step in 1977 or 1976, lgl?
Bob Tisdale says:
January 17, 2012 at 4:26 am
It seems you are made of the same stuff as Willis. You rant and carry on in an attempt to cover the real issues. Maybe you could learn from some of his mistakes, one lesson would be to keep it short and sweet.
You have continually attempted to dismiss the recognized PDO index as a possible driver of world climate, even though science is far from settled on this issue. Your arguments are full of holes that you have not addressed, and instead of taking my evidence of PDO involvement in ENSO in a scientific manner, you attack the man AGAIN.
Shame on you, you deserve the same treatment as Willis.
I will repeat my question for the third time. A short precise answer lacking Ad Hom would be appreciated.
“You are selling to the world that the PDO can have no effect on ENSO. I disagree with you and 2011 is just one example of your limited understanding on the topic. You still haven’t answered how we achieved the back to back La Nina or why the very strong La Nina of 2010 did not “charge” an El Nino event the following year.”
One can just replicate Foster and Rahmstorf’s methodology and then compare it to the actual temperatures to see it is a joke. It is not even close to the actual temperatures. They left out everything that actually explains temperature and that is why their paper does not have a chart in it comparing their reconstruction to the actual temperatures.
———-
to R. Gates on La Ninas causing the oceans to accumulate solar energy, you forgot the other side of the equation; outgoing long-wave radiation. During a La Nina, the long-wave radiation escapes much easier because there is less cloud cover overall.
So SW solar goes up but OLR goes up by way, way more in a La Nina. The equatorial Pacific can have OLR anomalies of +50 watts/m2 (which should be a shockingly high humber to anyone who is in the climate numbers business). That is why global and tropical temperatures decline in a La Nina and why the Ocean is NOT absorbing more heat energy in a La Nina. Of course, I have about a dozen charts showing this.
Geoff Sharp says: “I will repeat my question for the third time. A short precise answer lacking Ad Hom would be appreciated.
“You are selling to the world that the PDO can have no effect on ENSO. I disagree with you and 2011 is just one example of your limited understanding on the topic. You still haven’t answered how we achieved the back to back La Nina or why the very strong La Nina of 2010 did not “charge” an El Nino event the following year.”
HHHHHHHHHHHHHHHHHHHHH
Just as I suspected, Geoff. You don’t read my replies to you. Or if you had, you’re attempting to redirect the topic of conversation from your failings by falsely accusing me of something nonsensical. I’ve already replied to this. Do you need me to point out which comment? Scroll up through the thread and reread all of my replies to you. It’s there. I can see it, and so can everyone else who has followed this conversation.
Also, you, for some unknown reason, believe my comment above was an ad hom. Sorry, by definition, for my comment to be argumentum ad hominem, you would need to be telling the truth. And since your understandings of ENSO and PDO are so poor and you fabricate at every opportunity, your comments are far from it.
Anyone who reads this thread understands the motive behind your comments, and they can readily see though the debate tactics you employ; misdirection, redirection, fabrication; but those readers, like me, do not understand your incessant need to pettily attack my work. Especially when you are incapable of responding in kind. When you find yourself on the short end of the argument, you attack me, somehow believing you’re doing it on the sly in a public forum—and then quite humorously call foul when I expose the failings of your blatantly false innuendos.
Maybe you should have taken Anthony’s advice to you last July, and kept your comments to the topic of the solar cycle. Remember the link I provided for you up-thread? Just in case you failed to read that reply from me as well, here’s the link again. Scroll down to my July 4, 2011 at 7:09 am reply to you. Anthony’s suggestion is at the end of it:
http://wattsupwiththat.com/2011/06/30/yet-even-more-discussions-about-the-pacific-decadal-oscillation-pdo/#comment-693877
Adios, Geoff. It has not been a pleasure. Like all trolls, your goal is to distract, and you’ve done a fine job of it on this thread.
Bob Tisdale says:
January 17, 2012 at 6:48 pm
As predicted more diatribe and no substance, and you try to hide behind Anthony and suggest further censorship that challenges your platform. The questions have been asked that challenge your “theory” that makes up the majority of this post, which you have not answered adequately. I have provided evidence that the PDO index is not an “after effect of ENSO” but can actually be a driver of ENSO, but still you refuse to debate the topic in a reasonable scientific fashion. Your performance is similar to the other two sophists who like to dominate this site.
Those that read this thread will form their own opinions.
Scientific discourse with you is obviously impossible, but I am prepared to take you head on in a separate forum which is chaired by a reasonable moderator if you like?
Topic “is the PDO an after effect of ENSO”
Are you up for it?
Right here and now, Geoff.
Let’s start with basics. All you have to do is agree or disagree. If you disagree, you need to explain why.
By definition, “The ‘Pacific Decadal Oscillation’ (PDO) is a long-lived El Niño-like pattern of Pacific climate variability.” Source:
http://jisao.washington.edu/pdo/
And that means the spatial pattern in the North Pacific, north of 20N, which is also called a PDO pattern, is caused by El Niño and La Niña events when those events are taking place. Do you agree with that or disagree, Geoff?
By definition, “While the two climate oscillations have similar spatial climate fingerprints, they have very different behavior in time.” Source is same as above.
And that means that the spatial patterns (cold in the east and warm in the central and western North Pacific similar to a La Niña pattern, and likewise, warm in the east and cool in the central and western North Pacific similar to an El Niño pattern) have different time periods. In other words, sometimes the spatial pattern associated with ENSO events in the North Pacific has a different schedule than the ENSO events themselves. The spatial pattern in the North Pacific can lead the ENSO event and sometimes it can lag the ENSO event, maintaining the ENSO-like pattern longer than the ENSO event itself. Do you agree with that or disagree, Geoff?