 Reposted from Jo Nova’s site
Chinese 2485 year tree ring study shows shows sun or ocean controls climate, temps will cool til 2068
A blockbuster Chinese study of Tibetan Tree rings by Lui et al 2011 shows, with detail, that the modern era is a dog-standard normal climate when compared to the last 2500 years. The temperature, the rate of change: it’s all been seen before. Nothing about the current period is “abnormal”, indeed the current warming period in Tibet can be produced through calculation of cycles. Lui et al do a fourier analysis on the underlying cycles and do a brave predictions as well.
In Tibet, it was about the same temperature on at least 4 occasions — back in late Roman times — blame the chariots, then again in the dark ages — blame the collapse of industry; then in the middle ages — blame the vikings; in modern times — blame the rise of industry. Clearly, these climate cycles have nothing to with human civilization. Their team finds natural cycles of many different lengths are at work: 2-3 years, 100 years, 199 years, 800 years, and 1324 year. The cold periods are associated with sunspot cycles. What we are not used to seeing are brave scientists willing to publish exact predictions of future temperatures for 100 years that include rises and falls. Apparently, it will cool til 2068, then warm again, though not to the same warmth as 2006 levels.
On “tree-rings”
Now some will argue that skeptics scoff at tree rings, and we do — sometimes — especially ones based on the wrong kind of tree (like the bristlecone) or ones based on small samples (like Yamal), ones with abberant statistical tricks that produce the same curve regardless of the data, and especially ones that truncate data because it doesn’t agree with thermometers placed near airconditioner outlets and in carparks. Only time will tell if this analysis has nailed it, but, yes, it is worthy of our attention.
Some will also, rightly, point out this is just Tibet, not a global average. True. But the results agree reasonably well with hundreds of other studies from all around the world (from Midieval times, Roman times, the Greenland cores). Why can’t we do good tree-ring analysis like this from many locations?
Jo
Amplitudes, rates, periodicities and causes of temperature variations in the past 2485 years and future trends over the central-eastern Tibetan Plateau [Chinese Sci Bull,]
 Figure 5 Prediction of temperature trends on the central-eastern Tibetan Plateau for the next 120 years. Blue line, initial series; orange line, calibration series, 464 BC–834 AD; purple line, verification series, 835–1980 AD; red line, forecasting series, 1980–2134 AD. (Click to enlarge)
There are beautiful graphs. Have a look at the power spectrum analysis and the cycles below…
ABSTRACT:
Amplitudes, rates, periodicities and causes of temperature variations in the past 2485 years and future trends over the central-eastern Tibetan Plateau
Amplitudes, rates, periodicities, causes and future trends of temperature variations based on tree rings for the past 2485 years on the central-eastern Tibetan Plateau were analyzed. The results showed that extreme climatic events on the Plateau, such as the Medieval Warm Period Little Ice Age and 20th Century Warming appeared synchronously with those in other places worldwide. The largest amplitude and rate of temperature change occurred during the Eastern Jin Event (343–425 AD), and not in the late 20th century. There were significant cycles of 1324 a, 800 a, 199 a, 110 a and 2–3 a in the 2485-year temperature series. The 1324 a, 800 a, 199 a and 110 a cycles are associated with solar activity, which greatly affects the Earth surface temperature. The long-term trends (>1000 a) of temperature were controlled by the millennium-scale cycle, and amplitudes were dominated by multi-century cycles. Moreover, cold intervals corresponded to sunspot minimums. The prediction indicated that the temperature will decrease in the future until to 2068 AD and then increase again.
…
Figure 1 Tree-ring-based temperature reconstruction for the central-eastern Tibetan Plateau during the past 2485 years (gray line), the 40-year moving average (thick black line) and the 40-year running standard deviation (thin black line); the horizontal line is the mean temperature for the 2485 years. (Click to enlarge)
…
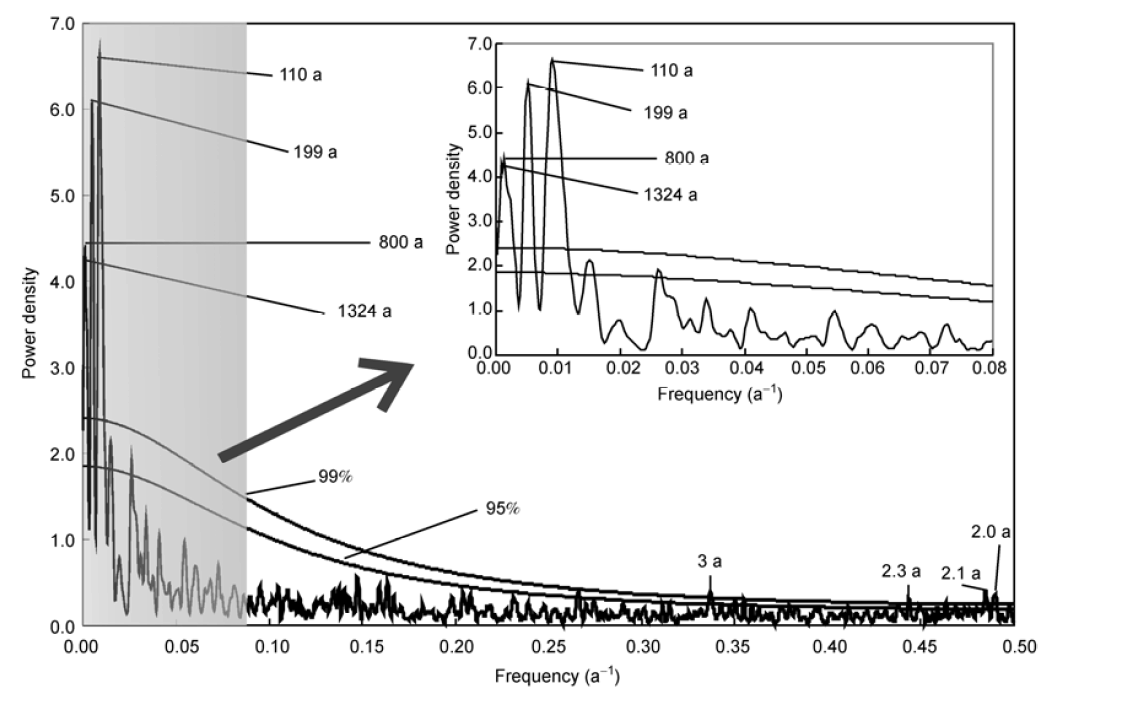 Figure 2 Power spectrum analysis of the 2485-year temperature series. (Click to enlarge)
…
 Figure 3 Millennium-scale cycle in the temperature variation during the last 2485 years. (Click to enlarge)
…
 Figure 4 Decomposition of the main cycles of the 2485-year temperature series on the Tibetan Plateau and periodic function simulation. Top: Gray line,original series; red line, 1324 a cycle; green line, 199 a cycle; blue line, 110 a cycle. Bottom: Three sine functions for different timescales. 1324 a, red dashed line (y = 0.848 sin(0.005 t + 0.23)); 199 a, green line (y = 1.40 sin(0.032 t – 0.369)); 110 a, blue line (y = 1.875 sin(0.057 t + 2.846)); time t is the year from 484 BC to 2000 AD. (Click to enlarge)
…
…
Conclusions
Climate events worldwide, such as the MWP and LIA, were seen in a 2485-year temperature series. The largest Figure 6 Temperature comparison between the forecast and observation data taken from seven stations on the central-eastern Tibetan Plateau (seven stations: Delingha, Dulan, Golmud, Lhasa, Nagqu, Dachaidan and Bange). amplitude and rate of temperature both occurred during the EJE, but not in the late 20th century. The millennium-scale cycle of solar activity determined the long-term temperature variation trends, while century-scale cycles controlled the amplitudes of temperature. Sunspot minimum events were associated with cold periods. The prediction results obtained using caterpillar-SSA showed that the temperature would increase until 2006 AD on the central-eastern Plateau, and then decrease until 2068 AD, and then increase again. The regularity of 600-year temperature increases and 600-year decreases (Figure 3) suggest that the temperature will continue to increase for another 200 years, since it has only been about 400 years since the LIA. However, a decrease in temperature for a short period controlled by century- scale cycles cannot be excluded. Obviously, solar activity has greatly affected temperature on the central-eastern Plateau. However, there are still uncertainties in our understanding of climate change, and the concentration of CO2 affects the climate. Further investigations are thus needed. –
————————–
REFERENCES
Liu Y, Cai Q F, Song H M, et al. Amplitudes, rates, periodicities and causes of temperature variations in the past 2485 years and future trends over the central-eastern Tibetan Plateau. Chinese Sci Bull, 2011, 56: 29862994, doi: 10.1007/s11434-011-4713-7 [ Climate Change over the Past Millennium in China.] … Hat Tip: Geoffrey Gold.
My favourite bit of skeptic illogic.
Forest fires occurred well before humans existed, therefore humans cannot cause forest fires.
Whatever caused it before is causing it again. The same event must always have the same cause.
But it’s not even the same event, Smokey. The MWP was a few hundred years getting to its peak stage. Modern warming has taken less than a century to get there. In this way the warming seems to be ‘unprecedented’.
(Nope, I didn’t drill some trees today, I’m just reporting what I’ve read)
barry says: December 9, 2011 at 2:30 pm
Uhhh, Barry, I gotta suspicion that maybe you never actually studied logic?
Yeah, the obligatory “hockey mask” that keeps the discredited Mann and Jones off the phone to your academic institution.
barry says:
“Modern warming has taken less than a century to get there. In this way the warming seems to be ‘unprecedented’.”
Wrong as always, barry.
RE: barry: (December 9, 2011 at 2:30 pm)
“‘And since CO2 was very low during the MWP, Occam’s Razor says that it isn’t causing the current warming.’
“My favourite bit of skeptic illogic. Forest fires occurred well before humans existed, therefore humans cannot cause forest fires.”
Actually what Occam’s Razor says is that human generated CO2 cannot be presumed to be the only cause of rising temperatures, especially as the calculated (MODTRAN) raw (no feedbacks) sensitivity of increasing the CO2 concentration in the atmosphere is less than one degree C per full doubling.
David Archibald in his “The Fate of All Carbon” article has projected that burning all the remaining economically recoverable carbon in the world would be just insufficient to reach 560 PPM CO2 in the atmosphere, which would be double the nominal pre-industrial base value.
barry says:
December 9, 2011 at 2:30 pm
The MWP was a few hundred years getting to its peak stage. Modern warming has taken less than a century to get there. In this way the warming seems to be ‘unprecedented’….I’m just reporting what I’ve read
What, no more of your infamous “cites”?
“But it was just your imagination, barry, once again
Running away with you….”
Because the MWP ended, right, around 1300? After which came the LIA which ended around 1750, well before your “modern warming” which you now conveniently limit to the ‘last <100 yrs.' but including the more recent increases in fossil fuel CO2 additions of the last 60-70 yrs. associated with a decrease in temps initially into the 1970’s and without any temp. increase at all in at least the last 13+ yrs.. All despite the valiant efforts of the Indians and Chinese to burn as much fossil fuel as possible, and counting.
While within the same alleged AGW “modern warming” time period, CO2 = CAGW has not yielded even one correct relevant prediction yet, barry, and your “logic” likewise does not track the general reality above.
barry, “seems” is the operative term describing what you are dealing with personally and trying to “prove” propagandistically , and it is definitely your favored choice! Just like simply repeating memes here which only please your “perception is reality” imagination.
And this now by not even trying to give your universally failed cites for your own merely repeated statements. Brilliant tactical move, barry!
Spector,
Agreed, although that conclusion arises from a simple syllogism rather than Occam’s Razor, which doesn’t really apply right here.
Of course, warming from CO2 is not based on presumptions but empirical testing (despite the strange propensity for some skeptics to claim no empirical testing has been done). Attribution of cause is probably the most important way to distinguish between what happened a thousand years ago and what is happening more recently.
Spector says:
December 9, 2011 at 6:28 pm
Actually what Occam’s Razor says is that human generated CO2 cannot be presumed to be the only cause of rising temperatures, especially as the calculated (MODTRAN) raw (no feedbacks) sensitivity of increasing the CO2 concentration in the atmosphere is less than one degree C per full doubling.
===========================================================
I don’t know about MODTRAN, but it’s a fairly straightforward prospect…. if someone can poke holes in this I’d be happy to listen…. I wrote this just a couple of days ago….. http://suyts.wordpress.com/2011/12/06/if-only/ Without factoring the logarithmic relationship and simply assuming a linear one…. I got that we could expect a high/low 1.06/0.93 degree increase when atmospheric CO2 is at 560ppm.
Of course, that assumes GISS is accurate, the CO2 levels did start at 280ppm and that a temp/CO2 relationship exists at all…..
By the way, apparently Earth’s atmosphere goes through natural carbon maxima about every 500K years. We apparently started one of those about 60kya.
crosspatch says:
December 9, 2011 at 11:57 pm
By the way, apparently Earth’s atmosphere goes through natural carbon maxima about every 500K years. We apparently started one of those about 60kya.
———-
Please cite your sources for this claim.
RE: barry: (December 9, 2011 at 7:56 pm)
“Of course, warming from CO2 is not based on presumptions but empirical testing (despite the strange propensity for some skeptics to claim no empirical testing has been done). Attribution of cause is probably the most important way to distinguish between what happened a thousand years ago and what is happening more recently.”
It is my understanding that the raw effect of carbon dioxide must be magnified by some assumed interaction with the water vapor absorption bands to obtain the high values required to make it responsible for recent environmental temperature changes, yet the MODTRAN calculated outgoing radiation at 20 km up only shows a narrow CO2 hole in the outgoing radiation; something like a one foot diameter tree in the middle of a twenty foot wide stream. Doubling the CO2 content appears to be equivalent to putting another tree right behind the first one.
RE: James Sexton: (December 9, 2011 at 8:30 pm)
“I don’t know about MODTRAN, but it’s a fairly straightforward prospect….”
MODTRAN is a program developed by the Air Force to predict infra-red radiation levels in the atmosphere with various environmental conditions and altitudes for aircraft systems testing. One version is hosted online as a web utility by the University of Chicago. Here is a link to a comparison plot showing the miniscule difference between radiative forcing of 300 and 600 PPM CO2 observed looking down from 20 km up.
File:ModtranRadiativeForcingDoubleCO2.png
“From Wikipedia, the free encyclopedia”
“Modtran3 v1.3 upward irradiance at 20 km, U.S. Standard Atmosphere”
http://en.wikipedia.org/wiki/File:ModtranRadiativeForcingDoubleCO2.png
As there are no gaps attributed to water-vapor, I assume that convection and perhaps emission spectrum broadening, due to the strong polar electrical attraction of H2O during molecular collisions, may make water vapor a leaky greenhouse gas. The small hole at 1111 kayzers (cycles per cm, cm-¹) is due to ozone.
barry says:
December 9, 2011 at 7:56 pm
Of course, warming from CO2 is not based on presumptions but empirical testing (despite the strange propensity for some skeptics to claim no empirical testing has been done).
You mean “empirically tested” by the “experiments” performed by Climate Science’s Play Station Warming Models? Which can’t even reproduce the empirical past, much less succeed in making even one correct relevant, truly empirical prediction.
barry, perhaps you should ask yourself why you haven’t learned the difference between your rather boring paranoid fantasyland reveries and reality. Why go through life haunted by your own provenly obsessive perceptions? Or is it simply the fact that the money in it for you to post the usual CAGW propaganda here is just too tempting? Maybe so that you can buy even more computer games?
I think researchers in general gotta be careful about what they claim. I don’t know much about the topic, but even if we’re in a cycle where there are big changes to the temperature, doesn’t mean that what we do don’t have an impact, i.e. those results doesn’t prove that humans have nothing to do with it.
What you say is logical. More so if the task is to prove something. But that’s not the task–to prove something. We can falsify thing by the scientific method but we can’t prove anything.
What is being argued by the proponents of unprecedented global warming is that it the currently observed warming is both unprecedented and in excess of what it was before fossil fuels were much used. The paper being discussed here seems to falsify that hypothesis by showing that periods in the past did enjoy warmth at least equal to that of modern times.
I use the word “enjoy” in a deliberate fashion because my study of climate history tells me that cold periods were times of less joy than modern times.