This is an excerpt of a larger document by Tony Brown (Tony B on WUWT and other blogs) that he will be happy to make available. He writes:
Some months ago I passed you a preliminary study of mine into historic temperatures and their accuracy. The latest version is attached. It seems to me that taking an extract from the start to the end of Section 2 would be highly relevant to the debate. I have come to the reluctant conclusion that we can not rely on the historic record for anything other than a general direction of travel (we are probably a little warmer than we were 350 years ago) It is quite impossible to parse the data to tenths of a degree.
As I say, if people would like to read the rest of the document I will email it to them but would be grateful for any comments, especially if they have a particular knowledge of the topic. My address is tonyAtclimatereason dot com.
Part Two-The Rumsfeld factor
“There are known knowns; there are things we know that we know. There are known unknowns; that is to say, there are things that we now know we don’t know. But there are also unknown unknowns; there are things we do not know we don’t know.”
Foreword
Of course, Donald Rumsfeld was not specifically referring to climate science back in 2002, yet there can be few other disciplines so riven with uncertainties from top to bottom that are still able to attract voluble proponents enthusiastically promoting the latest findings as incontrovertible facts, to a world largely unable to question the work of scientists.
This article -the second in a three part series entitled ‘Little Ice Age Thermometers-History and Reliability’-examines some of those many uncertainties in climate science and discusses the means by which our modern temperature records-surface and sea- have come about, as they are a useful proxy for many of the other measurements we are now asked to take for granted-such as sea levels and arctic ice- that will be examined in Part 3 of this series.
This article assumes the reader may have some general knowledge of the subject without being an expert, and hopes they will be prepared to undertake the work necessary to come to a better understanding of this complex subject by examining, with an open mind, some of the referenced material contained here.
To help the reader to understand how we arrived at this stage it would be useful to read Part 1 in this series which dealt with the basics by examining the development of the means of recording weather events. This took us on a journey from the Thermoscope of the Ancient Greeks through to the creation of the Stevenson screen by way of Romans, Russianized Vikings and of 1200 year old Byzantium accounts of great icebergs hitting the walls of Constantinople, with a large dose of contemporary scientific studies mixed in.
http://wattsupwiththat.com/2009/11/14/little-ice-age-thermometers-%e2%80%93-history-and-reliability/
In this second article we re-examine related events concerning the 1850/1880 CRU/Giss temperature records, and then pay particular attention to the reliability of those readings that have become the basis of our modern climate industry, examine those who carried out the original observations, and look at the circumstances under which data was collected.
This should help answer the question as to whether the temperature readings-viewed through the harsh prism of history and context-are a reliable record from which Governments can draw definitive conclusions that will affect global policy.
Section 1 – Unknown Knowns and Known unknowns
There are many factors influencing the production of accurate records, some of the key ones were identified in Part 1 of this series, others will be introduced here for the first time.
Until very recently, following the widespread advent of Automatic weather stations (AWS) in the 1980’s and digital recording some years after, obtaining an accurate manual reading from an instrument was highly problematic, being reliant on numerous variable factors, any of which may cause concern over the reliability of the end result.
The skill and diligence of the observer were of course paramount, as was the quality of the instrumentation and that a consistent methodology was employed, but this did not prevent the numerous variables conspiring to make the end result-an accurate daily temperature reading-very difficult to obtain. Indeed the errors inherent in taking measurements are often greater than the amounts being measured.
Many of these basic concerns can be seen in this contemporary description from a 1903 book which relates how temperature recordings of the time were handled. The “Handbook of Climatology” by Dr Julius von Hann (b. 23 March 1839 d. 1 October 1921) is the sometimes acerbic observations of this Austrian, considered the ‘Father of Meteorology.’
The book touches on many fascinating aspects of the science of climatology at the time, although here we will restrict ourselves to observations on land temperatures. (It can be read in a number of formats shown on the left of the page on the link below).
http://www.archive.org/details/pt1hanhdbookofcli00hannuoft
This material is taken from Chapter 6 which describes how mean daily temperatures are taken;
“If the mean is derived from frequent observations made during the daytime only, as is still often the case, the resulting mean is too high…a station whose mean is obtained in this way seems much warmer with reference to other stations than it really is and erroneous conclusions are therefore drawn on its climate, thus (for example) the mean annual temperature of Rome was given as 16.4c by a seemingly trustworthy Italian authority, while it is really 15.5c.”
That readings should be routinely taken in this manner as late as the 1900’s, even in major European centers, is somewhat surprising.
There are numerous veiled criticisms in this vein;
“…the means derived from the daily extremes (max and min readings) also give values which are somewhat too high, the difference being about 0.4c in the majority of climates throughout the year.”
Other complaints made by Doctor von Hann include this comment, concerning the manner in which temperatures are observed;
“…the combination of (readings at) 8am, 2pm, and 8pm, which has unfortunately become quite generally adopted, is not satisfactory because the mean of 8+2+ 8 divided by 3 is much too high in summer.”
And; “…observation hours which do not vary are always much to be preferred.”
That the British- and presumably those countries influenced by them- had habits of which he did not approve, demonstrate the inconsistency of methodology between countries, cultures and amateurs/professionals.
The book was published more than 20 years after the establishment of the US weather service-the year from which James Hansen commenced his Global Giss records (see Section five)
Dr von Hann seems to have pinpointed the remarkable coincidence-also observed by this author in an article referenced later- whereby Giss started recording just as a sharp down turn in temperatures came about, thereby exaggerating the subsequent upturn. Von Hann observes the reading in Washington DC in January 1880 as being 5.5c and a year later 2.4c.

http://data.giss.nasa.gov/gistemp/graphs/
It seems that Dr von Hann didn’t like the habit of believing that results are so accurate that they can be parsed to fractions of a degree (a practice that continues to this day) and makes the point that even long observations of monthly means are untrustworthy in regions where they vary greatly year by year.
It is on the Urban Heat Island effect (UHI) that his observations become especially pertinent to modern day conditions. UHI is tackled in Section Three, but briefly, he observed that temperatures were routinely around 1 degree C (around 1.8F) higher in cities than in rural areas, and cites the United States where differences of 2.8 to 15 degrees (F) are noted between the voluntary observers in rural areas, and the paid ones in the adjacent cities. He makes the perhaps obvious suggestion that stations would be better placed near cities than in them.
A listing of the many factors likely to affect the accuracy of readings-including UHI- is given in Section Two ‘Compendium of Uncertainties,’ although no doubt to this can be added many as yet ‘unknown unknowns.’
Section Two – Compendium of Uncertainties
This is an appropriate stage to provide a compendium of the various factors that might impact on the accuracy of the basic data-in this case that of the land thermometer reading.
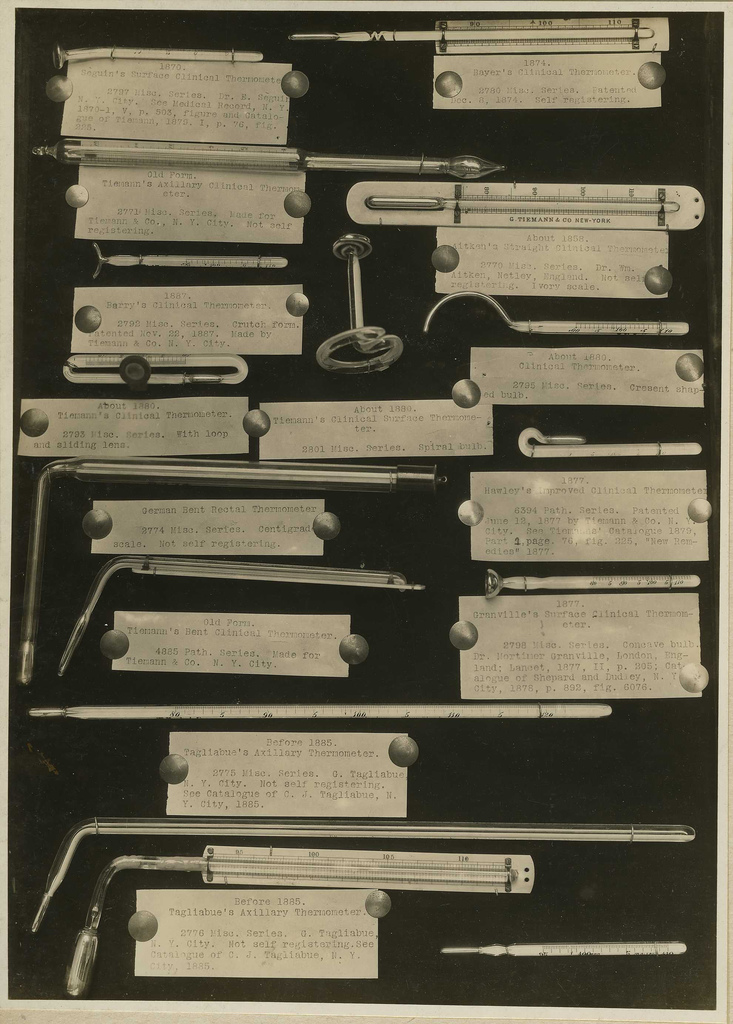
A recognisable thermometer became available in the 1650’s and instrumental records commenced around then in Italy and Britain. The most famous is the series from which Central England Temperature (CET) derives, which commenced in 1659. Thermometers rapidly evolved into an expensive, precision (in the context of its inherent limitations), scientific instrument.
The device spread quickly around the developed world. Monarchs and Universities considered it prestigious (and scientifically valuable) to take temperatures as one of a number of weather parameters, and we have many of their records to this day. Because of the cost and prestige factors, in its early days such instruments were generally used by trained observers.
* The nature of its construction and materials meant that its inherent accuracy is no more than approx. plus or minus 1 degree F. (up to 0.5 degree C) An accuracy concern that prevails until relatively recently (see Note 2)
* The limited accuracy of the instrument can be compounded by the methods by which it was housed and subsequently read. There was a vogue in the early days to place instruments in unheated north facing rooms, and even in metal cages attached to the north wall of a building, often on the first floor. This is far higher-and under very different conditions- than current standards permit, so like for like comparison is not possible without considerable adjustments. ‘Adjustments’ is a favourite word in the Climate Science Dictionary.
* The construction of the magnifying glass, through which the indicator mark of the instrument would be read, was often imperfect and caused distortions.
* Similarly, depending on the coarseness of the graduations of the temperature gauge, exact readings might be compromised.
* Both these last two factors are important considerations, as readings might be rounded up or down to the nearest whole degree.
* The invention of the minimum/maximum thermometer in 1780 by James Six was an important milestone.
http://brunelleschi.imss.fi.it/museum/esim.asp?c=410041
Up to this time measurements were (supposed) to be taken at least three times in a 24 hour period, so until this device became universally adopted neither the actual maximum or minimum temperature would necessarily be recorded, unless coincident to the exact time of the reading. However, measurements were still taken routinely, at various inconsistent times of the day even into the 20th century and mean temperatures calculated in different manners, so in practice the instrument took many years to come into common use. Modern analysis always assumes it was subsequently re-set and one day’s reading was not carried over to the following one.
* The Urban Heat Island effect (UHI) had the potential to greatly distort the readings of individual stations. (See Section Three.)
* The creation of the Stevenson screen in the latter years of the 19th Century helped to standardize the diverse conditions under which readings were taken, but was not in universal use until the first or second decade of the 20th century.
* Methodology remained inconsistent, and various crucial factors such as a standardized height for a properly calibrated and screened instrument are a relatively modern innovation.
* Whilst modern automatic weather stations-introduced from around 1980- have removed many of the human frailties, and its instrumentation has the potential to be generally accurate, to this day problems arise with inappropriate siting, some examples of which can be seen in this site.
http://www.surfacestations.org/odd_sites.htm
and here;
http://wattsupwiththat.com/2011/01/16/the-past-is-not-what-it-used-to-be-gw-tiger-tale/#more-31814
Extract; “Why are the stations so close to artificial heat sources? Well, fifty or more years ago, all the readings were taken manually by volunteer observers once a day. Some volunteers were not about to walk the length of a football field to do so. Even as automatic reporting stations were introduced, the stations had to be close to buildings so the data cable could be run to the display. Even though the originally specified maximum cable distance was 1/4 mile, most automated COOP observer MMTS sensors ended up within 10 meters (33 feet) of the building, mostly due to the inability of the NWS to trench under driveways and sidewalks which acted as barriers to putting the temperature sensor in open spaces.” (So what with Stevenson screens and the AWS, recording devices had a tendency over the years to move closer to buildings-sources of artificial heat).
* The majority of readings were taken in the Northern Hemisphere and records are biased towards this.
* Many records of the time are incomplete for a variety of reasons, of which war, or the death of the incumbent observer are but two, and these data omissions may be ‘interpolated’ (another favourite word of Climate Science) and then ‘adjusted’ many years later by modern computer methods. This is an unfortunate exercise as temperatures can vary greatly day by day and inventing figures does not mean they are the correct invented figures, as Dr von Hann observed over a century ago.
* There are a very small amount of stations worldwide and their numbers and locations continually fluctuate, making like for like comparison difficult.
* Instruments were fixed at inconsistent heights. Readings change considerably even with modest height changes.
* How tall was the observer, were they viewing the instrument straight on or at an angle? Was it an alcohol or mercury instrument where the meniscus curves in opposite directions to each other? How often did the observer change? Were they trained?
* Was there moisture or snow on the instrument?
* Was data ‘invented’ by the observer due to inclement weather or their other duties?
* Were the measurements translated accurately from one scale to another, for example from Reaumur degrees to Fahrenheit then to Centigrade?
* What was the defined accuracy of the thermometer claimed by the manufacturer-(likely to be around plus or minus 1 degree)? Was it subsequently recalibrated to maintain this accuracy level? Were subsequent thermometers at the same location bought from a different maker with different standards?
* Were the thermometers properly screened?
* Was there an adequate free flow of air round the bulb or was it restricted by fixing the instrument to a wall or the screen?
* Was the instrument set above bare ground, grass, tarmac, stone-all of which will affect results?
* Did it subsequently become affected by shade from the growth of trees or removal of an object which allowed more wind or the sun to reach an unscreened thermometer?
* Was the instrument always in the same location? There is a history of them migrating from the micro climate of a field in one part of the city to a warm airport many miles away, representing a completely different micro climate.
* Many of the cities with the longest temperature records- generally in Europe and North America- were industrialising rapidly as the thermometer came into widespread use in the 1700’s. Smog caused by the burning of coal, wood, and later gas, became increasingly widespread. Sunshine levels in the UK are said to be 40% higher now than during the worst years in London that culminated in the 1952 killer smog, which caused the various clean air acts to be enacted fully. Pollutants are said to create a cooling effect and it is easy to understand that foggy urban areas were likely to be substantially cooler than if the sun was shining. Inversions caused by these layers of air would have also helped to create temperatures that were vastly different-mostly lower-than they might otherwise have been. What effect this had on the overall temperature record over the centuries, in the many cities that smog affected to a greater or lesser degree, is impossible to calculate, but it must have been significant.
Perversely, smog became a tourist attraction and many artists flocked to great cities such as London to observe and paint the effects it caused.

Waterloo Bridge London in 1900 by Monet showing chimneys and smog. http://www.artnet.com/Magazine/features/nkarlins/karlins7-7-04.asp
An account of the historical development of smog is mentioned here;
http://en.wikipedia.org/wiki/Pollution
* Dr von Hann also expressed a number of other concerns already cited in the previous section. Blogger Adam Soereg echoes those reservations with his modern day take on those 1903 observations;
“Between 1780 and 1870, Hungarian sites observed the outdoor temperature at 7-14-21h, 6-14-22h or 8-15-22h Local Time, depending on location. How can anyone compare these early readings with contemporary climatological data? (The National Met. Service defines the daily mean temperature as the average of 24-hourly observations) The average annual difference between 7-14-21h LT and 24-hr readings calculated from over a million automatic measurements is -0.283°C. This old technique causes a warm bias, which is most pronounced in early summer (-0.6°c in June) and negligible in late winter/early spring. Monthly adjustments are within 0.0 and -0.6°c. The accuracy of these adjustments are different in each month, 1-sigma standard error varies between 0.109 and 0.182°C. Instead of a single value, we can only define an interval for each historical monthly and annual mean.”
Summary;
Thermometers were only designed to approximately measure the micro climate immediately around them, but the relationship of the readings to its original micro climate often became lost as the decades and centuries passed and thermometers migrated from cool open fields to warm airports many miles away. Throughout the history of instrumental records the growing need for a more consistent methodology can be readily seen that would enable measurements to be compiled on a like for like basis. The invention of the Stevenson screen and the Maximum/Minimum thermometer were arguably the first steps towards the standardisation of readings. However, these events coincided with the thermometer becoming a cheaper mass produced item instead of a scientific precision instrument of such cost and prestige that it was generally only used by a qualified observer.
Consequently, what could previously be considered a ‘scientific’ observation, (with all the numerous caveats) lost part of that status once the great expansion of the weather station network commenced in the 1880’s. Less skilled observers, using a cheaper product in different circumstances, were almost certain to come up with figures inconsistent with those of their predecessors, and comparisons become difficult, even into modern times. As was commented on earlier, full time paid professionals often had different standards to volunteers, or those paid a retainer.
Consistent reliability of readings through quality of instrumentation and methodology-height, screening, correct times of observation etc. – could not be guaranteed until the advent of the Automatic Weather Station in the 1980’s, but even then some of these have arguably been compromised by concerns over siting.
None of this is to say that many original observations were not done with great diligence and skill, just that there are so many variable parameters affecting the accuracy of the reading that a direct comparison to today’s values is impossible. To believe we have a highly accurate data base of even individual records that can be parsed to fractions of a degree is an illusion, and this uncertainty is multiplied many times when considering the accuracy of a ‘global’ temperature.
I will leave it to Dr Floor Anthoni to sum up, in a somewhat tongue in cheek manner, the preceding information, in a short article on Temperature reading errors;
http://www.seafriends.org.nz/issues/global/climate3.htm#Ocean_temperature_measurement
“Suppose we have stations with the finest thermometers inside the most standard Stevenson screens and located in rural areas, away from urban disturbances, then surely, readings must always be accurate? They are not, for various reasons:
Readings are done by humans. It involves going out in the rain, snow and sleet to the remotely placed weather station. There the finely scaled thermometers must be read to within 0.1 degrees, with fogging spectacles and suchlike. The data must be written up with a pen that won’t work on soggy paper, etc. So shortcuts are taken.
-
Let’s skip today because it is much like yesterday and we’ll use those figures instead.
-
John is sick and no-one else can do it today
-
Who will do it during the summer holidays?
-
The broken thermometer has still not been replaced.
- Etc.(Added by Anthony – there are polar bears outside and I don’t want to risk my life for a temperature reading. See: Fabricating Temperatures on the DEW Line)
There can also be a bias caused by the time that the reading is done. Air warms up during the day and is warmest a couple of hours after mid-day. During the night it cools and is coolest just before dawn. So in the morning one reads the maximum of previous day and the minimum of today. Are these two noted down for the same date? In the afternoon the reading shows today’s maximum and today’s minimum.
In addition to these problems, there are more serious ones related to location:
- Temperature decreases with height at the standard lapse rate of 0.6ºC per 100m altitude, but this is not always true.
- Stations located near the sea measure sea temperature during sea winds and land temperature during land winds, with usually a large difference between them. What do we want to measure? Air temperature over land or sea temperature?
The upshot of all this is that a large number of sites and observations are needed to even out reading errors, but one can never truly correct for UHI, altitude and distance to the sea.”
Technical references;
The 1903 book already referenced by Dr von Hann is linked below.
http://www.archive.org/details/pt1hanhdbookofcli00hannuoft
Citing it again provides the opportunity to comment that exactly the same concerns over accuracy and context that he expressed over a century ago are still of great relevance today, as the four subsequent papers demonstrate..
This interesting article with useful illustrations provides a practical tutorial on the accuracy of the thermometer.
http://pugshoes.blogspot.com/2010/10/metrology.html
Extracts and discussions from a new peer reviewed paper on uncertainties in the global record.
http://noconsensus.wordpress.com/2011/01/20/what-evidence-for-unprecedented-warming/#more-11278
This 2005 paper is headed ‘Uncertainty estimates in regional and global observed temperature changes-a new dataset from 1850.’
http://www.cru.uea.ac.uk/cru/data/temperature/HadCRUT3_accepted.pdf
Phil Jones amongst others were involved in this attempt to make comparisons between modern and historic temperature readings
http://www.springerlink.com/content/g111046235jnv572/
A rather more obvious problem with thermometers at ground level in Stephenson screens is that they are measuring air temperature as it is affected by clouds and wind direction.
On a sunny day in July the temperature might be expected to be 35Celsius, but if it is cloudy and the wind is blowing from the north the temperature may be much lower – say 10Celsius. In what way can that measurement be a reflection of CO2 impact unless you can say with any certainty that both cloud cover and wind direction are directly influenced by CO2? If climate charts indicate a trend over time with rising temperatures that would tend to suggest less cloud cover, not greater heat energy trapped in the atmosphere. Suggesting CO2 is the culprit is jumping to a conclusion when so many other variables could be to blame, some rather more obvious than CO2.