New SDO images show CMEs exploding from the Sun ripples like clouds do on Earth. It looks a lot like this photo, showing the well known Kelvin-Helmholtz instability.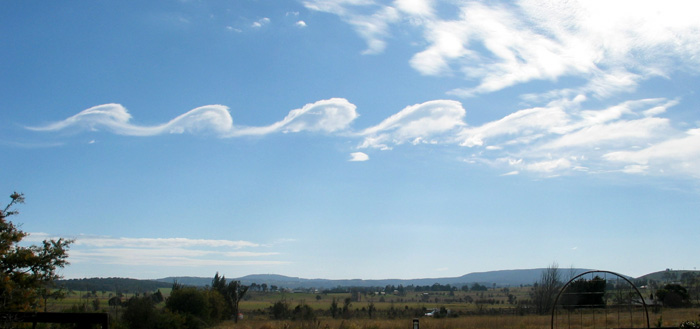
===============================================================
 experiment on NASA’s Solar Dynamics Observatory (SDO)") From the University of Warwick:
From the University of Warwick:
Physicists, led by a researcher at the University of Warwick, studying new images of clouds of material exploding from the Sun have spotted instabilities forming in that exploding cloud that are similar to those seen in clouds in Earth’s atmosphere.
These results could greatly assist physicists trying to understand and predict our Solar System’s “weather”.
The researchers, led by of the Centre for Fusion Space and Astrophysics, at the University of Warwick’s Department of Physics, made their discovery when examining new images of clouds of material exploding from the Sun known as coronal mass ejections (CMEs). These images were provided by the Atmospheric Imaging Assembly (AIA) experiment on NASA’s Solar Dynamics Observatory (SDO). SDO was been launched last year and provides unprecedented views of the Sun in multiple temperatures.
The new SDO/AIA observations provided images of coronal mass ejections in the extreme ultra violet at a temperature that was not possible to observe in previous instruments – 11 million Kelvin. On examining these images the Warwick researchers spotted a familiar pattern of instability on one flank of an exploding cloud of solar material that closely paralleled instabilities seen in Earth’s clouds and waves on the surfaces of seas.
 experiment on NASA’s Solar Dynamics Observatory (SDO)")
When observed these Kelvin-Helmholtz (or KH) instabilities appear to roll up into growing whirls at boundaries between things moving at different speeds, for instance the transition between air and water or cloud. The difference in speeds produces the boundary instabilities.
Similar conditions can occur when one looks at the magnetic environment of the path of these coronal mass ejections as they travel through the solar corona. The difference in speed and energies between the two creates the very similar KH instabilities that we can observe in clouds.
While KH instabilities have been predicted or inferred from observations as happening within the solar system’s weather this is the very first time they have been directly observed in the corona. What makes this observation even more interesting is that the instabilities appear to form and build on one flank of the CME. This may explain why CMEs appear to bend and twist as these instabilities build, and cause drag, on one side of the cloud. This effect will be the next focus for the University of Warwick led research team.
University of Warwick researcher Dr Claire Foullon said:
“The fact that we now know that these KH instabilities in CMEs are so far only observable in the extreme ultra violet, at a temperature of 11 million Kelvin, will also help us in modelling CME behaviour”
“This new observation may give us a novel insight into why these CMEs appear to both rotate, and be deflected away from following a simple straight path from the surface of the Sun. If the instabilities form on just one flank they may increase drag one side of the CME causing it to move slower than the rest of the CME.”
Dr Foullon and her co-researchers have outlined their observations and detailed modelling of how they believe this phenomenon occurs in a paper just published in Astrophysical Journal Letters entitled Magnetic Kelvin-Helmholtz Instability at the Sun by Dr Claire Foullon, Erwin Verwichte, Valery M. Nakariakov Centre for Fusion, Space and Astrophysics, Department of Physics, University of Warwick; Katariina Nykyri, Department of Physical Sciences, Embry-Riddle Aeronautical University, Daytona Beach, Florida; and Charles J. Farrugia, Space Science Center and Department of Physics, University of New Hampshire, Durham, New Hampshire.
The preprint is available at:
http://www.warwick.ac.uk/go/foullon/publications/foullon_preprint_apjl_2011.pdf
Lief – thank you for replying so promptly.
I have a point to make about your reply,
but first I want to assure you I have no agenda.
I have no vested interest, no oil money or big tobacco backing.
I am a private citizen, close to the end of life -there’s not much wishful thinking in that, let me assure you.
I just want to know about the climate.
AusieDan says:
February 6, 2011 at 8:04 pm
Why abandon this for the S&P method which has no similar pedigree and just at this critical juncture in the cycle?
It is L&P [for Livingston &Penn], and their measurements have nothing to do with [and do not change] the way sunspots are counted – although Geoff is trying to change the sunspots counting method]. L&P just measures the magnetic fields and darkness of all the spots [small and large] they can see during their once a month observing window. We find that already we are only seeing about half the spots we would expect for the amount of magnetic flux the Sun has [as manifested in the solar microwave flux].
If L&P are correct, what happens to sunspots after 2015?
Are they dead and gone forever?
Or will they just go into [hibernation] for a century or two?
If L&P are correct and sunspots become effectively] invisible [not gone] it might mean another Grand Minimum lasting perhaps 50 years. During this time the solar cycle is still operating, cosmic rays are still modulated, and the solar wind is still buffeting the Earth.
I presume that you do not think that would impact the earthly weather in any fashion.
It will lead to a cooling of a couple of tenths of a degree.
AusieDan says:
February 6, 2011 at 8:20 pm
I just want to know about the climate.
Then, unfortunately, the solar antics won’t make much of a difference IMHO.
Lief, at the end of your comment you said:
QUOTE
There was no grand minimum in the 1800s, and it is not proven that a grand minimum [if indeed we are heading into one: the Eddy Minimum] changes the Sun’s output enough to cause serious climate effects”
UNQUOTE.
By that I assume that you imply that the rather cooler period experienced in the 18th and early 19th venturies was not due to a solar minimum.
However, I understand that the last solar minimum did coincide with a much colder, earlier period, which forced the Vikings to evacuate what had previously been a more inhabitable greener Greenland. (There were many other unpleasant consequences of that colder period too).
Yes , yes, correlation is not …… etc etc.
You also claim that if we are heading into a solar minimum then that will not change “….. the Sun’s output enough to cause serious climate effects”.
Are you suggesting that I expect changes in the sunspot cycles (or rather the electrical and magnetic forces in the sun causing those sunspots) will significantly cause changes to the climate here on earth?
I’m a little surprised that you infer that this is my belief.
In fact, I try NOT to have beliefs about the climate, but only to hold tentative hypothses, which I regularly modify or discard in the light of obtaining more recent information.
My own observation of publically available data suggests that there is a sixty odd year cycle going through global indices and that we have just moved from the end of the last upswing and are now embarking on the downswing.
Later there will be another upswing etc.
Beyond that I am aware of the research and the theories relating sunspots to the larger multi century climate cycles.
I am very intregued but at present have an open mind.
I am also surprised that you have misunderstood my earlier post to this extent.
Lief, I must apologise, because I left out certain important words in my previous comment.
I wrote “Are you suggesting that I expect changes in the sunspot cycles (or rather the electrical and magnetic forces in the sun causing those sunspots) will significantly cause changes to the climate here on earth?”
I meant to write (in part) “Are you suggesting that I expect changes in the sunspot cycles …….. will significantly cause changes IN THE HEAT ENERGY FROM THE SUN, WHICH WILL SIGNIFICANTLY CHANGE the climate here on earth?”
I presume you did not think me to be so nieve.
AusieDan says:
February 6, 2011 at 8:49 pm
By that I assume that you imply that the rather cooler period experienced in the 18th and early 19th centuries was not due to a solar minimum.
Yes. For example, the solar maximum in 1778 was probably even higher than the very large cycle 19 in the 1950s.
However, I understand that the last solar minimum did coincide with a much colder, earlier period, which forced the Vikings to evacuate what had previously been a more inhabitable greener Greenland. (There were many other unpleasant consequences of that colder period too).
The Vikings’ decline started way back in the 14th century.
I’m a little surprised that you infer that this is my belief.
In fact, I try NOT to have beliefs about the climate, but only to hold tentative hypotheses, which I regularly modify or discard in the light of obtaining more recent information.
I do not imply any beliefs.
My own observation of publically available data suggests that there is a sixty odd year cycle going through global indices and that we have just moved from the end of the last upswing and are now embarking on the downswing.
something like that seems to be going on. The Sun does not share those same cycles.
I am also surprised that you have misunderstood my earlier post to this extent.
I don’t know that I misunderstood anything.
AusieDan says:
February 6, 2011 at 8:58 pm
I meant to write (in part) “Are you suggesting that I expect changes in the sunspot cycles …….. will significantly cause changes IN THE HEAT ENERGY FROM THE SUN, WHICH WILL SIGNIFICANTLY CHANGE the climate here on earth?”
I assumed that this is what you meant, of course.
I presume you did not think me to be so naive.
Lots of people on this blog seem to be so.
You have taught us a lot, Leif, many thanks for your patience. No one person can crystal ball the future, but comments on this from you would certainly be appreciated.
Space and Science Research Center
P. O. Box 607841 * Orlando, Fl 32860
http://www.spaceandscience.net
Press Release 2-2011
Global Cooling Begins and Global Warming Ends with Record Drop in Temperatures
http://www.spaceandscience.net/id16.html
Also…
http://www.spaceandscience.net/sitebuildercontent/sitebuilderfiles/ssrcresearchreport1-2010.doc
Ed Mertin says:
February 6, 2011 at 9:17 pm
Press Release 2-2011
Global Cooling Begins and Global Warming Ends with Record Drop in Temperatures
http://www.spaceandscience.net/id16.html
I would not place any credibility on this. See http://mediamatters.org/print/blog/201005150024
REPLY: Ditto that, ignore it – Anthony
The biggest loser of this “unnamed” grand minimum will be EUV. There are two reasons for this. Solar output will be reduced and the type of sunspot is changing. Unipolar groups are now dominating, these groups naturally have a lower EUV and F10.7 flux output and in some cases actually reduce EUV output by flux cancellation.
The ionosphere is currently very low because of the reduced EUV output. Some suggest this causes changes to the polar vortex and associated atmospheric oscillations. We are currently seeing the result of this world wide. This was predicted last July and will be one of the mechanisms that links solar output to climate.
So the magnetic argument is superfluous although some impact to the solar wind is expected. I have shown sufficient doubt that Leif’s graph is not of scientific quality and at best should be relabeled to suggest it represents an increase in specks only.
Geoff Sharp says:
February 6, 2011 at 9:31 pm
Unipolar groups are now dominating
Not at all. Unipolar groups have always been regulars. Today is not special in any way. The Sun is a messy place. You always have to take a longer view. What happens over a period of a few weeks or months cannot be taken as significant.
Leif’s graph is not of scientific quality and at best should be relabeled to suggest it represents an increase in specks only.
The L&P effect is just that: more and more hard to see specks rather than ordinary spots.
Geoff Sharp says:
February 6, 2011 at 9:31 pm
So the magnetic argument is superfluous
It is the magnetic field in the corona that determinse the EUV in the first place. The solar wind is not part of the equation, and has no influence on the climate anyway.
Leif Svalgaard says:
February 6, 2011 at 9:55 pm
Geoff Sharp says:
February 6, 2011 at 9:31 pm
Unipolar groups are now dominating
Not at all. Unipolar groups have always been regulars. Today is not special in any way. The Sun is a messy place. You always have to take a longer view. What happens over a period of a few weeks or months cannot be taken as significant.
If we isolate specks that don’t meet the threshold since July 1 2010 we have had 34 regions. 16 of those were unipolar which is close to 50%. Past studies show unipolar groups between 1915-1953 made up 38% of total activity. This study includes small pores which I have excluded so you would expect a reduction on the 38% using the same rules. Unipolar groups are significantly on the rise, they are all very strong magnetically but low on EUV. Lets see if they continue. If we look at all the sunspot counting methods the current trend is showing the sunspot number moving higher away from the F10.7 flux. This is a result of the unipolar groups.
The solar wind is not part of the equation, and has no influence on the climate anyway.
The solar wind is a factor in the size of the ionosphere.
Geoff Sharp says:
February 6, 2011 at 11:28 pm
Unipolar groups are now dominating
Not at all. Unipolar groups have always been regulars. Today is not special in any way.
Here is the frequency of unipolar groups compared to all groups for each year since 1988. You can clearly see that 2010-2011 are not special in any way. The mean for 1988-2011 is 34% unipolar.
If we isolate specks that don’t meet the threshold since July 1 2010 we have had 34 regions. 16 of those were unipolar which is close to 50%.
There is your cherry picking again. 16/34 is 0.47, but has a statistical error of the order of the square root of the counts, so the unipolar ones could by chance be any number between 12 and 20. There is nothing special about the recent years.
The solar wind is a factor in the size of the ionosphere.
The size of the ionosphere has nothing to do with the climate.
Geoff Sharp says:
February 6, 2011 at 11:28 pm
“Unipolar groups are now dominating”
Not at all. Unipolar groups have always been regulars. Today is not special in any way.
Here is the frequency of unipolar groups compared to all groups for each year since 1988. You can clearly see that 2010-2011 are not special in any way. The mean for 1988-2011 is 34% unipolar.
here is the figure: http://www.leif.org/research/Frequency-Unipolar-Groups.png
The numbers for 2011 has been scaled up by 365/33 [based on the first 33 days]
Dr. S. & Geoff
Last summer I developed a simple scanning method of
/realtime/mdi_mag/1024/latest
calculating the daily magnetic active area. The 50 days (Jul-Aug) result is here:
http://www.vukcevic.talktalk.net/MI.gif
Leif Svalgaard says: February 6, 2011 at 7:58 pm
It is, and so should be approached in a scientifically correct way, uncolored by agenda and wishful thinking.
Dr. Svalgaard
I have no particular agenda to see the L&P effect either failing or succeeding (far less than you might have). I think that all the major events within heliosphere are cyclical (decade, century or millennia scale). If there are some sudden changes not previously exhibited (on the above scale) than they must be result of a galactic impact.
Symmetry between the L&P contrast and SSN decline
http://www.vukcevic.talktalk.net/L&P1.htm
and luck of the data volume pre 2000, goes in favour of this to be a part of the known (or some new) solar magnetic cycle.
If your synthetic sunspot reconstructions are correct, and you think that this is a factor which may existed during the Maunder, reappearing now, then I think planetarism is not totally out of question.
Since it appears that we are heading for a major reduction in the solar activity, culminating around 2025 (as my formula from 2003 predicted) than a significant wind down in the magnetic levels would be expected.
I would not be surprised (or if you whish, I predict) that as the SSN increases during next year or two, the L&P effect will decline, and then recover a bit as SC24 goes downward.
Considering that bulk of L&P data is since 2001, than veracity of your trend lines in
http://www.leif.org/research/Livingston%20and%20Penn.png
should be far more credible if relates to 2001-2011 period. The trend line currently covers 21 year period (I think looks more like ^2, than linear but either way), so if you are projecting the effect to 10-15 year forward, by apply the same logic to a back extrapolation (should be equally valid) then you may agree, you got rather odd (not to say unrealistic) results for 1970’s.
Leif Svalgaard says:
February 7, 2011 at 12:58 am
You can clearly see that 2010-2011 are not special in any way. The mean for 1988-2011 is 34% unipolar.
Exactly, you agree with recent reports.
The ratio is much higher today.
Thank you Leif and Anthony, all you folks are so valuable to on the go working people with limited time.
Near lost the use of my right leg as a casualty from the falling trees during the January ’09 ice storm. The storm that coated everything in ice from Paris, TX and particularly up into Oklahoma throughout Northwest Arkansas, SE Missouri across to Charleston, West Virginia. That had never been seen, the magnitude of ice, in my lifetime. But thankfully with a shoe 1 1/2″ thicker sole I get around. Time for me to slide off these Ozark Mtns. (hopefully not literally) and get back to work. Thanks again!
Geoff Sharp says:
February 7, 2011 at 4:37 am
“You can clearly see that 2010-2011 are not special in any way. The mean for 1988-2011 is 34% unipolar.”
The ratio is much higher today.
For 2010 it was 38%
For 2011 it is 37%
Not different from 1915-1955 or from 1988-2011 means.
vukcevic says:
February 7, 2011 at 3:24 am
Considering that bulk of L&P data is since 2001, than veracity of your trend lines in
http://www.leif.org/research/Livingston%20and%20Penn.png
should be far more credible if relates to 2001-2011 period.
The trend is for illustration only and has no particular physical significance, but since it is calculated as a least-squares fit, the few points before 2001 have very little weight. Excluding them makes no difference. I am reluctant to cherry pick data, so show all there is.
The rest of your post is just baseless speculation.
L&P Something has occurred to me about a missing dimension which might be related. Want to see if there is enough information to link the two datasets. (I suspect not)
I cannot find the L&P data. Any ideas on where the data is hidden?
Tim Channon says:
February 7, 2011 at 7:43 am
I cannot find the L&P data. Any ideas on where the data is hidden?
http://www.leif.org/research/Livingston.txt
Well they’re not Solitons; so they must be Clouditons, that propagate without changing their shape.
I wish people would stop posting links that end up in a closed loop, so that the back button does not return to WUWT. It’s a royal pain when I have to close my browser, and re-open WUWT, because I looked at somebody’s stupid link.
George E. Smith,
On a Mac you can open a link in a new window [Option+⌘ then click]. Probably PC’s have a similar feature. Then when you’re finished with the new window, just close it and you’re back at your original page without having to reload it.