New SDO images show CMEs exploding from the Sun ripples like clouds do on Earth. It looks a lot like this photo, showing the well known Kelvin-Helmholtz instability.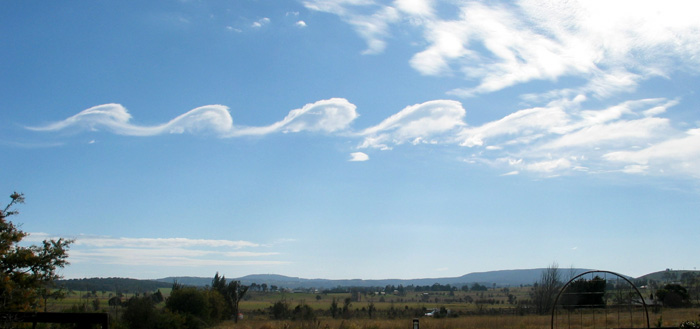
===============================================================
 experiment on NASA’s Solar Dynamics Observatory (SDO)") From the University of Warwick:
From the University of Warwick:
Physicists, led by a researcher at the University of Warwick, studying new images of clouds of material exploding from the Sun have spotted instabilities forming in that exploding cloud that are similar to those seen in clouds in Earth’s atmosphere.
These results could greatly assist physicists trying to understand and predict our Solar System’s “weather”.
The researchers, led by of the Centre for Fusion Space and Astrophysics, at the University of Warwick’s Department of Physics, made their discovery when examining new images of clouds of material exploding from the Sun known as coronal mass ejections (CMEs). These images were provided by the Atmospheric Imaging Assembly (AIA) experiment on NASA’s Solar Dynamics Observatory (SDO). SDO was been launched last year and provides unprecedented views of the Sun in multiple temperatures.
The new SDO/AIA observations provided images of coronal mass ejections in the extreme ultra violet at a temperature that was not possible to observe in previous instruments – 11 million Kelvin. On examining these images the Warwick researchers spotted a familiar pattern of instability on one flank of an exploding cloud of solar material that closely paralleled instabilities seen in Earth’s clouds and waves on the surfaces of seas.
 experiment on NASA’s Solar Dynamics Observatory (SDO)")
When observed these Kelvin-Helmholtz (or KH) instabilities appear to roll up into growing whirls at boundaries between things moving at different speeds, for instance the transition between air and water or cloud. The difference in speeds produces the boundary instabilities.
Similar conditions can occur when one looks at the magnetic environment of the path of these coronal mass ejections as they travel through the solar corona. The difference in speed and energies between the two creates the very similar KH instabilities that we can observe in clouds.
While KH instabilities have been predicted or inferred from observations as happening within the solar system’s weather this is the very first time they have been directly observed in the corona. What makes this observation even more interesting is that the instabilities appear to form and build on one flank of the CME. This may explain why CMEs appear to bend and twist as these instabilities build, and cause drag, on one side of the cloud. This effect will be the next focus for the University of Warwick led research team.
University of Warwick researcher Dr Claire Foullon said:
“The fact that we now know that these KH instabilities in CMEs are so far only observable in the extreme ultra violet, at a temperature of 11 million Kelvin, will also help us in modelling CME behaviour”
“This new observation may give us a novel insight into why these CMEs appear to both rotate, and be deflected away from following a simple straight path from the surface of the Sun. If the instabilities form on just one flank they may increase drag one side of the CME causing it to move slower than the rest of the CME.”
Dr Foullon and her co-researchers have outlined their observations and detailed modelling of how they believe this phenomenon occurs in a paper just published in Astrophysical Journal Letters entitled Magnetic Kelvin-Helmholtz Instability at the Sun by Dr Claire Foullon, Erwin Verwichte, Valery M. Nakariakov Centre for Fusion, Space and Astrophysics, Department of Physics, University of Warwick; Katariina Nykyri, Department of Physical Sciences, Embry-Riddle Aeronautical University, Daytona Beach, Florida; and Charles J. Farrugia, Space Science Center and Department of Physics, University of New Hampshire, Durham, New Hampshire.
The preprint is available at:
http://www.warwick.ac.uk/go/foullon/publications/foullon_preprint_apjl_2011.pdf
KH can also be observed at the heliopause, where the solar wind meets the interstellar medium, at 48 A.U. (beyond the orbit of Pluto).
Here is a Java applet demonstrating the effect:
ftp://space.mit.edu/pub/plasma/models/KH_heliopause_slideshow.html
Very Interesting!
While at matters Solar, it appears that L&P effect may be fizzling out.
http://www.vukcevic.talktalk.net/L&P1.htm
Maybe someone can explain what these clouds are I photographed at work. Sorry if this is OT.
http://www.flickr.com/photos/23654176@N03/5420910747/#/photos/23654176@N03/5420910747/lightbox/
Size does not alter the physics. Everything must obey the same rules.
Ralph says:
February 6, 2011 at 4:51 am
Maybe someone can explain what these clouds are I photographed at work. Sorry if this is OT.
http://www.flickr.com/photos/23654176@N03/5420910747/#/photos/23654176@N03/5420910747/lightbox/
OT Response – These look like they could be non-persistent contrails from high performance military aircraft ‘exercising’ in a tail chase of some sort or practicing maximum rate turns. These exercises go on all the time usually unnoticed but sometimes they are in a patch of high humidity air and the repeated practices leave their patterns in contrails.
vukcevic says:
February 6, 2011 at 4:44 am
While at matters Solar, it appears that L&P effect may be fizzling out.
http://www.vukcevic.talktalk.net/L&P1.htm
Agree….L&P is bad science employed by those that might need a leg out.
Ian W says:
OT Response – These look like they could be non-persistent contrails from high performance military aircraft ‘exercising’ in a tail chase of some sort or practicing maximum rate turns. These exercises go on all the time usually unnoticed but sometimes they are in a patch of high humidity air and the repeated practices leave their patterns in contrails.
In a closed loop with no exit trail? Yeah that makes sense..
“well known Kelvin-Helmholtz instability.”
In some circles…
Ralph says:
February 6, 2011 at 6:55 am
In a closed loop with no exit trail? Yeah that makes sense..
I suggest you look at ‘high energy maneuvers’ sometime together with the thickness of the contrailing layer. All sorts of strange patterns can be generated.
/OT
These look simply like the turbulence that occurs when two adjacent laminar streams of liquid or gas are moving at differing velocities
@Ralph
Ian is spot on. There is another flickr image of a similar cloud ring formation. The (presumably British) photographer contacted the Met Office for an explanation and received this response:
http://www.flickr.com/photos/debi2006/3382989068/
Just a guess, but the (Earth) clouds shown look like they are following the terrain – a mountain wave. I wonder what could be causing the ones in the AIA image. There doesn’t appear to be any terrain to follow.
Geoff Sharp says:
February 6, 2011 at 6:47 am
Agree….L&P is bad science employed by those that might need a leg out.
Disagree, L&P is a strong as ever, but may be a inconvenient truth for some.
@ur momisugly John Marshall
February 6, 2011 at 5:12 am
Size does not alter the physics. Everything must obey the same rules.
Not true….the law of physics says the faster you go the heavier you get.
That means fat people have an unfair advantage when it comes to running the hundred yards
[snip – “chemtrails” is a banned discussion item here – Anthony]
What’s the controversy of L&P?
I’ve seen similar cloud formations over here in BC. Always wondered how and why they formed.
Carbone says:
February 6, 2011 at 9:24 am
What’s the controversy of L&P?
That sunspots are becoming warmer and thus harder to see and that therefore the sunspot number no longer is a good measure of solar activity:
http://www.leif.org/research/SHINE-2010-Microwave-Flux.pdf
Ralph says: Maybe someone can explain what these clouds are. . .
I’ll go with the contrails theory. The heaviest ring looks like two aircraft, one turning more tightly. In high performance turns, fighters can use afterburner to keep from losing airspeed, which might account for the lack of contrail when they come out of the turn and shut off the afterburner.
Looking back, was there any hint of L&P during solar cycle 23 ramp up?
vukcevic says:
“it appears that L&P effect may be fizzling out.”
Geoff Sharp says:
“Agree….L&P is bad science employed by those that might need a leg out.”
Leif Svalgaard says:
“Disagree, L&P is a strong as ever, but may be a inconvenient truth for some.”
Interesting, another scientific consensus… Anyway, I am planning to add a few plots on the Sun’s Magnetic Field to the WUWT Solar Page:
http://wattsupwiththat.com/reference-pages/solar-images-and-data-page/
I was thinking of adding this one;
http://wso.stanford.edu/gifs/Polar.gif
this one;
http://wso.stanford.edu/gifs/Tilts.gif
and this one;
http://www.leif.org/research/Livingston%20and%20Penn.png
but now after looking at this;
http://www.vukcevic.talktalk.net/L&P1.htm
and this;
http://www.landscheidt.info/images/livingston.png
I am not sure what to add on L&P. What plots on the Sun’s Magnetic Field and L&P do you recommend for inclusion on the WUWT Solar Page and why?
Ed Mertin says:
February 6, 2011 at 10:03 am
Looking back, was there any hint of L&P during solar cycle 23 ramp up?
Yes, but not for cycles prior to SC23:
http://www.leif.org/research/F107-SSN-divergence.png
Just The Facts says:
February 6, 2011 at 10:19 am
Anyway, I am planning to add a few plots on the Sun’s Magnetic Field to the WUWT Solar Page: http://wattsupwiththat.com/reference-pages/solar-images-and-data-page/
I was thinking of adding this one;
http://wso.stanford.edu/gifs/Polar.gif
That one is good
this one; http://wso.stanford.edu/gifs/Tilts.gif
Too complicated to interpret
and this one;
http://www.leif.org/research/Livingston%20and%20Penn.png
Is updated whenever Livingston sends me data. so is good
but now after looking at this;
http://www.vukcevic.talktalk.net/L&P1.htm
The ‘trend’ line has no basis and within uncertainties cannot be distinguished from a simple straight line.
and this;
http://www.landscheidt.info/images/livingston.png
Although it clearly shows the decline in the magnetic field, it is not correct to connect the points by a line as they represent measurements on unrelated sunspots.
Just The Facts says: February 6, 2011 at 10:19 am
I was thinking of adding this one;
http://wso.stanford.edu/gifs/Polar.gif
JTF
I maintain an up to date higher resolution Polar Field graph
http://www.vukcevic.talktalk.net/PF-latest.gif
on my web page: http://www.vukcevic.talktalk.net/LFC6.htm