Last update: 4 February 2011
by Klaus Wolter
The views expressed are those of the author and do not necessarily represent those of NOAA.

El Niño/Southern Oscillation (ENSO) is the most important coupled ocean-atmosphere phenomenon to cause global climate variability on interannual time scales. Here we attempt to monitor ENSO by basing the Multivariate ENSO Index (MEI) on the six main observed variables over the tropical Pacific. These six variables are: sea-level pressure (P), zonal (U) and meridional (V) components of the surface wind, sea surface temperature (S), surface air temperature (A), and total cloudiness fraction of the sky (C). These observations have been collected and published in COADS for many years. The MEI is computed separately for each of twelve sliding bi-monthly seasons (Dec/Jan, Jan/Feb,…, Nov/Dec).
After spatially filtering the individual fields into clusters (Wolter, 1987), the MEI is calculated as the first unrotated Principal Component (PC) of all six observed fields combined. This is accomplished by normalizing the total variance of each field first, and then performing the extraction of the first PC on the co-variance matrix of the combined fields (Wolter and Timlin, 1993). In order to keep the MEI comparable, all seasonal values are standardized with respect to each season and to the 1950-93 reference period. The MEI is extended during the first week of the following month based on near-real time marine ship and buoy observations (courtesy of Diane Stokes at NCEP) summarized into COADS-compatible 2-degree monthly statistics at NOAA-ESRL PSD. Caution should be exercised when interpreting the MEI on a month-to-month basis, since the input data for updates are not as reliable as COADS, and the MEI has been developed mainly for research purposes. Negative values of the MEI represent the cold ENSO phase, a.k.a.La Niña, while positive MEI values represent the warm ENSO phase (El Niño).
You can find the numerical values of the MEI timeseries under this link, and historic ranks under this related link. You are welcome to use any of the figures or data from the MEI websites, but proper acknowledgment would be appreciated. Please refer to the (Wolter and Timlin, 1993, 1998) papers (NOW available online as pdf files!), and/or this webpage.
If you have trouble getting the data, please contact me under (Klaus.Wolter@noaa.gov)

How does the 1998-2000 La Niña event compare against the seven previous biggest La Niña events since 1949? Only strong events (with a peak value of at least -1.2 sigma) are included in this figure. Note that some events last through the full three years shown here (for instance, 54-56), while others revert to “normal” or El Niño conditions by the second or third year (especially in 64-66). The 1998-2000 La Niña does not resemble any previous event in this comparison figure. It started late (about three months later than the previous latest case), and it featured a superimposed annual cycle (peaking around May and troughing around November) that does not match the other events displayed in this figure. However, the weak La Niña period after the 1982-83 El Niño had similar characteristics. Click on the “Discussion” button below to find the comparison of 2010 MEI conditions against several strong La Niña events.
Discussion and comparison of recent conditions with historic El Niño events

How does the 2002-04 El Niño event compare against the seven previous biggest El Niño events since 1949? Aside from 2002-04, only strong events (with a peak value of at least +1.4 sigma) are included in this figure. The 2002-03 El Niño event peaked below that threshold, with just over +1.2 sigma in early 2003. Overall, I would rank it just barely in the top 10 El Niño events of the last half century. In its evolution, it bears some resemblance to the 1965-67 event (highest temporal correlation), but shared with 1991-93 its reluctance to drop below the zero line once it had run its course. The El Niño event of 2006-07 reached a similar peak as the 2002-03 event, but lacked ‘staying power’, and collapsed in early 2007. The most recent event (2009-10) will replace 2002-03 in this comparison figure by the middle of 2011. Click on the “Discussion” button below to find the comparison of 2010 MEI conditions against several strong La Niña events.

The six loading fields show the correlations between the local anomalies and the MEI time series. Land areas as well as the Atlantic are excluded and flagged in green, while typically noisy regions with no coherent structures and/or lack of data are shown in grey. Each field is denoted by a single capitalized letter and the explained variance for the same field in the Australian corner.
The sea level pressure (P) loadings show the familiar signature of the Southern Oscillation: low pressure anomalies in the west and high pressure anomalies in the east correspond to negative MEI values, or La Niña-like conditions. Consistent with P, U shows positive loadings along the Equator, corresponding to easterly anomalies near the dateline. Negative loadings in the far western and eastern Pacific, as well as to the south of the positive loading center, show that westerly anomalies are almost equally pervasive in these regions during La Niña. The meridional wind field (V) features high negative loadings north of the Equator, denoting the northward shift of the ITCZ so common during La Niña conditions, juxtaposed with even stronger positive loadings northeast of Australia.
Both sea (S) and air (A) surface temperature fields exhibit the typical ENSO signature of a wedge of positive loadings stretching from the Central and South American coast to the dateline, or cold anomalies during a La Niña event. They are flanked by negative loadings (warm anomalies during La Niña conditions) to its southwest and, to a lesser degree, to its northwest. At the same time, total cloudiness (C) tends to be decreased over the central equatorial Pacific and on the northeastern flank of the South Pacific Convergence Zone (SPCZ), sandwiched in between increased cloudiness north of Australia and the eastern-most equatorial Pacific.
Now just past its annual peak, the MEI explains 31.6% of the total variance of all six fields in the tropical Pacific from 30N to 30S. Although its temperature components dominate the MEI with over 40% of their possible variance, even P, V, and C join in with about a third, a quarter, and a fifth of their variance, respectively, at or close to their peak values during the year. Thirteen years ago, when the MEI was introduced to the Internet, the explained variance for Dec-Jan 1950/51-1997/98 peaked amounted to 32.7%. This slight drop-off reflects the diminished coherence and importance of ENSO events in the last 13 years, bottoming out just two years ago with 30.9%. The loading patterns shown here resemble the seasonal composite anomaly fields of Year 1 in Rasmusson and Carpenter (1982).

Consistent with full-blown strong La Niña conditions, all of the key anomalies in the MEI component fields that exceed or equal one standard deviation, or one sigma (compare to loadings figure), flag typical La Niña features, while no comparable El Niño-like features reach the opposite one sigma threshold. Significant negative anomalies (coinciding with high positive loadings) denote strong negative sea level pressure (P) anomalies over the Maritime Continent (down to -3.2 standard deviations west of Australia), significant easterly anomalies (U) along the Equator and centered on the dateline, significant northerly anomalies east of Fiji, while both sea surface (S) and air temperature (A) anomalies continue at or above -1 sigma in the central and eastern tropical Pacific basin. Significant positive anomalies (coinciding with high negative loadings) denote significant positive sea level pressure (P) anomalies over the eastern subtropical Pacific, significant westerly anomalies (U) along the Pacific coast of Mexico, as well as over western Indonesia where they reach +3.4 sigma, significant southerly anomalies (V) are found west of Hawaii, and northeast of New Guinea where they reach +2.1 sigma, warm sea surface (S) and air temperatures (S) reach almost two sigma east of Australia and west of Hawaii, and significantly increased cloudiness (C) covers the western Pacific and the eastern-most equatorial Pacific where it reaches +2.3 sigma.
Again, all of these cardinal anomalies flag La Niña conditions. The only missing key anomaly is cloudiness over the central equatorial Pacific (which should be suppressed, but is not).
Go to the discussion below for more information on the current situation.
If you prefer to look at anomaly maps without the clustering filter, check out the climate products map room.
Discussion and comparison of recent conditions with historic La Niña events

In the context of the rapid transition of the MEI into strong La Niña conditions, this section features a comparison figure with strong La Niña events that all reached at least minus one standard deviations by June-July, and a peak of at least -1.4 sigma over the course of an event. The most recent moderate La Niña events of 1998-2001 and 2007-09 did not qualify, since they either did not reach the required peak anomaly (the first one) or became strong too late in the calendar year (both).
The updated (December-January) MEI value has strengthened slightly to -1.62 standard deviations after almost dropping below -2 standard deviations in August-September. Nevertheless, the most recent value ranks 2nd for this time of year, clearly below the 10%-tile threshold for strong La Niña MEI rankings , but slightly weaker than the value recorded in 1974. If one were to take the average of all MEI rankings since July-August (a six-month period), the strongest La Niña half-year periods of mid-55, ’73-74, and late ’75 averaged slightly stronger than the current event, for now (this is means Rank 4 for the current event, up one from last month).
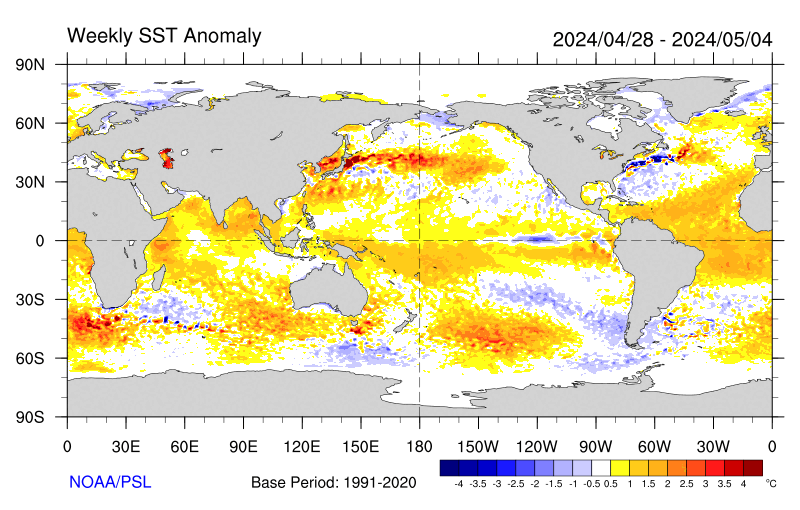
Negative SST anomalies are covering much of the eastern (sub-)tropical Pacific in the latest weekly SST map. Many of these anomalies are in excess of -1C.
For an alternate interpretation of the current situation, I highly recommend reading the latest NOAA ENSO Advisory which represents the official and most recent Climate Prediction Center opinion on this subject. In its latest update (6 January 2011), La Niña conditions are expected to last “well” into the Northern Hemisphere spring of 2011.
There are several other ENSO indices that are kept up-to-date on the web. Several of these are tracked at the NCEP website that is usually updated around the same time as the MEI, not in time for this go-around. Niño regions 3 and 3.4 showed persistent anomalies above +0.5C from June 2009 through April 2010, with a peak of +1.6C for Niño 3 and +1.8C for Niño 3.4 in December 2009, only to drop to about -0.5C or lower in both regions by early June 2010, reaching just shy of -1.0C for the month of July, and near -1.5C since October for both Niño 3 and 3.4 anomalies.
One only has to go back to the La Niña winter of 2007-08 to find seasonal Niño 3.4 anomalies that were lower than this year’s, hence the reluctance of Niño 3.4-based classifications to call this event a ‘strong’ event. Nevertheless, the weekly SST anomalies in January 2011 were consistently at or below -1.5C, so that the three-month average should ‘qualify’ for the strong category based on Niño 3.4 SST. For extended Tahiti-Darwin SOI data back to 1876, and timely monthly updates, check the Australian Bureau of Meteorology website. This index has often been out of sync with other ENSO indices in the last few years, including a jump to +10 (+1 sigma) in April 2010 that was ahead of any other ENSO index in announcing La Niña conditions. After a drop to +2 in June, July rebounded to +20.5, followed by values between +16 (November) and +27 (December), including +20 in January 2011. The last time that this index showed higher values for the average of any six months was during the same half-year in 1917(!), so any SOI-based classification would classify this event as one the second-strongest event of the last century. An even longer Tahiti-Darwin SOI (back to 1866) is maintained at the Climate Research Unit of the University of East Anglia website, however with less frequent updates (currently through March 2010). Extended SST-based ENSO data can be found at the University of Washington-JISAO website, currently updated through May 2010 (which ended up just slightly below the long-term mean value).
Stay tuned for the next update (by March 5th) to see where the MEI will be heading next. While La Niña conditions are guaranteed well into 2011, it remains to be seen whether it can rally once more to cross the -2 sigma barrier, and/or whether it will indeed last into 2012, as discussed six months ago on this page.
I believe the odds for a two-year event remain well above 50%, made even more likely by the continued unabated strength in various ENSO indices.
REFERENCES
- Rasmusson, E.G., and T.H. Carpenter, 1982: Variations in tropical sea surface temperature and surface wind fields associated with the Southern Oscillation/El Niño. Mon. Wea. Rev., 110, 354-384. Available from the AMS.
- Wolter, K., 1987: The Southern Oscillation in surface circulation and climate over the tropical Atlantic, Eastern Pacific, and Indian Oceans as captured by cluster analysis. J. Climate Appl. Meteor., 26, 540-558. Available from the AMS.
- Wolter, K., and M.S. Timlin, 1993: Monitoring ENSO in COADS with a seasonally adjusted principal component index. Proc. of the 17th Climate Diagnostics Workshop, Norman, OK, NOAA/NMC/CAC, NSSL, Oklahoma Clim. Survey, CIMMS and the School of Meteor., Univ. of Oklahoma, 52-57. Download PDF.
- Wolter, K., and M. S. Timlin, 1998: Measuring the strength of ENSO events – how does 1997/98 rank? Weather,53, 315-324. Download PDF.
h/t to WUWT reader FergalR
LazyTeenager says:
February 5, 2011 at 11:29 pm
———————————-
LazyTeenager-
Personally, I agree with you comments.
How you tried posting your comments at RC or Joe R’s Blog of Horror?
R. Shearer says:
February 5, 2011 at 9:42 am
The arguments of warmists like JP Miller and PeterT increasingly appear to attempt to convince people that….
Although it doesn’t matter much, let me set the record straight: I am not a warmist, and cannot quite imagine how my comment could be interpreted that way. I said nothing to try to convince anyone of anything other than Stephen Wilde’s theories seem quite detailed and testable, leading me to ask if any scholars had taken it up and investigated it specifically.
Richard Holle
February 5, 2011 at 11:54 am
Most of you no longer pay any attention to my posts.
Richard
There is such a thing as a stunned silence. 😉
This has been a very strong La Nina and should double dip, with the second half being weaker.
A benign sun should technically produce more low level cloud, which presents an opportunity to prove Sol is not just a bit player. As long as there are no volcanic eruptions to blur falling temperatures, we have a perfect test bed.
Wow! Was my comment misunderstood! What I was trying to say, without success, obviously, is that it would be nice to have closely-argued physics and climate-based theory, supported by data, effectively demonstrating climate variation to be the result of non-CO2 factors, (e.g., Milankovitch cycles, TSI, cosmic rays, ozone chemistry, non-man-made aerosols, clouds, ENSO, PDO, AMO, etc., etc.).
We don’t have that. We have data and handwaving, which is what most of climatology consists of, warmist and skeptic alike — analogous to epidemeology in medicine. Lots of data and handwaving. Useful science, possibly; just not conclusive.
The two theories I am aware of that seem to make a comprehensive physically-entailed statement about “here’s what controls temps over decadel (or somewhat more) time-period” (no doubt there are more — and it depends upon what one considers “comprehensive physically-entailed) are Lindzen’s Iris Effect (evidence not conclusive) and Svensmark’s Cosmic Ray theory (evidence not conclusive). Most other “skeptic theories” seem to me more like handwaving than closely-argued physics. I was simply asking Stephen Wilde if any scientists had noticed/ taken seriously his theory. (If so, I’d like to read the research. If not, I’d be curious as to why not.)
Before I go on, let me state clearly: I’m not convinced those who argue that CO2 is a major contributor to increasing global temperatures have generated data that conclusively reject their null hypothesis.
My view, quite simply, is: we need more data and more theories and more analysis. Unfortunately, so little funding goes to research that does not explore the role of CO2, that it is difficult to put together the long chain of linking theories and data needed to reject our null hyupothesis (i.e., increasing CO2 contributes meaningfully to increasing temperatures).
I suppose from a public policy perspective it is useful to point out that warmists have essentially argued from ignorance and thus have not rejected their null hypothesis. I don’t think that discussion advances the science or our knowledge much, however.
LazyTeenager says: February 5, 2011 at 11:29 pm
If you ever get to visit Asia look up at the sky; you can’t see it. It’s not much better in the USA or Europe.
Get some glasses. I can not only see the sky, but 150 miles on a typical day, in the USA.
Klaus
Your link to COADS via NOAA is broken
http://www.esrl.noaa.gov/psd/coads/
Is this one to ICOADS a suitable replacement?
http://icoads.noaa.gov/index.shtml
Just a couple of more charts on cloudiness from the monthly climate bulletin linked by FergalR above.
First, the Outgoing Longwave Radiation which is partly a measure of how warm a region is compared to the average Earth but more related to where the clouds were holding the OLR in. The Pacific was way above normal in December, especially the International Dateline area (+50 watts/m2 is a big number). We can also see that Indonesia and Australia and North Indian Ocean were mostly cloud covered in December.
http://www.cpc.ncep.noaa.gov/products/CDB/Tropics/figt25.gif
Then the precipitation anomalies, an even better measure of cloudiness. Indonesia, Australia and Northern Indian Ocean got dumped on in December. The north equatorial counter-current at 8N also had convection clouds. The equatorial Pacific and especially the International Dateline area saw little if any rain in December.
http://www.cpc.ncep.noaa.gov/products/CDB/Tropics/figt26.gif
This pattern has been there for about the last 6 months.
http://cawcr.gov.au/staff/mwheeler/maproom/OLR/hov.last6mths.anom.EQ.gif
This is exactly the weather pattern caused by a La Nina. In an El Nino, many of the variables are reversed although one could always expect the patterns to shift by a few hundred kms from event to event and vary in intensity.
LazyTeenager says:
February 5, 2011 at 11:36 pm
referring to a post of mine:———-
But what if you are wrong and that it is a problem. Remember we have not seen much warming yet. The temperature can go a lot higher. If this effects agriculture then your standard of living argument fails on the simple principle: you can’t eat a refrigerator.
/////////////////////////////////////////
You are right that we have not seen much warming yet no doubt because because CO2 does not drive temperatures or the sensitivity to CO2 is far less than the IPCC suggest.
If I am wrong we simply adapt. There is no fundamental problem to adapting. You cannot grow crops in the antartic but you can grow crops in the desert. However, the reality is that Africa is not the food basket of the world. If it gets slightly warmer there, it will not be an insurmountable problem for food production. The food basket of the world is in the Northern Hemishere. It may be that this will shift marginally to higher latitudes, but again this is not a problem.
The point is simple, consider the position where we throw trillions of dollars at curbing CO2 and we pull back the industrialisation of developed countries and we prevent developing countries from inductrialising, only to find that CO2 does not drive tempreratures and notwithstanding a reduction in CO2 levels, the world continues to warm. This warming being due to natural variation. Lets for the sake of argument assume that a warmer world causes severe problems (something I consider incredibly unlikely). We now have a major problem.
The problem is: we have already spent trillions of dollars on unsuccessfully mitigating (through reducing CO2 emissions which turned out to be useless). We are now financially bankrupt. Industrialisation in developed countries has been cut back and therefore is not in any event in a position to quickly mobilise resources necessary for adapation. We have prevented the developing world from developing so they too are not in a position to mobilise resources necessary for adaption. So required adaption is now extremely difficult.
If on the other hand, we do not spend those trillions of dollars and if we do not hinder industrialisation in developed countries and we allow developing countries to develop, and IF the world continues to warm and IF that warming causes severe problems, we are in a position to easily adapt. We will have the financial means and we will be able to throw the might not only of the present developed nations but also the might of the developing nations which have now developed behind the steps needed to adapt.
The history of humankind has shown that as a species we are particularly adept at adapting. Better at this than at mitigating. The ingunity of man will easily overcome any problems that may arise.
There is also an additional benefit of the do nothing and adapt policy. First all those in the developing countries will enjoy the benefits which we take for granted. Their standard of living will dramatically improve. Second, if the world continues to warm and if this is beneficial (as I believe it will be), there will be little need to spend any money or resources on adapating (since relatively little adaption will be required) and the whole world will be able to bask in the benefit of a warmer globe.
In the meantime we should simply act sensibly. Better manage our water resources, not build on flood planes and adopt less poluting technologies only when properly developed and financially sustainable.
Richard Holle: February 5, 2011 at 11:54 am
Most of you no longer pay any attention to my posts.
I have been to your site. The weather projections seem pretty good. It appears you are on to a piece of the puzzle that is largely (totally?) ignored in the field of weather/climate. Whether you are looking at a first cause, or a symptom of one, it seems important to me.
J P Miller said:
“Wow! Was my comment misunderstood!”
Yes, JP, I was surprised by the reaction since I took it in the way you intended and saw no offence.
As regards your query my hypothesis has been developing over time and has been adapted as those who know more than me criticised my intitial propositions.
However with each successive adaptation it has been getting closer to real world observations and if this recent cloudiness observation is correct then that is another step forward. I’m waiting to hear Bob Tisdale’s response to Bill Illis’s comment. Bob is clear that the expected recharge is not taking place which is exactly what I would expect with a quiet sun and more equatorward jets.
As regards it being followed up by an established climate scientist then I would be only too pleased if that were to happen but it takes time to get noticed and it is early days yet.
I think that where Steven makes his mistake with the Stratosphere is in failing to determine what disturbs it from both sides of this ethereal layer. His focus is on external (read “solar”) influences and downward only propagation. However, the Earth’s highly variable and oscillating atmosphere from below is also quite capable of disturbing the Stratosphere above it, which will then propagate this disturbance downward.
Stephen, what would have been your solar thesis back in the 50’s when we experienced on-the-ground conditions similar to today?
http://europa.agu.org/?uri=/journals/rg/RG012i003p00329.xml&view=article
I’m no fan of CO2 caused warming. But I am no fan of a solar driver either. I find this synopsis of a solar-climate connections to be a worthwhile read.
http://www.aip.org/history/climate/solar.htm
LazyTeenager, you are utterly and entirely wrong about global warming being detrimental to agriculture. Every farmer (and I manage a family ranch) I know dreads global cooling. Every one of them. No exceptions. They all wish global warming to continue. All agriculture universities I know spend far more resources instructing students on how to grow a vast variety of crops in warm weather (and always have), and simply state that if your farm is in Minnesota, one should buy yearly insurance against cold weather. Cold weather is detrimental to the production of food. Warm weather enhances it. Case closed.
Pamela,
If you read more of my work you will see that I propose a bottom up oceanic influence too with the jets responding to both forces as each ebbs and flows.
As regards the mid 20th century cooling period I have already proposed several times that the cool PDO phase offset the effect of the active sun especially during the slightly less active solar cycle 20.
Note that I say that the sun pushes or pulls the jets latitudinally from above and the oceans push or pull the jets latitudinally from below.
Once the jets shift they affect total cloudiness, global albedo and the net solar energy input to the oceans.
I believe that the albedo effect of air circulation system changes is a better solution to the problem than either Lindzen’s iris effect or Svensmark’s cosmic ray effects.
I point to the Earthshine project as supporting evidence. Global cloudiness and albedo decreased up to the late 90s and increased thereafter.
Around 2000 I noted that the jets were becoming less zonal. The current degree of jetstream meridionality has been building up for 10 years now but only recently has it become obvious to all.
Thankyou Pamela Gray for that historical link, it opened my eyes on the climate/sun connection.
This was the sum up from that long piece that Pamela linked to:
” But what if the planet really did react with extreme sensitivity to almost imperceptible changes in the radiation arriving from the Sun? The planet would surely also be sensitive to greenhouse gas interference with the radiation once it entered the atmosphere.”
And the answer is ‘not necessarily’.
When the sun changes cloudiness and albedo in the way I have described the effect is very large because the jets seem to move latitudinally some 1000 miles or so latitudinally over the 500 year intervals from MWP to LIA and then to date.
So the issue is as to how far a bit more human CO2 would shift the jets.
The answer seems to be, imperceptibly in comparison, because the extra CO2 doesn’t participate in the photochemical reactions in the upper atmosphere that lead to a change in the vertical temperature profile. It requires the special physical properties of photons and particles arriving from the sun to do that.
The CO2 effects are purely radiative and easily dealt with by a tiny adjustment to the system.
The increase in CO2 over the past 150 years seems to have done nothing to offset the cloudiness and albedo effects caused by the changes in solar activity recently whereby the falling trend in cloudiness and albedo up to 1998 or thereabouts was reversed with more meridional jets just as the sun started to become less active and the jets started to become less zonal.
This is a useful point at which to refer again to the 2001 paper by Shindell, Mann et al which inter alia said as follows:
“They determined that a dimmer Sun reduced the model’s westerly winds, cooling the continents during wintertime. Shindell’s model shows large regional climate changes,”
and:
“The period of low solar activity in the middle ages led to atmospheric changes that seem to have brought on the Little Ice Age”
But then having got it exactly right they ignored the high solar cycles 17 through 23 and said this:
“However, we need to keep in mind that variations in solar output have had far less impact on the Earth’s recent climate than human actions,” Shindell said. “The biggest catalyst for climate change today are greenhouse gases,” he added.”
I think that recent events are demonstrating that their unexplained discounting of the obvious led them to an incorrect conclusion.
I forgot to post the link:
http://www.giss.nasa.gov/research/news/20011206/
It also says:
“During those periods of low solar activity, levels of the Sun’s ultraviolet radiation decrease, and can significantly impact ozone formation in the stratosphere. “The changes in ozone that we modeled were key in producing the enhanced response,” Shindell said. “The changes in the upper atmosphere then feed down to the surface climate.”
Well given that they fully accepted the photochemical nature of the solar effects why did they assume that the purely radiative effects of a bit more CO2 would more than offset it?
I think they should be asked for an answer.
Stephen Wilde says: “I’m waiting to hear Bob Tisdale’s response to Bill Illis’s comment.”
Which comment? I’ve already replied to his initial comment with a question.
You continued, “Bob is clear that the expected recharge is not taking place which is exactly what I would expect with a quiet sun and more equatorward jets.”
The “quiet sun” is a given. Please provide documentation with accompanying data of the “more equatorward jets.”
Stephen Wilde says: “Essentially you are suggesting that a recharge process is going on whereas Bob Tisdale suggests that the recharge process is failing.”
I did? Please quote me chapter and verse.
It took a 3-year La Nina to recharge the tropical Pacific OHC after the 1997/98 EL Nino, Stephen, and the sun wasn’t “quiet” at that time. The 2010/11 La Nina is only halfway done. I don’t see any failure. So far the 2010/11 La Nina has not recharged fully, but it is being recharged:
http://www.pmel.noaa.gov/tao/elnino/wwv/gif/wwva_std.gif
How does that fit into your conjectures?
OK .. so which is it.
The Article from Wolter states that equatorial cloudiness should be suppressed but it’s not. Crosspatch comments on this puts up noaa site having something to do with recharge of the area. We have Steven saying something about jets increasing the cloudiness …. and we have Bill saying the sky is clear as a bell, and that all is reacharging. Steve ask Bob T about the question of Crosspatch to him about the cloudiness issue ……. who’s on first, what’s on second and I don’t know is in center field ……
SO .. which is it. Is the cloud cover for this La Nina unusual, or is it normal??
J P Miller said:
“Wow! Was my comment misunderstood!”
—————————————
Apparently, the inferences some of us drew from your comment were not what you intended to convey.
I certainly apologize for mistaking you for a warmer, but I can tell you why I did.
It was your implication that the orthodoxy has a theory that appears coherent not only to themselves but also to sceptics. Obviously, if I don’t agree with them, then I think there’s something incoherent in their narrative.
Furthermore, characterizing scepticism as flawed if it doesn’t have a complete alternate theory seems an odd demand to place on disbelief.
If this was merely an observation on the political level that we will not sway others, then you’re probably right.
In the end, however, the proof of the pudding is in the heating, or lack thereof.
These people have come to my door selling a product that I’m not buying.
I’m sorry for thinking you one of them, although I’m sure they’re all very nice people.
Bob Tisdale says:
February 6, 2011 at 5:37 pm
…………..
Hi Mr Tisdale
Is there a link for the pre 1950 ENSO monthly or annual data file ?
Deanster says: “SO .. which is it. Is the cloud cover for this La Nina unusual, or is it normal??”
There isn’t a reliable cloud amount/cloud cover dataset that’s updated monthly, so we have to rely on proxies. Based on tropical Pacific Precipitation Anomalies (24S-24N, 160E-90W) for the area east of the Pacific Warm Pool, it looks like cloud cover is where one would expect it for a La Nina:
http://oi53.tinypic.com/21dk1w7.jpg