
Guest post By Joseph D’Aleo, CCM, AMS Fellow
Mother Nature for the second year in a row is sending a message to alarmists in the government and the media.
Another snowstorm has swept across the nation and focused its fury on the northeast corridor. Last year it was the Mid-Atlantic, the political center that was ground zero. This year ground zero is further north from New York City (the nation’s media center) into southern New England. In Connecticut, Hartford has had the snowiest January and month ever.
Since Dec. 14, snow has fallen eight times on the New York region – or an average of about once every five days.
In New York City, the third major snowstorm dropped 19 inches, the 8th heaviest snowstorm in history (back to 1869/70). The post Christmas blizzard brought dropped 20 inches, the sixth heaviest snowstorm. The blizzard paralyzed travel after Christmas.
SXUS71 KOKX 272202

RERNYC

RECORD EVENT REPORT

NATIONAL WEATHER SERVICE NEW YORK NY

502 PM EST THU JAN 27 2011

...RECORD DAILY MAXIMUM SNOWFALL SET AT CENTRAL PARK NY...

 A RECORD SNOWFALL OF 6.7 INCH(ES) WAS SET AT CENTRAL PARK NY TODAY.

THIS BREAKS THE OLD RECORD OF 6.5 SET IN 1894.
SXUS71 KOKX 270631

RERLGA

RECORD EVENT REPORT

NATIONAL WEATHER SERVICE NEW YORK NY

128 AM EST THU JAN 27 2011

...RECORD DAILY MAXIMUM SNOWFALL SET AT LAGUARDIA NY...

 A RECORD SNOWFALL OF 9.4 INCHES WAS SET AT LAGUARDIA NY YESTERDAY.

THIS BREAKS THE OLD RECORD OF 5 SET IN 1994.


SXUS71 KOKX 270631

RERJFK

RECORD EVENT REPORT

NATIONAL WEATHER SERVICE NEW YORK NY

128 AM EST THU JAN 27 2011

...RECORD DAILY MAXIMUM SNOWFALL SET AT KENNEDY NY...

 A RECORD SNOWFALL OF 6 INCHES WAS SET AT KENNEDY NY YESTERDAY. THIS

BREAKS THE OLD RECORD OF 3.3 SET IN 1994.
[See below for cumulative snow reports]
Earlier in 2010 on February 25-26th, the 20.9 inches was enough to put it in fourth place among Central Park snow events.
A storm on the 10th and 11th of January brought 9.1 inches. So far 56.1 inches has fallen which puts 2011 already in 6th place among all years since snow records began.
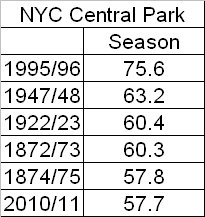
More light snow events and continued cold temperatures is forecast the next 5 or 6 days. I believe another storm will threaten next Wednesday and Thursday that could move the year into second or third place. I believe this season will eventually surpass 1995/96.
The media has been trying to find a way to blame global warming for the snow. Actually a rapid COOLING (the UAH January global number may be negative down almost a whole degree F since the warm peak after the El Nino during 2010) is likely to blame. The cooling the last several months my be they most significant of the satellite record. Clouds and precipitation always result from cooling processes. The cooling as we have posted is likely due to a Pacific that has turned cold, a La Nina, continued slow ramp up of feeble solar cycle 24 and a series of high latitude volcanoes that together with a quiet sun and a warm Atlantic helped support high latitude blocking high pressure (a negative Arctic Oscillation – the most negative on record last winter and continued negative most of the first 8 weeks this winter).
This video from last night gives you the flavor of the NYC snow although at one time there was lightning and thunder and near zero visibility snow.
================================================================
Be sure to visit Joe’s website: ICECAP.US and bookmark it.
Here’s the snowfall report from NWS NYC:
NOUS41 KOKX 271800

PNSOKX

CTZ005>012-NJZ002-004-006-103>108-NYZ067>075-078>081-176>179-280551-

PUBLIC INFORMATION STATEMENT

SPOTTER REPORTS

NATIONAL WEATHER SERVICE NEW YORK NY

1259 PM EST THU JAN 27 2011

THE FOLLOWING ARE UNOFFICIAL OBSERVATIONS TAKEN DURING THE PAST 13

HOURS FOR THE STORM THAT AFFECTED OUR REGION. APPRECIATION IS

EXTENDED TO HIGHWAY DEPARTMENTS...COOPERATIVE OBSERVERS...SKYWARN

SPOTTERS AND MEDIA FOR THESE REPORTS. THIS SUMMARY IS ALSO AVAILABLE

ON OUR HOME PAGE AT WEATHER.GOV/NYC

********************STORM TOTAL SNOWFALL********************

LOCATION          STORM TOTAL     TIME/DATE   COMMENTS

                     SNOWFALL           OF

                     /INCHES/   MEASUREMENT

CONNECTICUT

...FAIRFIELD COUNTY...

   NORWALK               18.0  1025 AM  1/27  PUBLIC

   NEW CANAAN            18.0   530 AM  1/27  TRAINED SPOTTER

   DARIEN                18.0   800 AM  1/27  CT DOT

   WILTON                17.3  1115 AM  1/27  PUBLIC

   WEST NORWALK          17.0   110 AM  1/27  PUBLIC

   WESTON                16.5   800 AM  1/27  TRAINED SPOTTER

   GREENWICH             16.0   720 AM  1/27  DPW

   WESTPORT              14.8   830 AM  1/27  SKYWARN SPOTTER

   RIDGEFIELD            14.0   600 AM  1/27  PUBLIC

   SHELTON               13.0   215 AM  1/27  SKYWARN SPOTTER

   DANBURY               13.0   215 AM  1/27  SKYWARN SPOTTER

   BRIDGEPORT            13.0   600 AM  1/27  COOP OBSERVER

...MIDDLESEX COUNTY...

   HADDAM                15.0  1000 AM  1/27  CT DOT

   MIDDLETOWN            15.0   535 AM  1/27  PUBLIC

   OLD SAYBROOK          15.0  1000 AM  1/27  CT DOT

...NEW HAVEN COUNTY...

   NORTH HAVEN           18.5   605 AM  1/27  PUBLIC

   MILFORD               16.3   800 AM  1/27  CT DOT

   NEW HAVEN             16.0   800 AM  1/27  CT DOT

   BRANFORD              15.0   554 AM  1/27  PUBLIC

   NAUGATUCK             13.0  1020 AM  1/27  PUBLIC

   SOUTHBURY             12.5   440 AM  1/27  SKYWARN SPOTTER

   WATERBURY             11.5   600 AM  1/27  CT DOT

   BEACON FALLS          10.5   600 AM  1/27  CT DOT

   MERIDEN                9.0   400 AM  1/27  CT DOT

...NEW LONDON COUNTY...

   LISBON                17.5   702 AM  1/27  TRAINED SPOTTER

   COLCHESTER            16.0   800 AM  1/27  CT DOT

   GROTON                13.8  1000 AM  1/27  CT DOT

   NORTH FRANKLIN        13.5   625 AM  1/27  PUBLIC

   GALES FERRY           12.5   717 AM  1/27  SKYWARN SPOTTER

   NORWICH               10.5   800 AM  1/27  CT DOT

   LEDYARD CENTER        10.0   900 AM  1/27  PUBLIC

   UNCASVILLE             9.0   320 AM  1/27  PUBLIC

NEW JERSEY

...BERGEN COUNTY...

   GARFIELD              16.6  1038 AM  1/27  PUBLIC

   NORTH ARLINGTON       16.5   700 AM  1/27  SKYWARN SPOTTER

   EAST RUTHERFORD       15.5   400 AM  1/27  NJ DOT

   LODI                  15.0  1119 AM  1/27  PUBLIC

   1 W TENAFLY           14.6   700 AM  1/27  COCORAHS

   PARAMUS               12.5   400 AM  1/27  NJ DOT

   ORADELL               12.2  1015 AM  1/27  TRAINED SPOTTER

   SADDLE BROOK          12.1   700 AM  1/27  COCORHAS

   RIDGEWOOD             11.7   700 AM  1/27  SKYWARN SPOTTER

   RIVERVALE             11.5   600 AM  1/27  PUBLIC

   HARRINGTON PARK       11.0   700 AM  1/27  SKYWARN SPOTTER

   WASHINGTON TOWNSHIP    9.0   700 AM  1/27  SKYWARN SPOTTER

   MAHWAH                 8.9   900 AM  1/27  SKYWARN SPOTTER

...ESSEX COUNTY...

   NEWARK AIRPORT        18.9   615 AM  1/27  FAA CONTRACT OBSERVER

   BLOOMFIELD            16.5   340 AM  1/27  PUBLIC

   BELLEVILLE            15.6   200 AM  1/27  TRAINED SPOTTER

   WEST ORANGE           14.2   330 AM  1/27  PUUBLIC

   VERONA                14.0   200 AM  1/27  PUBLIC

   CEDAR GROVE           13.2   410 AM  1/27  PUBLIC

...HUDSON COUNTY...

   N HARRISON            17.0   600 AM  1/27  COCORAHS

   JERSEY CITY           16.0   400 AM  1/27  NJ DOT

   HARRISON              15.0   400 AM  1/27  TRAINED SPOTTE

...PASSAIC COUNTY...

   CLIFTON               19.0   400 AM  1/27  NJ DOT

   WAYNE                 10.5   600 AM  1/27  TRAINED SPOTTER

   HAWTHORNE             10.1   825 AM  1/27  SKYWARN SPOTTER

   RINGWOOD               9.2   700 AM  1/27  SKYWARN SPOTTER

...UNION COUNTY...

   RAHWAY                19.5  1030 AM  1/27  PUBLIC

   ROSELLE               17.9   430 AM  1/27  TRAINED SPOTTER

   ELIZABETH             17.7   700 AM  1/27  TRAINED SPOTTER

   UNION                 17.0   400 AM  1/27  NJ DOT

   1 NNW WESTFIELD       16.7   700 AM  1/27  COCORAHS

   WESTFIELD             13.0   650 AM  1/27  TRAINED SPOTTER

   CLARK                 12.0   400 AM  1/27  NJ DOT

NEW YORK

...BRONX COUNTY...

   PELHAM PARKWAY HOUSE  18.0   400 AM  1/27  TRAINED SPOTTER

   PARKCHESTER           16.3   630 AM  1/27  COOP OBSERVER

   BRONX                 14.7   620 AM  1/27  PUBLIC - BRONX ZOO

   BEDFORD PARK          13.1  1230 AM  1/27  PUBLIC

...KINGS COUNTY...

   MARINE PARK           17.5   800 AM  1/27  PUBLIC

...KINGS (BROOKLYN) COUNTY...

   SHEEPSHEAD BAY        13.0   600 AM  1/27  TRAINED SPOTTER

...NASSAU COUNTY...

   WOODMERE              16.4  1000 AM  1/27  PUBLIC

   LONG BEACH            15.9   600 AM  1/27  TRAINED SPOTTER

   BETHPAGE              15.5   600 AM  1/27  TRAINED SPOTTER

   PLAINVIEW             15.0   500 AM  1/27  SKYWARN SPOTTER

   GARDEN CITY           14.8   600 AM  1/27  PUBLIC

   MERRICK               14.2   700 AM  1/27  SKYWARN SPOTTER

   VALLEY STREAM         14.2   900 AM  1/27  PUBLIC

   SYOSSET               14.0   400 AM  1/27  NWS EMPLOYEE

   FLORAL PARK           14.0   345 AM  1/27  TRAINED SPOTTER

   LEVITTOWN             14.0   545 AM  1/27  PUBLIC

   NORTH MASSAPEQUA      12.5   915 AM  1/27  SKYWARN SPOTTER

   OCEANSIDE             12.0   600 AM  1/27  TRAINED SPOTTER

   MASSAPEQUA            11.0   630 AM  1/27  SKYWARN SPOTTER

   BALDWIN HARBOR         9.2   600 AM  1/27  TRAINED SPOTTER

...NEW YORK COUNTY...

   CENTRAL PARK          19.0   630 AM  1/27  CENTRAL PARK ZOO

...ORANGE COUNTY...

   HARRIMAN               8.2  1200 AM  1/27  TRAINED SPOTTER

   NEW WINDSOR            7.2   630 AM  1/27  PUBLIC

   MOUNTAIN LODGE PARK    7.0  1035 AM  1/27  SKYWARN SPOTTER

   SOUTH BLOOMING GROVE   6.5   927 AM  1/27  SKYWARN SPOTTER

   1 NNW CORNWALL ON HU   6.5   700 AM  1/27  COCORAHS

   MIDDLETOWN             5.4   245 AM  1/27  PUBLIC

   GOSHEN                 5.0   647 AM  1/27  SYWARN SPOTTER

   MOUNT HOPE             4.3   830 AM  1/27  PUBLIC

   NEWBURGH               2.0   820 AM  1/27  SYKWARN SPOTTER

...PUTNAM COUNTY...

   MAHOPAC               11.0   900 AM  1/27  SKYWARN SPOTTER

   4 ESE BEACON           8.5   700 AM  1/27  COCORAHS

   8 NE COLD SPRINGS      8.0   700 AM  1/27  COCORAHS

...QUEENS COUNTY...

   NYC/LA GUARDIA        17.3   615 AM  1/27  FAA CONTRACT OBSERVER

   BAYSIDE               17.3   800 AM  1/27  SKYWARN SPOTTER

   FRESH MEADOWS         16.2   230 AM  1/27  PUBLIC

   WOODSIDE              16.0   600 AM  1/27  TRAINED SPOTTER

   NYC/JFK AIRPORT       10.3   615 AM  1/27  ASOS

...RICHMOND COUNTY...

   GREAT KILLS           20.0  1000 AM  1/27  PUBLIC

   ELTINGVILLE           18.0   800 AM  1/27  PUBLIC

   STATEN ISLAND         15.0   500 AM  1/27  SKYWARN SPOTTER

...ROCKLAND COUNTY...

   STONY POINT            7.6   624 AM  1/27  TRAINED SPOTTER

...SUFFOLK COUNTY...

   CENTERPORT            16.5   600 AM  1/27  COOP OBSERVER

   NORTHPORT             16.5   600 AM  1/27  PUBLIC

   COMMACK               15.7   430 AM  1/27  PUBLIC

   EAST SETAUKET         15.5   510 AM  1/27  PUBLIC

   MEDFORD               15.4   700 AM  1/27  SKYWARN SPOTTER

   MELVILLE              15.0   800 AM  1/27  TRAINED SPOTTER

   SMITHTOWN             14.5  1000 AM  1/27  TRAINED SPOTTER

   PORT JEFFERSON        14.0   630 AM  1/27  PUBLIC

   SHOREHAM              13.7   625 AM  1/27  TRAINED SPOTTER

   ISLIP AIRPORT         13.7   700 AM  1/27  FAA CONTRACT OBSERVER

   NORTH BABYLON         13.5   615 AM  1/27  PUBLIC

   UPTON                 13.3   700 AM  1/27  NWS OFFICE

   STONY BROOK           13.1  1100 AM  1/27  TRAINED SPOTTER

   MOUNT SINAI           12.4   600 AM  1/27  PUBLIC

   SOUND BEACH           12.1   630 AM  1/27  PUBLIC

   CENTEREACH            12.0   730 AM  1/27  NWS EMPLOYEE

   PATCHOGUE             12.0   620 AM  1/27  NWS EMPLOYEE

   HOLBROOK              11.3   600 AM  1/27  PUBLIC

   LINDENHURST           10.9   540 AM  1/27  TRAINED SPOTTER

   AMITYVILLE            10.5  1050 AM  1/27  PUBLIC

   BABYLON               10.3   717 AM  1/27  SKYWARN SPOTTER

   RIVERHEAD              9.2   730 AM  1/27  NWS EMPLOYEE

   MATTITUCK              8.5   900 AM  1/27  NWS COOP

...WESTCHESTER COUNTY...

   HARRISON              16.0   610 AM  1/27  PUBLIC

   LARCHMONT             15.5  1000 AM  1/27  PUBLIC

   ARMONK                14.5   615 AM  1/27  PUBLIC

   PORT CHESTER          12.6   945 AM  1/27  PUBLIC

   MOUNT KISCO           12.0   350 AM  1/27  PUBLIC

   SCARSDALE             10.8   100 AM  1/27  TRAINED SPOTTER

   BEDFORD                8.1  1215 AM  1/27  PUBLIC

***********************STORM TOTAL ICE***********************

LOCATION          STORM TOTAL     TIME/DATE   COMMENTS

                          ICE           OF

                     /INCHES/   MEASUREMENT

CONNECTICUT

...FAIRFIELD COUNTY...

   WESTPORT              0.10   830 AM  1/27  SKYWARN SPOTTER

NEW YORK

...NASSAU COUNTY...

   MERRICK               0.15   700 AM  1/27  SKYWARN SPOTTER

...QUEENS COUNTY...

   BAYSIDE               0.10   800 AM  1/27  SKYWARN SPOTTER

...SUFFOLK COUNTY...

   BABYLON               0.25   717 AM  1/27  SKYWARN SPOTTER

   HOLBROOK              0.20   500 AM  1/27  PUBLIC

   STONY BROOK           0.12   110 AM  1/27  TRAINED SPOTTER

***********************PEAK WIND GUST***********************

LOCATION             MAX WIND     TIME/DATE   COMMENTS

                        GUST            OF

                         MPH    MEASUREMENT

CONNECTICUT

...FAIRFIELD COUNTY...

   BRIDGEPORT AIRPORT      40  1138 PM  1/26  ASOS

...NEW HAVEN COUNTY...

   NEW HAVEN               48  1216 AM  1/27  ASOS

   MERIDEN                 37  1231 AM  1/27  ASOS

...NEW LONDON COUNTY...

   GROTON                  44  1207 AM  1/27  ASOS

NEW JERSEY

...ESSEX COUNTY...

   NEWARK AIRPORT          40  1037 PM  1/26  ASOS

NEW YORK

...NASSAU COUNTY...

   FARMINGDALE             40   912 PM  1/26  ASOS

   NORTH MASSAPEQUA        35   725 PM  1/26  TRAINED SPOTTER - TSTM

...NEW YORK COUNTY...

   CENTRAL PARK            37   735 PM  1/26  ASOS

...QUEENS COUNTY...

   NYC/JFK AIRPORT         49   720 PM  1/26  ASOS - TSTM

   NYC/LA GUARDIA          40   733 PM  1/26  ASOS - TSTM

...RICHMOND COUNTY...

   STATEN ISLAND           55   720 PM  1/26  TRAINED SPOTTER - TSTM

...SUFFOLK COUNTY...

   WESTHAMPTON BEACH       52  1117 PM  1/26  ASOS

   SHIRLEY                 41  1117 PM  1/26  ASOS

...WESTCHESTER COUNTY...

   WHITE PLAINS            43   817 PM  1/26  ASOS

*****************MONTHLY SNOWFALL RECORDS******************

...SNOWIEST JANUARY ON RECORD...

...CLIMATE SITE...    ...OLD RECORD...     ...JANUARY 2011 TOTAL*...

CENTRAL PARK         27.4 INCHES (1925)          36.0 INCHES

NEWARK               31.6 INCHES (1996)          37.3 INCHES

LAGUARDIA            27.6 INCHES (1996)          32.4 INCHES

BRIDGEPORT           26.2 INCHES (1965)          41.8 INCHES

ISLIP                21.5 INCHES (2005)          34.2 INCHES

*MONTHLY SNOWFALL TOTALS AS OF 7 AM JANUARY 27 2011
Average total season snowfall today for Boston, MA is 19.3″.
Actual total season snowfall for 2010-2011 Winter in Boston, MA is 61.4″.
Departure from normal total season snowfall in Boston, MA is 42.1″.
We’re only 1 or 2 inches away from breaking the snowiest winter ever recorded!
Based on that guys comments, you would think most people would be in favor of global warming.
In Boston, this is shaping up to be another 1978. In ’78 we got several storms that did not melt and then a large nor’easter. Looking out into my back yard it is rumored that several piles of snow contain a car or three that we own. No melting temperatures of any sort forecast for a long time.
Well, it’s not as bad as the Sea of Okhotsk, where two ice breakers have been struggling to bring a 32,000 ton ship out of the ice since 31st December. 300 metres today & 20 miles to go. Of course, the trapped 300+ crew are of no interest to western media, because the world is warming and cold conditions are an anomaly.
http://eureferendum.blogspot.com/2011/01/three-hundred-metres.html
Al Baby, are you in area?
According to some bloke called Trenberth, last year’s US blizzards were down to El Nino!
“Blame it on El Niño!”
Steve Baragona | Washington, DC February 10, 2010
“US blizzards, Asia’s typhoons, other extreme weather all linked to Pacific Ocean anomaly”
http://www.voanews.com/english/news/special-reports/american-life/Blame-it-on-El-Nino-84040872.html
Suppose this year it is the little girl’s turn?
No need to replay “In Search Of the Coming Ice Age”.
Just tune into the nightly news.
Some States have exhausted thier snow removal budgets, and more are nearing the end of thier ropes.
That map’s a fake!
(there’s no red or yellow dots on it……;-)
Joe Romm Jan 2009 said warm and permanent dry winters. Hello JOE
In weather and climate we have feedback mechanisms. In forecasting, we should give feedback.
Is this the reason the Hockey Team spent so much time training in Hawaii?
The “Al Gore Effect” is live and well: http://meteorologicalmusings.blogspot.com/2011/01/global-warming-meeting-cancelled-due-to.html
I do hope Edward Markey’s district in MA is getting hit the hardest, again and again. They deserve to get hit hard. Let the AMO cycle and solar cycle divergence land on that district and then spin itself off to East Anglia.
ShrNfr says:
January 27, 2011 at 2:28 pm
78? There were only three storms of any consequence, at least anything before that got obliterated in most people’s memory.
A Jan 20 storm set a record for snow in 24 hours (25.1″), a couple weeks later a came the midwest’s Blizzard of ’78 that set an all-time low pressure record in Cleveland, but brought rain to a lot of the east coast. Then on Feb 6 came the start of the New England Blizzard of ’78 and people stopped using the 100 hour storm from 1969 as the living history yardstick. http://wermenh.com/blizz78.html
Hmm, I say the 24 hour record was broken again, but I must have something wrong, as I give 23.6″.
95-96 was a good season – 146.7″ in the Berkshires at Granville, MA. At the Blue Hills south of Boston, they had 144.4″, see http://www.bluehill.org/climate/annsnow.gif – there are several seasons with over 100″ there.
We should all take personal responsibility for climate change. Having decided to take responsibility, the action required is to minimise your personal impact, primarily through energy use but also through the foods that you eat.
NOTE: This is a SPAM ROBOT to link back to a site that sells solar power – ignore it – not a real person. I’m leaving this up so people know to ignore “it” on other sites as well.
Anthony
“The media has been trying to find a way to blame global warming for the snow. ”
Yes.
The main issue for the Warmista’s is Backradiation.
It is my opinion that backradiation is in conflict with the 2’nd law of termodynamics.
I must admit I was quite puzzled when I understood that Backradiation is the most important argument. It is THE ARGUMENT. It also puzzled me that I had never heard about this, and it contradicted every thing I had learned at school. But, yes, school was a long time ago.
It is also interesting to see that I am not alone. A professor at my old school is also of the opinion that it contradicts the 2’nd law. And since he is a Professor, and is much better at equations than I am, (I am below the cut-off frequency.) his writing on this might be of interest;
http://www.csc.kth.se/~cgjoh/blackbodyslayer.pdf
It’s just ‘local weather’, not climate — even though it takes up the ENTIRE northern hemisphere…
Hey Joe! Did you have the mute on when that video was playing? The wife is not happy that the kids heard it, although I must say I found it hilarious.
Anthony/Joe
1) Abdul is a robot advertising solar power gadgetry.
2) In the interest of completeness you should show the rain records that were on the original weather map. They complicate the story a bit but are part of this extreme weather story just as much as the record snows and lows.
“Can’t wait ’til summer!”
I hear ya, brother.
Climate change has caused my vision to deteriorate. I have become color blind. I cannot detect the red dots on that map yet I have been told by experts that they would be there.
Did the red dots already melt, or were they submerged by the rising seas?
Here in the D its been crazy… snow all the bloody time. Getting tired of it… although it is good for business (methane transport) so I’m not complaining, but we certainly don’t seem to be experiencing “global warming.”
And I have to ask, why again is global warming a bad thing again? Something about polar populations increasing and plant life growing better? Less snow and better crop wields maybe? Can’t seem to remember….
Abdul Rahim how, exactly, do you think human behaviour can effect the climate?
We can try to keep our personal environment clean by using less packaging and picking up after ourselves etc, but the hubris in thinking that we can control the sun, moon, tides and ocean currents is overwhelming.
my kids would like some snow. (highs in the 50’s this week.) We’re not as mild as last winter, but last year, spring didn’t arrive (first 75F day) until towards the end of June, or after it was “officially” summer.
Abdul Rahim says:
January 27, 2011 at 3:07 pm
“We should all take personal responsibility for climate change.”
OK. I admit. I did it. But it sure has been fun flipping things around to screw with the minds of the consensus. I drove a little less last year and, voila, Real Winter! But my apologies to western Russia and Pakistan for those blocking highs earlier last year. I was on vacation and things got a little out of control.
On the ABC national news that aired on the west coast just before the SOTU address by POTUS, the anchor reporting the severe cold weather in the east showed a graphic trying to explain how this was all caused by global warming. The idea was that an unusually warm Arctic with very little ice cover was putting immense amounts of moisture into the atmosphere that was falling as snow in New England. The problem . . . the graphic was a summer 2007 image of the Arctic sea ice extent, not a present-day image of the Arctic ice.