I’ve held the normal Sunday Sea Ice news until NSIDC released their monthly report, which they did today. I’m repeating it here verbatim. The main issue with Arctic extent has to do with the persistent Arctic Oscillation induced high over eastern Canada, which has kept that area warm this past month, and kept Hudson Bay from freezing over like it normally does. Otherwise, inside the Arctic circle is mostly filled with ice and the areas not filled per normal for this period are mostly outside the Arctic Circle. Click this image for reference:

And if you’ll have a look at this image from NSIDC, you’ll see Hudson bay has started to freeze up as the AO changes.
There’s also some interesting news on the new Multisensor Analyzed Sea Ice Extent (MASIE) which we’ll examine at a future date.
===========================================================
From NSIDC:
Repeat of a negative Arctic Oscillation leads to warm Arctic, low sea ice extent
Arctic sea ice extent for December 2010 was the lowest in the satellite record for that month. These low ice conditions are linked to a strong negative phase of the Arctic Oscillation, similar to the situation that dominated the winter of 2009-2010.

Figure 1. Arctic sea ice extent for December 2010 was 12.00 million square kilometers (4.63 million square miles). The magenta line shows the 1979 to 2000 median extent for that month. The black cross indicates the geographic North Pole. Sea Ice Index data. About the data.
—Credit: National Snow and Ice Data Center
Overview of conditions
Arctic sea ice extent averaged over December 2010 was 12.00 million square kilometers (4.63 million square miles). This is the lowest December ice extent recorded in satellite observations from 1979 to 2010, 270,000 square kilometers (104,000 square miles) below the previous record low of 12.27 million square kilometers (4.74 million square miles) set in 2006 and 1.35 million square kilometers (521,000 square miles) below the 1979 to 2000 average.
As in November, ice extent in December 2010 was unusually low in both the Atlantic and Pacific sides of the Arctic, but particularly in Hudson Bay, Hudson Strait (between southern Baffin Island and Labrador), and in Davis Strait (between Baffin Island and Greenland). Normally, these areas are completely frozen over by late November. In the middle of December, ice extent stopped increasing for about a week, an unusual but not unique event.

Figure 2. The graph above shows daily Arctic sea ice extent as of January 2, 2011, along with daily ice extents for previous low-ice-extent years in the month of November. Light blue indicates 2010-2011, pink shows 2006-2007 (the record low for the month was in 2006), green shows 2007-2008, and dark gray shows the 1979 to 2000 average. The gray area around the average line shows the two standard deviation range of the data. Sea Ice Index data.
—Credit: National Snow and Ice Data Center
Conditions in context
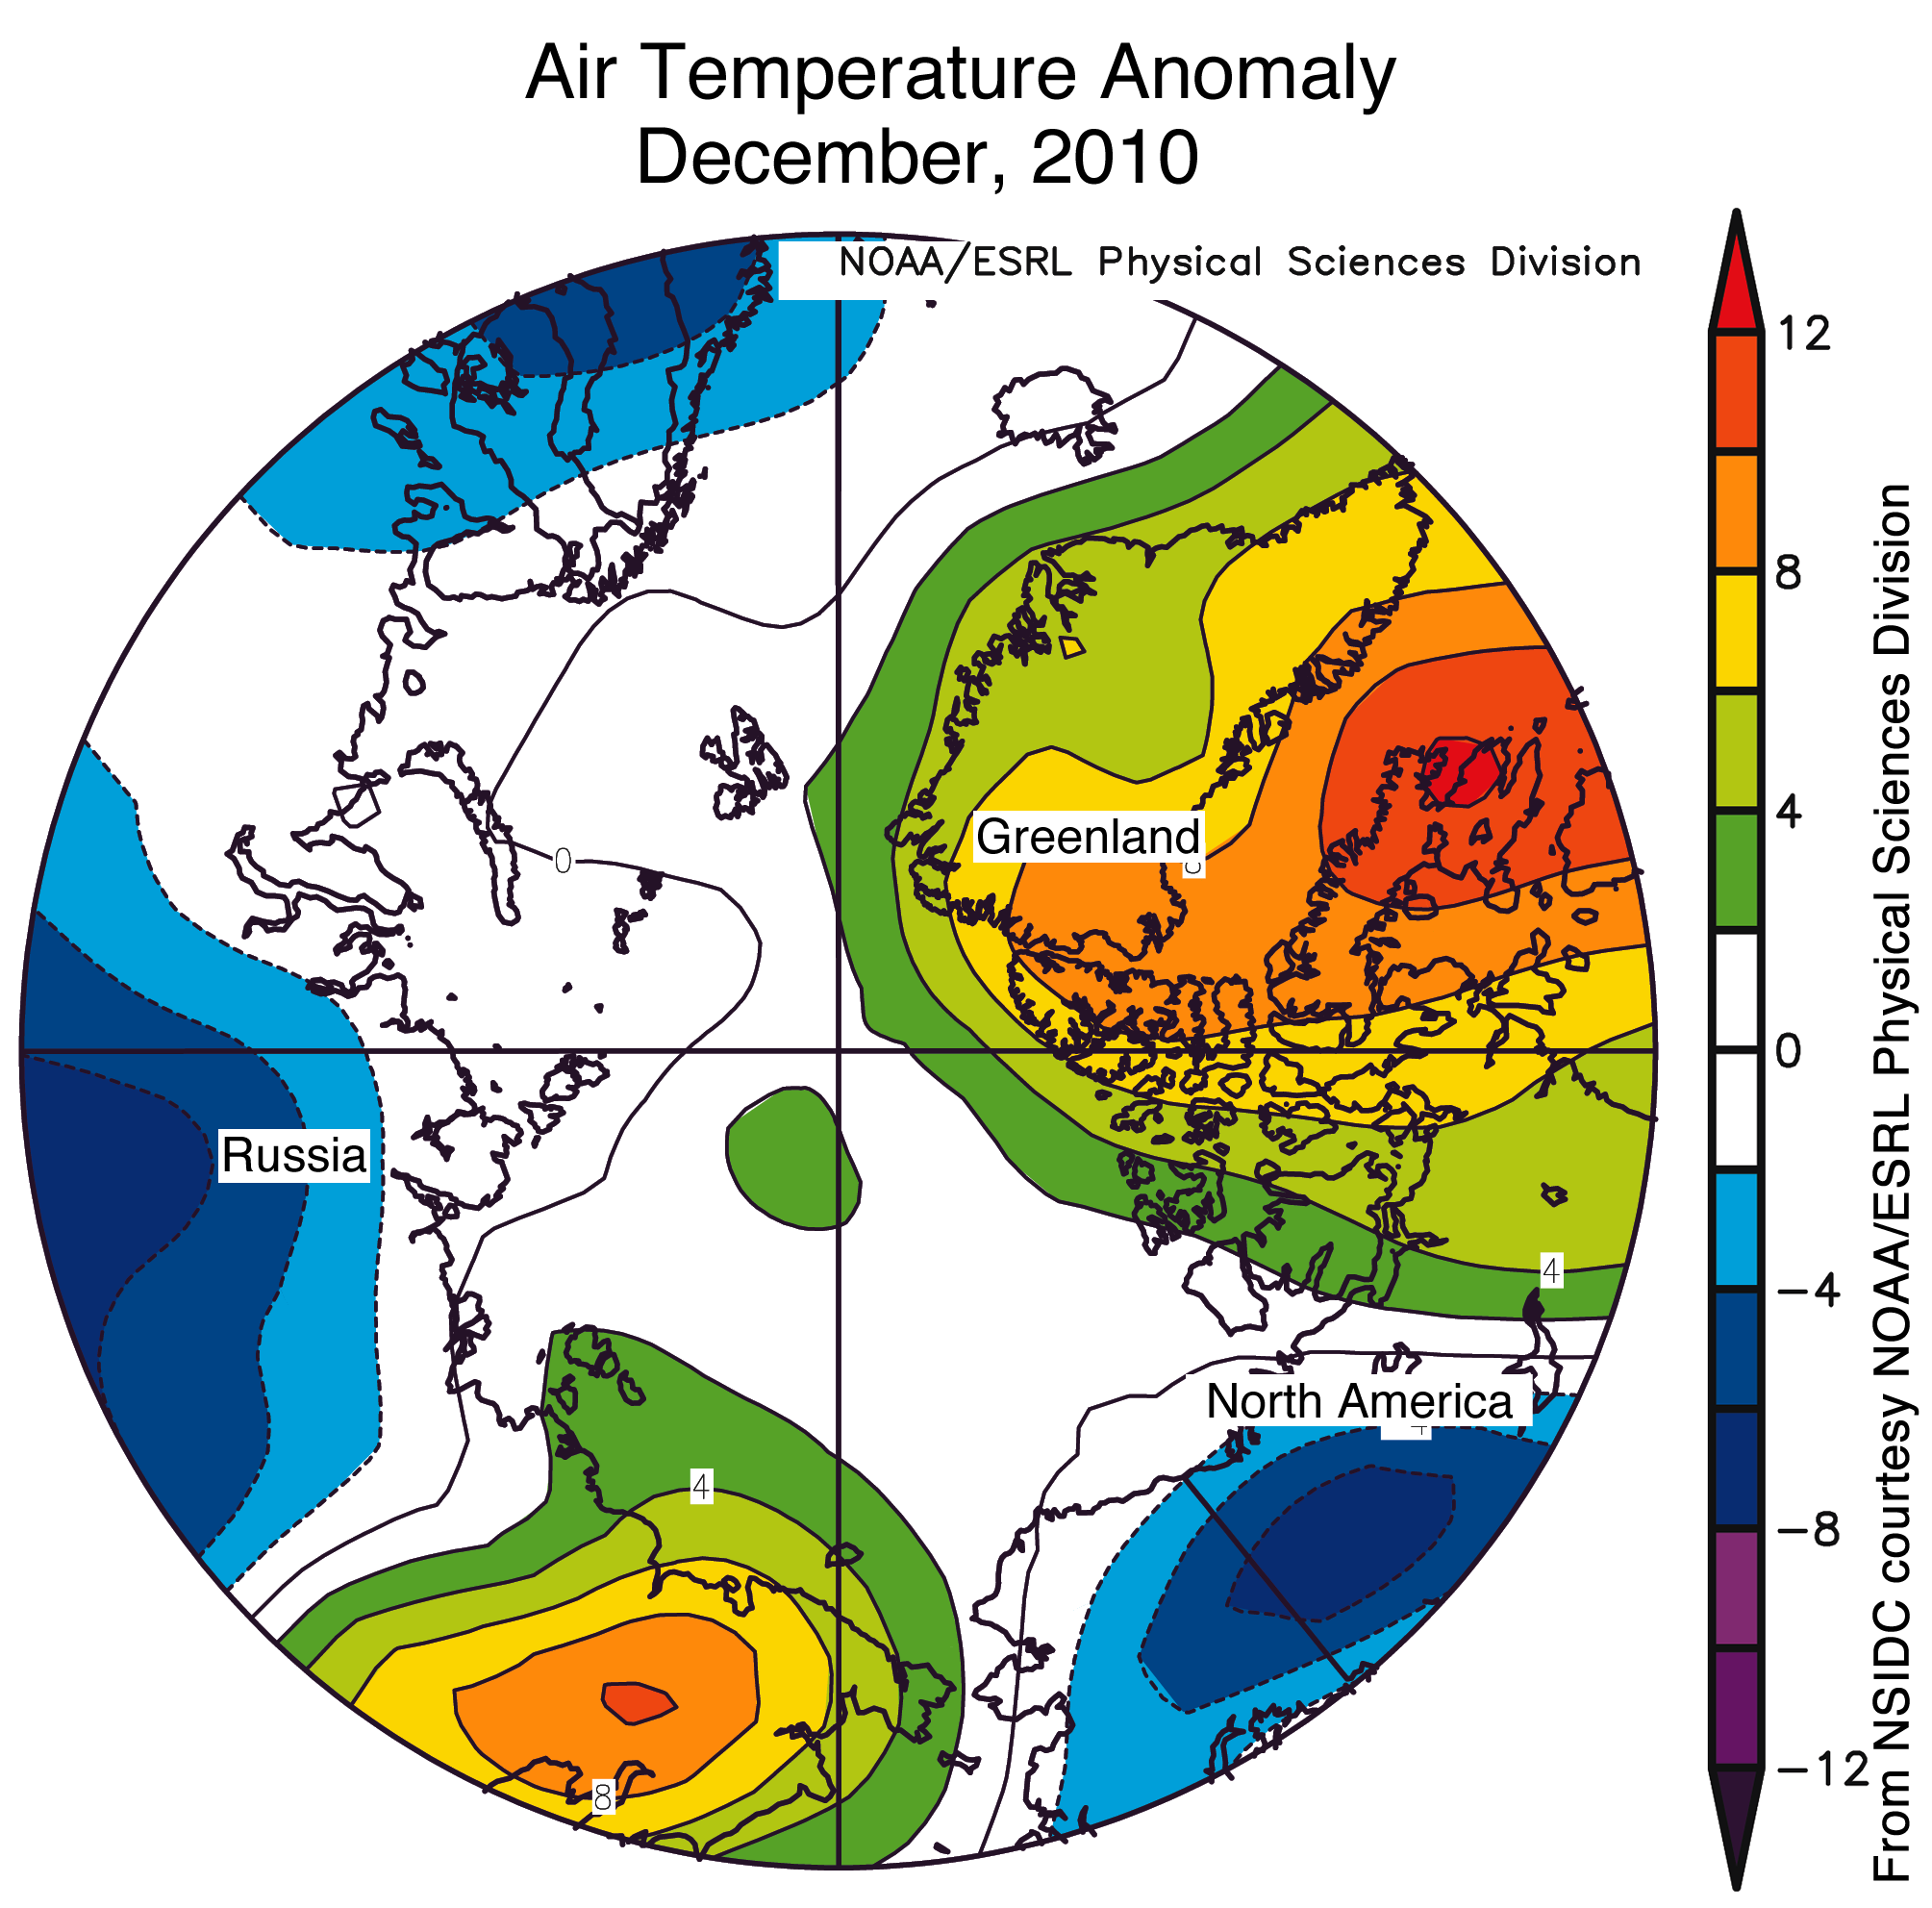
The low ice conditions in December occurred in conjunction with above-average air temperatures in regions where ice would normally expand at this time of year. Air temperatures over eastern Siberia were 6 to 10 degrees Celsius (11 to 18 degrees Fahrenheit) above normal in December. Over the eastern Canadian Arctic Archipelago, Baffin Bay/Davis Strait and Hudson Bay, temperatures were at least 6 degrees Celsius (11 degrees Fahrenheit) higher than average. Southern Baffin Island had the largest anomalies, with temperatures over 10 degrees Celsius (18 degrees Fahrenheit) higher than normal. By sharp contrast, temperatures were lower than average (4 to 7 degrees Celsius, 7 to 13 degrees Fahrenheit) over the Alaska-Yukon border, north-central Eurasia, and Scandinavia.
The warm temperatures in December came from two sources: unfrozen areas of the ocean continued to release heat to the atmosphere, and an unusual circulation pattern brought warm air into the Arctic from the south. Although the air temperatures were still below freezing on average, the additional ocean and atmospheric heat slowed ice growth.
 Figure 3. Monthly December ice extent for 1979 to 2010 shows a decline of 3.5% per decade.
—Credit: National Snow and Ice Data Center
December 2010 compared to past yearsDecember 2010 had the lowest ice extent for the month since the beginning of satellite records. The linear rate of decline for the month is –3.5% per decade.
 Figure 4. Air temperatures were higher than normal over Baffin Island, Hudson Bay, and eastern Siberia for the month of December, which was associated with low sea ice extent in those areas. The temperature pattern resulted from a negative phase of the Arctic Oscillation.
—Credit: NSIDC courtesy NOAA/ESRL PSD
Negative phase of the Arctic Oscillation
As in December 2009, a strongly negative phase of the Arctic Oscillation dominated the middle and high latitudes of the Northern Hemisphere in December 2010, bringing higher-than-normal pressures to the Arctic region, with lower-than-normal pressures in middle latitudes. However, unlike 2009, when higher-than normal pressures centered near the central Arctic , in December 2010 higher pressures centered near Iceland and the eastern tip of the Aleutians in the Pacific, and yielded a different pattern of winds. As a result, different areas experienced warm anomalies in 2010, and a different pattern of ice extent emerged.
Our January 5, 2010 post discussed the connection between very warm temperatures over much of the high Arctic in December 2009 and a strongly negative phase of the Arctic Oscillation.
 Figure 5. This full-year graph puts 2010 sea ice extent in context. The gray line shows the 1979 to 2000 climatology, thick blue-gray indicates the 1979 to 2008 (30-year) climatology, dashed green shows 2007, and 2009 is shown in sky blue. Sea Ice Index data.
—Credit: National Snow and Ice Data Center
2010 year in review
Despite a late date of the maximum in winter sea ice extent, the minimum sea ice extent for September 2010 was third lowest in the 1979 to 2010 satellite record, above only 2007 (the record low) and 2008. The late summer of 2010 saw an open Northwest Passage: this year, the deep water channel (the northern route) from M’Clure Strait to Lancaster Sound was navigable. The Northern Sea Route along the Siberian coast also became briefly navigable.
2010 started out with a highly negative phase of the Arctic Oscillation, an atmospheric pattern that in the past has favored the survival of old ice through the winter, and more ice at the end of this summer. But this tendency seems to be changing. A recent study led by Julienne Strove of NSIDC showed that while wind patterns linked with the strongly negative Arctic Oscillation winter of 2009-2010 transported much old ice into the southern Beaufort and Chukchi Seas, most of this ice later melted. It may be that with a warmer Arctic, old rules regarding links between the atmospheric pressure patterns and sea ice extent no longer hold. So far the winter of 2010-2011 has also had a strongly negative Arctic Oscillation, but it is not yet clear how this pattern will affect summer sea ice.
 Figure 6. The graph of Antarctic sea ice extent as of January 3, 2011. Light blue indicates 2010-2011, dark blue shows 2009-2010, and dark gray shows the 1979 to 2000 average. The gray area around the average line shows the two standard deviation range of the data
—Credit: National Snow and Ice Data Center
A note on Antarctica
While sea ice is growing in the Arctic, it is early summer in the Antarctic and sea ice is melting. For the past four months, Antarctic sea ice extent has remained well above average. The high ice extent around Antarctica appears to relate to a persistently positive phase of the Southern Annular Mode—an Antarctic counterpart to the Arctic Oscillation—and to the mild La Niña conditions in the Pacific. In December 2010, the monthly mean Southern Annular Mode index was lower, and Antarctic sea ice extent had dropped back to within about standard deviation of the mean.
For more information about Antarctic sea ice, see the Frequently Asked Questions section. Antarctic sea ice data is available on the Sea Ice Index.
New sea ice data
NSIDC has recently released a new sea ice extent product, called the Multisensor Analyzed Sea Ice Extent (MASIE). The MASIE project is a collaborative effort with the U.S. National Ice Center to provide a daily high-resolution sea ice extent estimate based on the NOAA Interactive Mapping System (IMS) product. This new product is considered more accurate for tracking the current position of the ice edge; for climate studies, the passive microwave product (on which Arctic Sea Ice News & Analysis is based) is preferred for a more consistent, long-term average. For more information, read an article about the product at the NSIDC Monthly Highlights Web site.
Further reading
Stammerjohn, S. E., D. G. Martinson, R. C. Smith, X. Yuan, and D. Rind, 2008. Trends in Antarctic annual sea ice retreat and advance and their relation to El Nino — Southern Oscillation and Southern Annular Mode variability. Journal of Geophysical Research, 113, C03S90, doi: 10.1029/2007JC004269.
Stroeve, J.C., J. Maslanik, M. C. Serreze, I. Rigor, W. Meier, and C. Fowler. 2010. Sea ice response to an extreme negative phase of the Arctic Oscillation during winter 2009/2010. Geophysical Research Letters. In Press.
===============================================================
As always, up to date info is available 24/7/365 on the WUWT Sea Ice Page
WHAT THE RECORD SETTING LOW ICE EXTENT FOR DECEMBER 2010 PORTENDS FOR THE 2011 MINIMUM
ANS: NOTHING
The December 31 record low of 11,914,688 km2 (per IJIS/JAXA) was due to reduced ice conditions primarily in Hudson Bay and Baffin Bay, and to a lesser extent, Okhotsk, East Greenland and the Barents Sea. The average amount of ice in these areas at the September minimum is either zero or not much above .1 million km2, so these areas are not material to the SIE at the September minimum.
The following regions have generally reached their maximum possiblie extent as of the end of December per the MASIE Time Series Plots :
Beaufort Sea
Chukchi Sea
East Siberian Sea
Laptev Sea
Kara Sea
Canadian Archipelago
Central Arctic Basin – appears to have reached the maximum extent of 3.25 million km2 earlier than in prior years
http://nsidc.org/data/masie/masie_plots.html
The Central Arctic Basin makes up approximately 80% of the SIE number at the minimum so this is the primary region to watch.
Weather and wind conditions will determine if 2011 drops below 4.1 million km2 and sets a new record low or continues to stay below the record low of 5.3 million km2 set in 2005. (Numbers are per NSIDC). Ice in the Laptev Sea, Kara Sea and to a lesser extent, the East Siberian Sea will exit these regions and flow into the central Arctic Basin in 2011, as they have in prior years. The influx of ice from these seas into the central Arctic Basin will be offset by the outflow of ice from the central Arctic Basin through the Fram Strait and to a lesser extent the Nares Strait. The balance between these inflows and the outflows for the central Arctic Basin as well as the degree of ice compaction and of course, melting, are the factors which will determining the SIE at the minimum. Regardless of whichever way things go, you can confidently predict that an ice free central Arctic Basin will not occur in 2011 and the September minimum will be significantly below the 1979 to 2009 average minimum.
MISSED AGAIN
The low end of my December 31, 2010 guess (based on the IJIS/JAXA data) made at the end of October (Sea Ice News #28) of 12.2 million km2 was not reached until January 4, 2011 and the upper end of 12.4 million km2 was exceeded on January 6, 2011, so my projection missed again by a few days. I attribute the miss to the unusual ice conditions in mid December in Hudson Bay, when the negative extent anomaly unexpectedly increased by .2 million km2 over a few days – see the graph at:
http://arctic.atmos.uiuc.edu/cryosphere/IMAGES/recent365.anom.region.13.html
THE NEXT GUESS
SIE numbers bounce around too much for the next several months to narrow down the range for a meaningful end of the month guess. At this point, I will hazard a guess that the SIE will drop below 11.5 million km2 by May 31, 2011 but will likely be above 10.8 million km2 at May 31, 2011 (as determined by IJIS/JAXA) as this is the approximate range observed for the period 2004 through 2010. however, I dropped the low end a bit since the previous guesses have been too high and Hudson Bay continues to show a large negative anomaly which indicates it may be more susceptible to early melting in 2011.
ftp://sidads.colorado.edu/DATASETS/NOAA/G02186/plots/r10_Hudson_Bay_ts.png
2011 MINIMUM GUESS
It is still too early to produce a precise prediction for the 2011 minimum SIE, so I will guess that there is a 75% chance it will be in a range of 4.1 million km2 to 5.1 million km2 for the minimum (2010 was 4.6 million km2) as determined by the NSIDC. For reference the JAXA September 2010 minimum was 4,813,594 km2. For the minimum based on the JAXA number I would guess 4.3 million km2 to 5.3 million km2 (approximately the record low amounts set in 2007 and 2005 repectively).
Mr. Watts:
Will you be posting a prediction for the 2011 minimum before the maximum SIE is reached in March?
R. Gates says: (January 6, 2011 at 9:46 pm)
” To assume that a 40% increase in atmospheric CO2 will have no affect on ocean heat transport seems foolish at best.”
To assume an additional 1.12 molecule of CO2 increase per 10,000 molecules of atmosphere will have any affect on ocean heat transport at all is foolish period.
Once again you fall back and trot out your “40% increase” phrase as if it has meaning. Try using the real world numbers, but then your whole campaign of fear melts away.
Tom in Florida says:
January 7, 2011 at 2:50 pm
correctimundo Tom. It’s funny really, when warmists whine on about 40% increases in atmospheric CO2. Firstly, it is somewhat disputed what pre-industrial CO2 levels were, but it is not disputed that geologically historical CO2 was much much higher. But the biggest crappola is the fact they forget that 40% of very little is still very little!
I bet if everyone of them had their savings in a bank account getting 0.003% they’d be real happy to get 0.004% and wouldn’t be at all complaining about the banks advertising that the interest rate was 40% better!
Still, of course, temps have risen by a comparable 40% as well haven’t they! /sarc off
Tom in Florida:
While CO2 is a trace gas in the atmosphere, it is not true that this trace gas has no impact on the Earth’s climate or life on the Earth.
Without 2.8 molecules of CO2 per 10,000 the earth would be significantly cooler. There is no support for a position that the Earth would be no different than it is today if all the CO2 was somehow removed from the atmosphere. We need that CO2 in the atmosphere, even though it only constitues a small part of the atmosphere.
While you can certainly confirm this on your own, the following may help explain the impact this very small amount of trace gas has:
“[C]arbon dioxide accounts for about 20 percent of the greenhouse effect, water vapor and clouds together account for 75 percent, and minor gases and aerosols make up the remaining five percent. However, it is the 25 percent non-condensing greenhouse gas component, which includes carbon dioxide, that is the key factor in sustaining Earth’s greenhouse effect. By this accounting, carbon dioxide is responsible for 80 percent of the radiative forcing that sustains the Earth’s greenhouse effect.
The climate forcing experiment described in Science was simple in design and concept — all of the non-condensing greenhouse gases and aerosols were zeroed out, and the global climate model was run forward in time to see what would happen to the greenhouse effect.
Without the sustaining support by the non-condensing greenhouse gases, Earth’s greenhouse effect collapsed as water vapor quickly precipitated from the atmosphere, plunging the model Earth into an icebound state — a clear demonstration that water vapor, although contributing 50 percent of the total greenhouse warming, acts as a feedback process, and as such, cannot by itself uphold the Earth’s greenhouse effect.”
http://www.physorg.com/news/2010-10-carbon-dioxide-earths-temperature.html
Why if 2.8 molecules have an impact, would you not believe that 3.9 molecules or a doubling to 5.6 molecules would not have a bigger impact, even if it does not have a proportionally bigger impact? The debate is about how much bigger of an impact that 40% increase is having, not whether CO2 has an impact.
Will Crump says:
Oh, I see: “…plunging the model Earth…”. And that is supposed to be “a clear demonstration”??
Will, you’re describing a model. There is no real world “demonstration,” there is only the model’s programmed output.
Show me a GCM that can make an accurate prediction of the climate two or three years ahead, and I’ll sit up straight and pay attention. But so far, no such model exists.
CO2 is a harmless and beneficial trace gas. More is better. If not, then show us actual, verifiable, global harm caused specifically by the increase in CO2. Not speculation from models, but real, quantifiable damage done to the planet by CO2 — and not “CO2 plus other factors.” Show us any planetary harm caused by CO2.
The whole AGW scare is based on the belief that CO2 is bad. With a ≈40% increase in CO2, there certainly must be plenty of verifiable harm done to the planet already — if CO2 is bad.
Show us the damage.
Will Crump says:{January 7, 2011 at 4:22 pm}
” Why if 2.8 molecules have an impact, would you not believe that 3.9 molecules or a doubling to 5.6 molecules would not have a bigger impact, even if it does not have a proportionally bigger impact? ”
Because the impact is not linear and there are saturation points. But that is not the bone I pick with R Gates. It’s the use of the scary sounding “40% increase”. R Gates uses it to make it sound like it is a big deal. It is not. 40% of $1 is not the same as 40% of $100,000.
“The debate is about how much bigger of an impact that 40% increase is having, not whether CO2 has an impact.”
Perhaps if you rephrase that to say ” The debate is about how much bigger of an impact that 1.12 molecule of CO2 per 10,000 molecules of atmosphere increase is having, not whether CO2 has an impact.”
See how it changes the impact of the statement? Not so threatening now is it? So the only conclusion is that the use of “40% increase” is to sell fear. Unfounded fear at that.
@- Tom-
“Perhaps if you rephrase that to say ” The debate is about how much bigger of an impact that 1.12 molecule of CO2 per 10,000 molecules of atmosphere increase is having, not whether CO2 has an impact.”
See how it changes the impact of the statement? Not so threatening now is it?”
——————–
You are correct that Framing the issue as an extra 1.12 molecules of CO2 per 10,000 molecules of atmosphere is much less alarmist than describing it as a 40% increase in CO2.
But whatever description you use the underlying physical process is the same. A CO2 molecule rapidly transfers any LWR energy it absorb into thermal energy of the other 10,000 molecules.
A century ago there were approx 2.8 CO2 molecules per 10,000 atmosphere molecules performing this transfer of photon energy to thermal energy. Now there are about 3.9 CO2 molecules.
Think of it like a postal service, if you increase the number of postmen delivering per 10,000 households by 40% you will be able to deliver more letters (heat).
“Think of it like a postal service, if you increase the number of postmen delivering per 10,000 households by 40% you will be able to deliver more letters (heat).”
No.
Think of it like a postal service with the number of letters per postman delivered in a given time representing the heat. More letters delivered in the same time with the same number of postmen equals more heat UNLESS one increases the number of postmen (the speed of the water cycle) so that once again the same number is delivered per postman in the same time.
So more CO2 does not result in a higher equilibrium temperature if the water cycle runs faster.
@-Stephen Wilde –
“So more CO2 does not result in a higher equilibrium temperature if the water cycle runs faster.”
I am wary of pushing the ‘postman’ analogy to far, but the number of letters delivered per postman would be related to pressure, and CO2-postman are outnumbered around 9 to 1 by water vapour postmen. There is probably a joke about ‘junk mail’ in there somewhere…
I do not understand what you mean by the water cycle running faster, or how this would impact on the equilibrium temperature.
AFAIK the prediction from models and measurement from satellites indicate that water vapour increases with temperature, the number of ‘postmen’ increases as part of a positive feedback.
Perhaps you could explain why you see a faster water cycle as stabilising the equilibrium temperature, wouldn’t the partitioning of H2O between ice, liquid and vapour be of more significance ?
“Perhaps you could explain why you see a faster water cycle as stabilising the equilibrium temperature, wouldn’t the partitioning of H2O between ice, liquid and vapour be of more significance ?”
The variable partitioning between ice, liquid and vapour is part of the water cycle. Perhaps I should have said hydrological cycle.
More evaporation results in more convection, condensation and rainfall thus a faster upward transport of energy for an entirely negative feedback.
The issue as to whether the negative feedback entirely negates the warming effect of more CO2 is the important aspect.
Since the CO2 warming effect is in the infra red only and so cannot penetrate the oceans then due to evaporation having a net cooling effect the extra CO2 cannot heat the ocean bulk and so it is likely that because the ocean temperature controls the air temperature the warming effect of more CO2 is indeed negated completely by a faster water cycle.
So far no one has been able to demonstrate otherwise. There is a nice discussion of the point ongoing here:
http://scienceofdoom.com/2011/01/06/does-back-radiation-%e2%80%9cheat%e2%80%9d-the-ocean-%e2%80%93-part-four/
Tom:
Sorry if I misunderstood your statement as saying that CO2 has no impact on the Earth’s temperature.
I am not that picky about how you phrase the debate and your way is just fine by me. But let’s not limit the debate to just CO2, please include a broader list of anthropogenic impacts to climate.
Smokey:
My guess is that the Earth has not maintained a constant CO2 level of 2.8 per 10,000 molecules throughout its history.
If you want to disprove the model created by these scientists, provide an example of when the Earth was as warm as it is today and the CO2 was at or below 1.8 per 10,000.
Alternatively, you could cite a peer reviewed study that says if the level of non-condensing greenhouse gasses goes to 0.00 molecules per 10,000 that the Earth can maintain its current temperature level.
While climate is more complex than just looking at CO2 levels, I would be most interested in having you provide the above information or a physics paper that shows that CO2 is not a greenhouse gas.
By the way, where did I say CO2 was bad? I thought the analysis I provided and the paper I cited showed that it was beneficial to have CO2 in the atmosphere since it was essential in maintaining Earth’s temperature at levels that we find comfortable.
As for your request for a showing of damages, are you looking to sue some one? From your statement, you do not appear to understand that the full impact of having CO2 at 390 PPM in the atmosphere can not be determined by looking at a single year at this level. Even if you were to alter human activities so that they would not increase CO2 beyond this level, the climate will continue to warm.
Since you do not trust models, lets run the experiment by not allowing any increase in CO2 beyond the current level for the next 100 years and see what happens. I do not think supporters of AGW would mind if you did this.
As a practical matter, I suspect that we will run the experiment of continuing to increase CO2 levels and leave future generations to deal with the consequences.
@- Stephen Wilde
Interesting discussion at SoD (as so often!)
I can see an argument that the bulk oceans gain no direct energy from the down-welling long-wave radiation because all the extra energy involves an isothermal change of state in the surface Knudsen layer.
But the 1st Law of Thermodynamics as always kicks in. In politics its follow the money, in Nature, follow the energy. If you have transfered the energy from the extra CO2 DLR into water vapour then it can be stored and transported for a short time until it condenses and releases that latent heat. The residence time of water molecules in the atmosphere is measured in days, that latent heat of evaporation is going to get re-thermalized when it gets somewhere colder and condenses into rain or snow, raising the ambient temperature of the air, land and sea in that locale. The surface evaporation from the DLR has just been a mechanism for distributing the energy from the ocean surface to colder regions.
Meanwhile, in water vapour form it adds to the number of GHG molecules that can convert IR photons to thermal energy in the atmosphere.
But I suspect the fine-scale details of the Knudsen layer are rather more dynamically complex than is assumed in all this. At the free path scale it is probably a surface with a fractal dimension and the absorption of sufficient DLR to break the inter-molecular bonds to ‘evaporate’ an H2O molecule will be a dynamic process in which many of those that break free will rapidly return to the surface, the net flux of water vapour carrying away latent heat, extra scattering of IR from the surface and the influence of ambient temperature and humidity in that 200nm surface volume are I suspect part of the underlying complexity that makes this a difficult problem in detail. Luckily at larger scales and over time its is an ergodic problem like most thermodynamic/energy process so the overall result can be established without detailed knowledge of the chaotic individual events involved. In the same way that Boyle’s law and the Clausius–Clapeyron equation.
The idea that the extra energy from the extra CO2 will not warm the oceans because it only evaporates the surface is paralleled by the behaviour of snow and ice surfaces. The lack of conduction and convection means the surfaces of solid H”) can sublime, transiting straight from ice to vapour in some circumstances. But that additional water vapour is going to have a further effect in thermalizing IR emitted from the surface/surroundings. And less ice tends to be a positive feedback…
You suggest that -“More evaporation results in more convection, condensation and rainfall thus a faster upward transport of energy for an entirely negative feedback.”
This seems highly implausible, most of the hydrological cycle in the atmosphere is within the troposphere and WELL below the thermopause. Water phase changes transport energy horizontally far more than vertically. They are a key component of the movement of thermal energy from the equator to the poles. Increase the rate of this and you get increased melting of ice…. seen the Dec figures for the N pole ?!
Perhaps you have other ideas on how this may still provide a negative feedback, a means of increasing the energy lost from the surface that will offset the extra retained from the CO2, and the increased H2O, reducing the surface rate of heat loss.
izen asked:
“Perhaps you have other ideas on how this may still provide a negative feedback, a means of increasing the energy lost from the surface that will offset the extra retained from the CO2, and the increased H2O, reducing the surface rate of heat loss.”
The higher water vapour goes before condensing the higher the additional energy is when it is released by condensation.
From a higher level the energy is more quickly radiated to space.
Furthermore any increase in cloudiness will increase global albedo for a net cooling effect. Energy lost in that way never even enters the system.
The rethermalisation never occurs at the surface. Once the rethermalisation has occurred the energy exits quickly to space and a cold rain falls cooling the surface further.
Dr. Roy Spencer seems to be finding that such processes are heavily negative in thermodynamic terms.
@-Stephen Wilde
“The higher water vapour goes before condensing the higher the additional energy is when it is released by condensation.
From a higher level the energy is more quickly radiated to space.”
You seem to be arguing for a pronounced tropospheric hot-spot because of the adiabatic lapse rate….
From whatever level the latent energy is converted back into thermal energy it will be radiated equally in all directions, half will still head back down… and warmer air at altitude reduces convection rates that you are relying on to get this energy higher.
I suspect that an effective negative feedback from evaporation effects can only be credible if it could be shown that for equal total energy, but different spectra the total amount of evaporation was significantly different.
Over the total history of a volume of liquid is more water evaporated with 1Joule of IR than 1Joule of visible light ?
In multiple glazing systems, marginal efficiency increases are obtained by blocking a much wider IR spectrum than CO2 is capable of. However, huge increases can be gained by adding another layer of air & glass. You need two air layers because above about 20mm, (0.78″), you get convection effects which cause additional losses.
Air is an excellent insulator! I suspect surface radiative losses have been grossly oversold at the expense of evaporative/convection losses! Yes, ultimately, radiation is the only way we know of that energy can leave but I don’t think surface radiation is that big a player.
DaveE.
“You seem to be arguing for a pronounced tropospheric hot-spot because of the adiabatic lapse rate….”
No, just a faster loss to space.
A faster water cycle does not require ‘backing up’ of energy in any particular location.
Will Crump says:
“Smokey:
As for your request for a showing of damages, are you looking to sue some one?”
No. I don’t sue people. What I am demonstrating is the plain fact that no global harm has resulted from the ≈40% increase in that harmless, beneficial trace gas.
That fact is central to the entire CAGW debate: if no harm results from more CO2, and if it can be shown that more CO2 is beneficial, then the demands that everyone must reduce their “carbon” [by which they mean CO2] footprint are baseless, as are “carbon credits”, and any other “carbon”-related nonsense.
The whole CO2=CAGW conjecture has been repeatedly falsified. Now we see that not only is there no harm from more CO2, but that more CO2 is beneficial.
If and when you can definitively show that the increase in CO2 has caused global harm, wake me. Until then, blaming CO2 is disingenuous, crafty and deceptive. Give us verifiable evidence of harm, or admit that your contention has been falsified by the planet itself.
Finally, there is no correlation between ice core observations of temperature and CO2 levels, nor is there correlation during shorter or longer time spans. The planet is currently starved of CO2.
Smokey:
The full consequences of the 40% increase have not yet occurred. It will be several decades before the full impact of CO2 at 390 PPM will be observed even if we put in place measures to stabalize CO2 at this level (which is extremely unlikely). Even if this were done, I suspect that people would disagree on whether the observed changes fifty years from now are due to the CO2 increase or some other cause. Producing a “proof” of damage that people can agree on for a system as complex as the climate may not be possible. And yet, some level of damage will occur.
The negative consequences from a 40% increase in CO2 may be acceptable. The “solutions” crafted to deal with AGW sometimes use this level as a target for managing future CO2 levels. As we opt for the “do nothing approach”, CO2 levels are going to increase. By the time the damage from increased levels of CO2 become apparent, it will be too late to stop even greater damage from occurring.
Smokey:
The charts and information you have provided are done on a basis as if CO2 is the only item that affects global temperature. Not surprisingly, the charts prove that climate is more complex than just looking at CO2 levels alone and the climate scientists that you disagree with would agree that CO2 is not the only factor.
However, you have failed to show in the historical record a period of 150 years when CO2 levels double from 2.8 per 10,000 to 5.6 per 10,000 and there is no impact on the climate.
Nothing you have provided shows that CO2 is not a greenhouse gas.
Nothing you have provided contradicts the model from the paper I cited of an earth with a CO2 level of 0.00 molecules per 10,000 being much colder than it is today.
There is considerable debate about the sensitivity of the climate to the increases in CO2 forcing from human activities and other human impacts on the climate. The climate scientists agree that a 40% increase in CO2 does not translate into 40% higher temperatures (whatever that means) . While we should be wary of the extreme claims, such as the Arctic will be “ice free” at the minimum by 2013, the claim that the current CO2 increase will have zero impact is false.
The inability to demonstrate a level of damages from increasing CO2 levels sufficient to obtain your consent to limit the rate of increase may have more to do with the limitations of human science than it does with whether the rapidly increasing CO2 levels will cause harm in the future. For many people, even a showing that harm will occur in 150 years if the “do nothing” scenario is continued will not be sufficient to generate a consent to meaningful limitation on CO2 if it imposes a high cost on them today and the benefit goes to a generation that will not be born for another 100 years. There are other problems which have a shorter time horizon and we willingly choose to ignore these problems, why would anyone expect the that the same approach will not be followed for CO2 and climate?
Will Crump says:
“The full consequences of the 40% increase have not yet occurred.”
Full consequences?? Will, there is no verifiable global harm at all due to the increase in CO2.
A ≈40% rise is not insignificant. If CO2 caused any global harm, certainly by now there would be some evidence showing the damage. But there is none.
The only definitive result of the CO2 rise is increased agricultural production. That proves that CO2 is beneficial, as I showed in numerous links above. So we have a situation where no global harm can be shown — but a rise in global food production is verifiable.
In a world where a billion people subsist on less than a dollar a day, the increased food production due to increased CO2 is essential. But you still try to demonize the one factor that makes a difference to those people. In many cases, it means the difference between life and death. Yet you demonize CO2 without being able to show any damage resulting from it.
Your entire argument is based on “What if…” Try sticking with the scientific method. That way you will arrive at the correct conclusion: CO2 is a harmless and beneficial trace gas. More is better. Warmer is better. Cold and starvation kills.
Smokey:
I never said CO2 was 100% bad. I cited a paper on how CO2 was necessary, otherwise the planet would be too cold.
I will concede that soybeans and corn and some other types of plants can grow better using the FACE technology system in the advertisment you cited. Other studies have reached similar conclusions and you may want to look into this:
http://www.co2science.org/subject/g/summaries/temp+co2ag.php
Although there also appear to be studies that show harm:
http://www.caes.ucdavis.edu/NewsEvents/spotlight/rising-co2-levels-threaten-crops-and-food-quality
http://researchnews.osu.edu/archive/co2plant.htm
While the science on the impact on agriculture does not appear to have reached a consensus opinion for CO2 and the information you cite does not evaluate the totality of the impacts on agriculture from global warming, I do not mind conceding the possibility that there are positive effects to CO2 and warming, particularly for farmers in Greenland. You can also add to your list of positives that the melting of the Arctic due to CO2 warming will result in transportation savings, but then you would have to admit that the CO2 and other anthropogenic influences are contributing to the melt in the Arctic.
How much does it cost to implement the FACE technology, will the third world be able to afford it?
I am curious why you do not believe in the probelm of global warming since the very people listed in the ad for FACE Technology do believe in global warming and view CO2 as a problem.
I saw that BASF logo on the ad. Are you aware that they see CO2 as a problem and have been working to reduce their carbon footprint. Per their scientist:
“Climate change is one of the main challenges faced by society,” said Dr. Ulrich von Deessen, Climate Protection Officer of BASF SE. “We are facing up to this challenge and offering a wide range of solutions that help to protect the climate.”
In the long term the factor of three ought to be maintained or even improved. A positive ratio of the corporate carbon footprint is only possible if you reduce your own carbon emissions and if you help your clients to save CO2. Dr. Ulrich von Deessen: “In areas such as construction, automobiles and industrial production, our products help our customers to save more than 287 million metric tons of CO2 worldwide.”
http://www.basf.com/group/corporate/en/sustainability/environment/climate-protection/carbon-balance
How about the International Arid Lands Consortium who also have their logo attached. Per their web site:
“Global warming may cause dry regions like Israel to become even more arid, resulting in a lack of water that may affect plants to the point of extinction. This project seeks to promote water conservation strategies, avert some of the least desirable effects of global change, and manage natural resources and crops to promote improvement of arid land agriculture.”
http://ialcworld.org/news-releases/pr1.html
The other logo is for The Fulbright Commission. Per their web site, they are not climatologists: “The US-UK Fulbright Commission promotes peace and cultural understanding through educational exchange.” This Commission appears to be more concerned about Global Warming than you are since they are assisting scholars to help meet the gloabal challenge of global warming.
“From a record number of applications, Fulbright selected an outstanding cohort of men and women representing a broad range of geographic regions, institutions in the US and UK, fields of study and backgrounds. The diversity of scholars demonstrates Fulbright’s commitment to providing bright, passionate and talented citizens from both countries the opportunity to further the Fulbright mission of promoting mutual cultural understanding through educational exchange. This dynamic group of participants will make vital contributions to today’s global challenges, such as the economic crisis, HIV/AIDS and global warming.”
http://www.fulbright.co.uk/news-events/news/real-life-good-will-hunting-amongst-recipients-of-the-prestigious-2010-11-fulbright-awards
Some of the effects of global warming will be good, some will be bad. If the good outweighed the bad, then the participants in FACE technology would not be so concerned about CO2 and global warming.
So Smokey, if the very people you use to support you discussion believe CO2 and global warming climate impacts are a problem, why don’t you?
Smokey:
P.S. Thanks for the chart showing that all the money that has been put into enhanced agriculature techniques in the US have improved farm production.
Will, delude yourself all you want, but empirical observations show that CO2 is the primary reason for increased agricultural productivity:
click1
click2
click3
click4
click5
click6
click7
When a man makes up his mind without evidence, no evidence disproving his opinion will change his mind.
Robert A. Heinlein, 1978
Feel free to have the last comment. This thread is too old to bother with. I’m moving to the new home page articles.