I’ve held the normal Sunday Sea Ice news until NSIDC released their monthly report, which they did today. I’m repeating it here verbatim. The main issue with Arctic extent has to do with the persistent Arctic Oscillation induced high over eastern Canada, which has kept that area warm this past month, and kept Hudson Bay from freezing over like it normally does. Otherwise, inside the Arctic circle is mostly filled with ice and the areas not filled per normal for this period are mostly outside the Arctic Circle. Click this image for reference:

And if you’ll have a look at this image from NSIDC, you’ll see Hudson bay has started to freeze up as the AO changes.
There’s also some interesting news on the new Multisensor Analyzed Sea Ice Extent (MASIE) which we’ll examine at a future date.
===========================================================
From NSIDC:
Repeat of a negative Arctic Oscillation leads to warm Arctic, low sea ice extent
Arctic sea ice extent for December 2010 was the lowest in the satellite record for that month. These low ice conditions are linked to a strong negative phase of the Arctic Oscillation, similar to the situation that dominated the winter of 2009-2010.

Figure 1. Arctic sea ice extent for December 2010 was 12.00 million square kilometers (4.63 million square miles). The magenta line shows the 1979 to 2000 median extent for that month. The black cross indicates the geographic North Pole. Sea Ice Index data. About the data.
—Credit: National Snow and Ice Data Center
Overview of conditions
Arctic sea ice extent averaged over December 2010 was 12.00 million square kilometers (4.63 million square miles). This is the lowest December ice extent recorded in satellite observations from 1979 to 2010, 270,000 square kilometers (104,000 square miles) below the previous record low of 12.27 million square kilometers (4.74 million square miles) set in 2006 and 1.35 million square kilometers (521,000 square miles) below the 1979 to 2000 average.
As in November, ice extent in December 2010 was unusually low in both the Atlantic and Pacific sides of the Arctic, but particularly in Hudson Bay, Hudson Strait (between southern Baffin Island and Labrador), and in Davis Strait (between Baffin Island and Greenland). Normally, these areas are completely frozen over by late November. In the middle of December, ice extent stopped increasing for about a week, an unusual but not unique event.

Figure 2. The graph above shows daily Arctic sea ice extent as of January 2, 2011, along with daily ice extents for previous low-ice-extent years in the month of November. Light blue indicates 2010-2011, pink shows 2006-2007 (the record low for the month was in 2006), green shows 2007-2008, and dark gray shows the 1979 to 2000 average. The gray area around the average line shows the two standard deviation range of the data. Sea Ice Index data.
—Credit: National Snow and Ice Data Center
Conditions in context
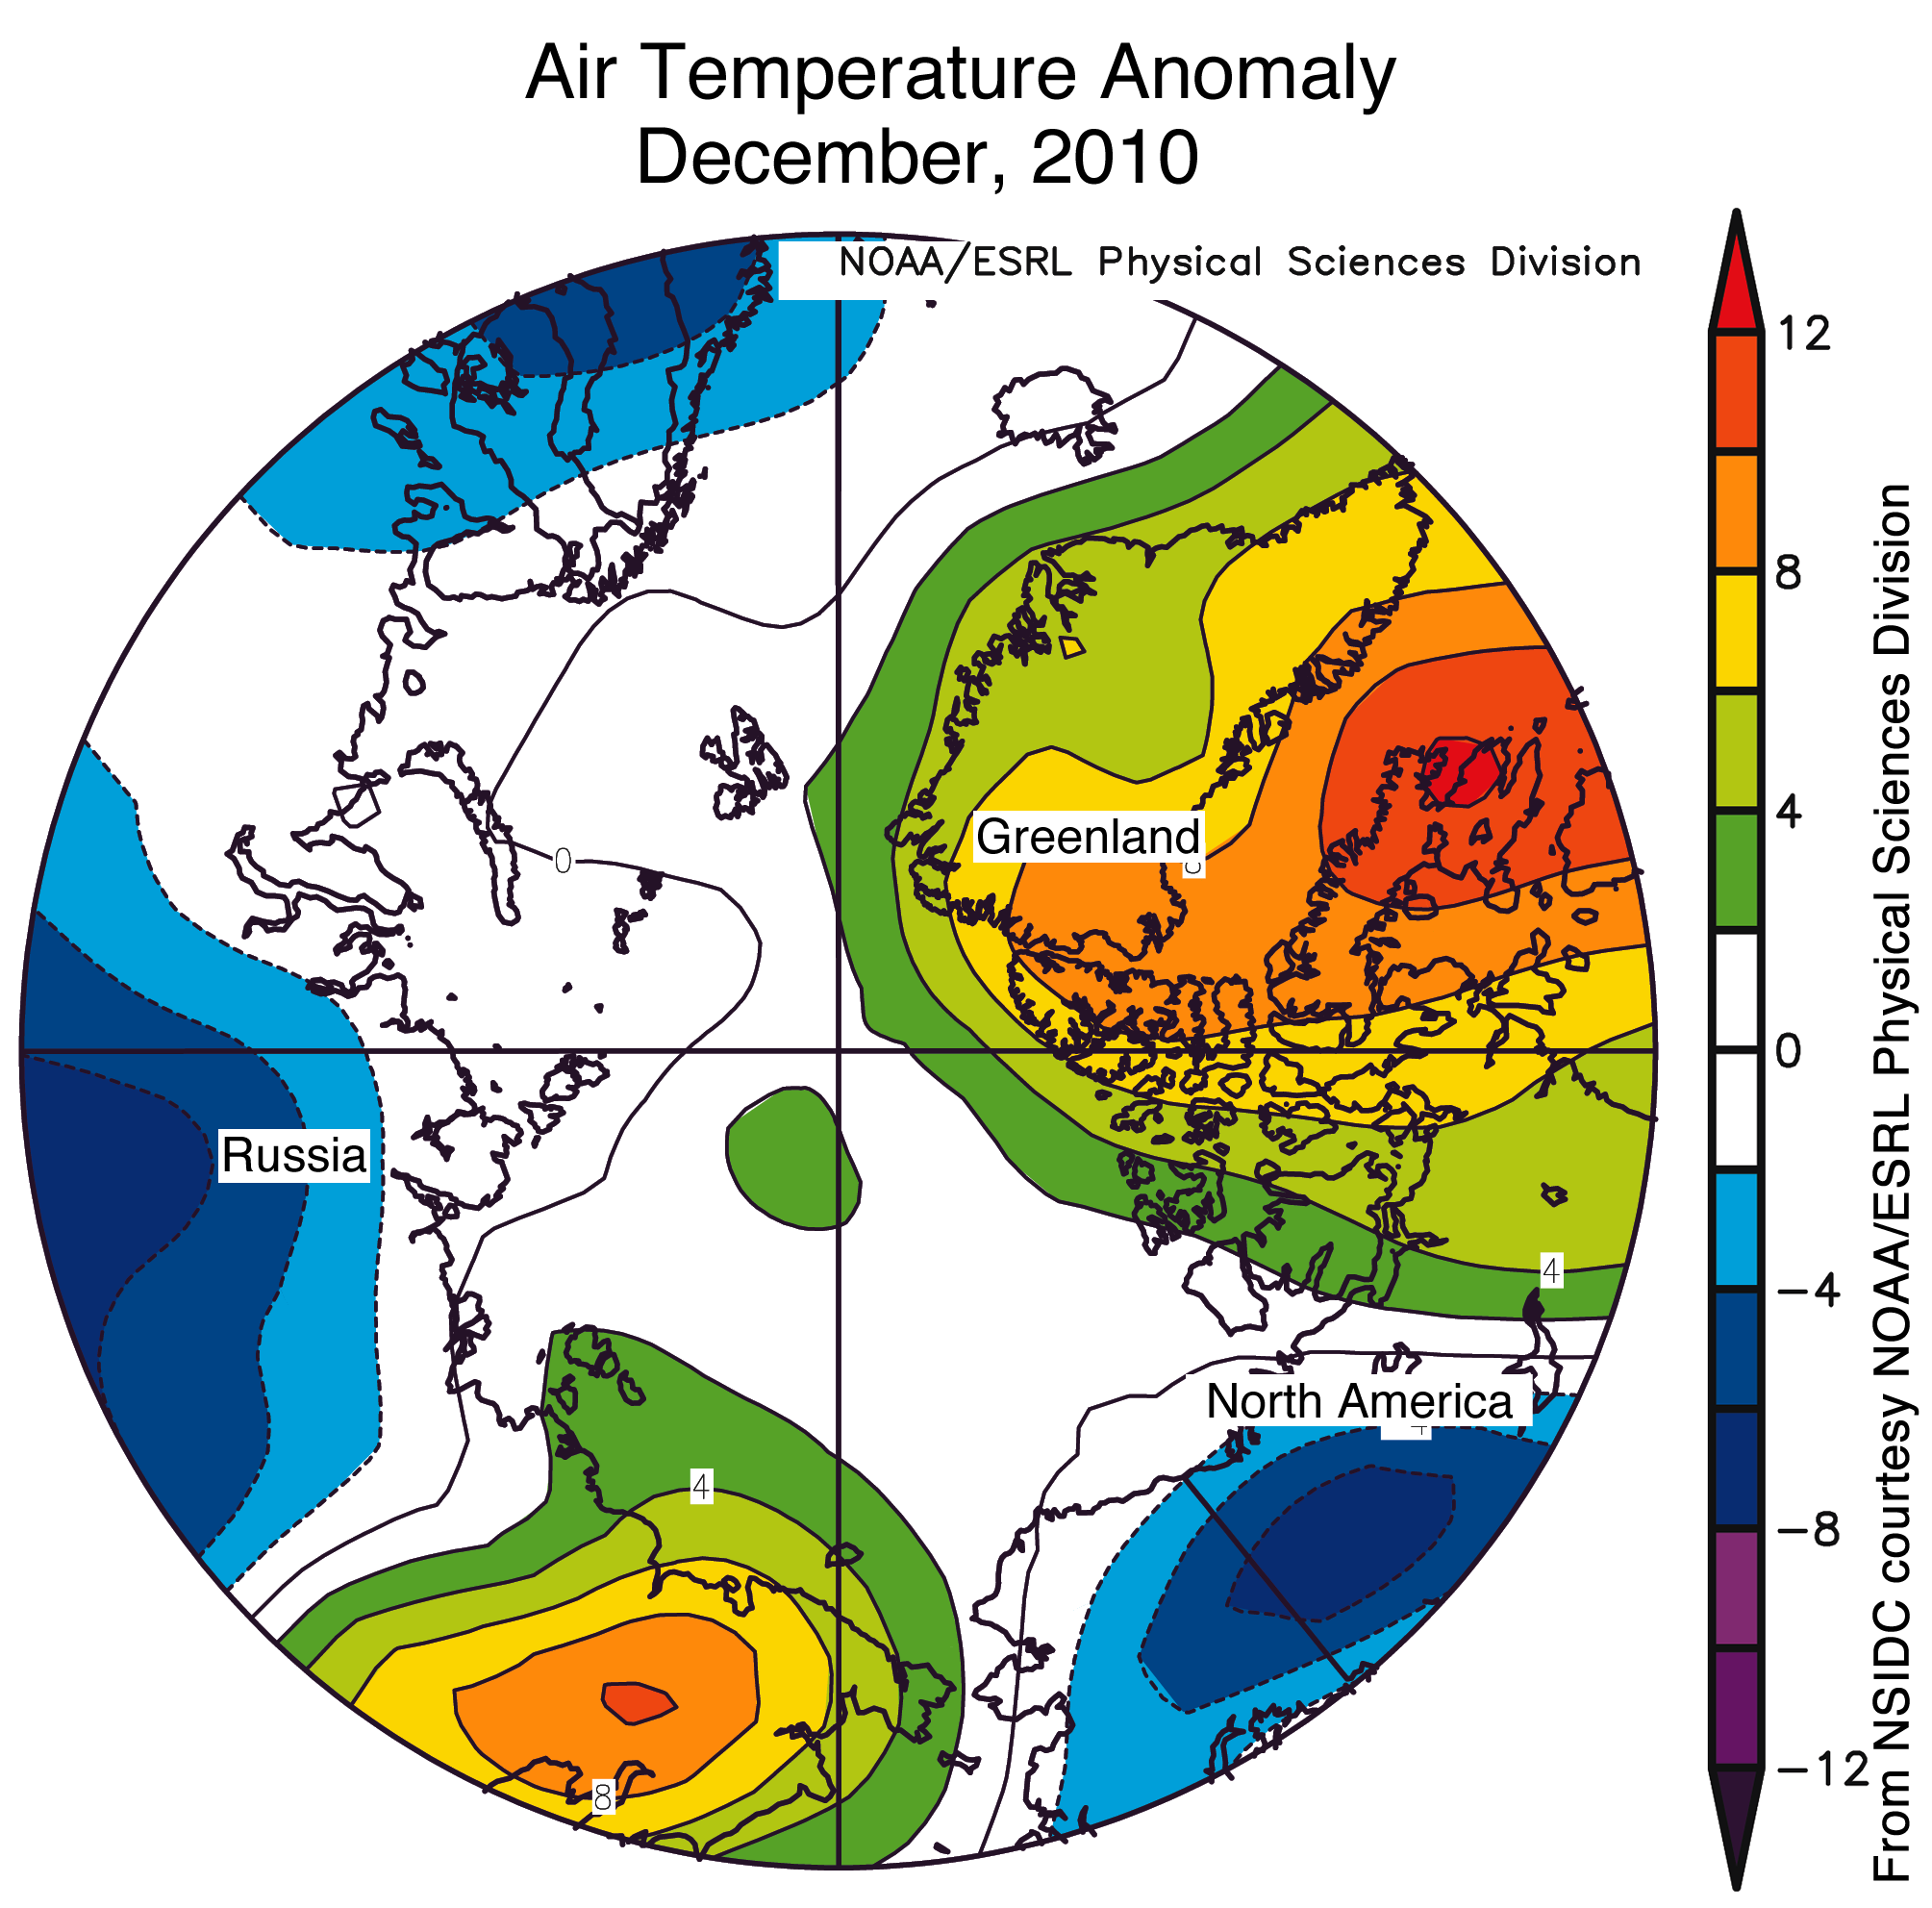
The low ice conditions in December occurred in conjunction with above-average air temperatures in regions where ice would normally expand at this time of year. Air temperatures over eastern Siberia were 6 to 10 degrees Celsius (11 to 18 degrees Fahrenheit) above normal in December. Over the eastern Canadian Arctic Archipelago, Baffin Bay/Davis Strait and Hudson Bay, temperatures were at least 6 degrees Celsius (11 degrees Fahrenheit) higher than average. Southern Baffin Island had the largest anomalies, with temperatures over 10 degrees Celsius (18 degrees Fahrenheit) higher than normal. By sharp contrast, temperatures were lower than average (4 to 7 degrees Celsius, 7 to 13 degrees Fahrenheit) over the Alaska-Yukon border, north-central Eurasia, and Scandinavia.
The warm temperatures in December came from two sources: unfrozen areas of the ocean continued to release heat to the atmosphere, and an unusual circulation pattern brought warm air into the Arctic from the south. Although the air temperatures were still below freezing on average, the additional ocean and atmospheric heat slowed ice growth.
 Figure 3. Monthly December ice extent for 1979 to 2010 shows a decline of 3.5% per decade.
—Credit: National Snow and Ice Data Center
December 2010 compared to past yearsDecember 2010 had the lowest ice extent for the month since the beginning of satellite records. The linear rate of decline for the month is –3.5% per decade.
 Figure 4. Air temperatures were higher than normal over Baffin Island, Hudson Bay, and eastern Siberia for the month of December, which was associated with low sea ice extent in those areas. The temperature pattern resulted from a negative phase of the Arctic Oscillation.
—Credit: NSIDC courtesy NOAA/ESRL PSD
Negative phase of the Arctic Oscillation
As in December 2009, a strongly negative phase of the Arctic Oscillation dominated the middle and high latitudes of the Northern Hemisphere in December 2010, bringing higher-than-normal pressures to the Arctic region, with lower-than-normal pressures in middle latitudes. However, unlike 2009, when higher-than normal pressures centered near the central Arctic , in December 2010 higher pressures centered near Iceland and the eastern tip of the Aleutians in the Pacific, and yielded a different pattern of winds. As a result, different areas experienced warm anomalies in 2010, and a different pattern of ice extent emerged.
Our January 5, 2010 post discussed the connection between very warm temperatures over much of the high Arctic in December 2009 and a strongly negative phase of the Arctic Oscillation.
 Figure 5. This full-year graph puts 2010 sea ice extent in context. The gray line shows the 1979 to 2000 climatology, thick blue-gray indicates the 1979 to 2008 (30-year) climatology, dashed green shows 2007, and 2009 is shown in sky blue. Sea Ice Index data.
—Credit: National Snow and Ice Data Center
2010 year in review
Despite a late date of the maximum in winter sea ice extent, the minimum sea ice extent for September 2010 was third lowest in the 1979 to 2010 satellite record, above only 2007 (the record low) and 2008. The late summer of 2010 saw an open Northwest Passage: this year, the deep water channel (the northern route) from M’Clure Strait to Lancaster Sound was navigable. The Northern Sea Route along the Siberian coast also became briefly navigable.
2010 started out with a highly negative phase of the Arctic Oscillation, an atmospheric pattern that in the past has favored the survival of old ice through the winter, and more ice at the end of this summer. But this tendency seems to be changing. A recent study led by Julienne Strove of NSIDC showed that while wind patterns linked with the strongly negative Arctic Oscillation winter of 2009-2010 transported much old ice into the southern Beaufort and Chukchi Seas, most of this ice later melted. It may be that with a warmer Arctic, old rules regarding links between the atmospheric pressure patterns and sea ice extent no longer hold. So far the winter of 2010-2011 has also had a strongly negative Arctic Oscillation, but it is not yet clear how this pattern will affect summer sea ice.
 Figure 6. The graph of Antarctic sea ice extent as of January 3, 2011. Light blue indicates 2010-2011, dark blue shows 2009-2010, and dark gray shows the 1979 to 2000 average. The gray area around the average line shows the two standard deviation range of the data
—Credit: National Snow and Ice Data Center
A note on Antarctica
While sea ice is growing in the Arctic, it is early summer in the Antarctic and sea ice is melting. For the past four months, Antarctic sea ice extent has remained well above average. The high ice extent around Antarctica appears to relate to a persistently positive phase of the Southern Annular Mode—an Antarctic counterpart to the Arctic Oscillation—and to the mild La Niña conditions in the Pacific. In December 2010, the monthly mean Southern Annular Mode index was lower, and Antarctic sea ice extent had dropped back to within about standard deviation of the mean.
For more information about Antarctic sea ice, see the Frequently Asked Questions section. Antarctic sea ice data is available on the Sea Ice Index.
New sea ice data
NSIDC has recently released a new sea ice extent product, called the Multisensor Analyzed Sea Ice Extent (MASIE). The MASIE project is a collaborative effort with the U.S. National Ice Center to provide a daily high-resolution sea ice extent estimate based on the NOAA Interactive Mapping System (IMS) product. This new product is considered more accurate for tracking the current position of the ice edge; for climate studies, the passive microwave product (on which Arctic Sea Ice News & Analysis is based) is preferred for a more consistent, long-term average. For more information, read an article about the product at the NSIDC Monthly Highlights Web site.
Further reading
Stammerjohn, S. E., D. G. Martinson, R. C. Smith, X. Yuan, and D. Rind, 2008. Trends in Antarctic annual sea ice retreat and advance and their relation to El Nino — Southern Oscillation and Southern Annular Mode variability. Journal of Geophysical Research, 113, C03S90, doi: 10.1029/2007JC004269.
Stroeve, J.C., J. Maslanik, M. C. Serreze, I. Rigor, W. Meier, and C. Fowler. 2010. Sea ice response to an extreme negative phase of the Arctic Oscillation during winter 2009/2010. Geophysical Research Letters. In Press.
===============================================================
As always, up to date info is available 24/7/365 on the WUWT Sea Ice Page
As for what the December extent means for September is anybody’s guess. Take a look at 2006 extent at the end of January then look at 2006 extent in mid September.
http://www.ijis.iarc.uaf.edu/seaice/extent/AMSRE_Sea_Ice_Extent_L.png
Sea ice concentration 2008 compared to 2011.
http://home.comcast.net/~ewerme/wuwt/cryo_compare.jpg
Interesting that the smaller icebreaker Magadan is having to stay on the periphery of the ice, having been stuck in it once already. They’re sending another larger breaker to help out the Admiral Makarov. That breaker is its sister ship the Krasin.
Breaking news is the trawler Nimb apparently stuck in the Barents sea.
DaveE.
Incidentally the ice in Okhotsk is at least 2m thick. There’s a 32,000 tonne factory ship stuck there too. Even if they send the 50 Let Pobedy I think they’ll have problems getting that out. The Krasin won’t get there until Sunday.
DaveE.
Ack, the tundra in northern Quebec is dying from lack of cold! Animals & plants are falling over, melted by the extreme heat. Fish are dying from unfrozen water. Polar bears are down to their last Coca Cola.
beng,
You’re right!
Smokey says:
January 6, 2011 at 5:27 am
beng,
You’re right!
=====================================================
“Dr. Slander recounted a recent incident in which a polar bear attacked a local homeless man, and had devoured only a small part of the man’s body before collapsing from exhaustion. “Because of global warming, the bears’ normal way of life is changing rapidly..it’s tragic.””
Thanks for the clarification savetheshark. I’ll take some time to study that word.
John McManus says:
January 6, 2011 at 3:59 am
Our neo-con prime minister thinks that the navigation of open arctic waters will benefit Canada.
It would but isn’t this the danger? All this talk of global warming and an ice free arctic could lead to foolish decisions.
Can you imagine what the result would be if oil rigs where deployed in the arctic circle and the climate/weather became extremely hostile.
Never mind what your “neo-con” prime minister thinks, aren’t you’re Marxist pseudo-scientists playing a dangerous game?
Stick with the tar sands. 🙂
I recall a post on WUWT (could have been a response) sometime during the past 6-18 months documenting ice free conditions in the Arctic during the 1920s-30s(?). Does anyone remember this article?
R Gates “comes out” as a warmist shock.
Goes from “70 percent” to 100 percent warmist in three months.
Wow.
Paul McCulloch says:
January 6, 2011 at 7:16 am
Could it be this one…
http://wattsupwiththat.com/2008/12/12/today-in-climate-history-dec-12th-1938-getting-warmer/
From 2008. I know time flies. 🙂
DaveE.
R.Gates says, “higher than normal amounts of energy remaining in and around the Arctic”. The solar energy doesn’t remain. It returns to space. CO2 and water vapor help it return to space more quickly. The fact that it is passing through the poles more quickly now is evidenced in the cooling of the Tropical oceans. Even the next five years should be quite exciting for weather and climate buffs.
jason says:
January 6, 2011 at 7:20 am
R Gates “comes out” as a warmist shock.
Goes from “70 percent” to 100 percent warmist in three months.
Wow.
_____
I’ve made my position clear here on WUWT from the very beginning. Even if I am only 75% convinced that AGW is likely occurring, then that still makes me a warmist. You put the “100%” label on me for your own convenience.
But also, to those AGW skeptics who downplay the significance of the warming Arctic as seen in a the downward trend in year-to-year sea ice, higher temps, and melting permafrost, it seems a big stretch to assume that it is just a “coincidence” that this exact series of events has LONG been forecast by GCM’s when considering the effects of AGW. I have no problem remaing partially skeptical about AGW, as it keeps me open (honestly open) to other possibilities such as solar & ocean influences, but until I see a reason to suppose that some other of these influences more accurately desribe and predict the same series of effects expected (and currently being seen) from AGW, then I’ll remain 75% convinced that AGW is basically correct and 25% skeptical.
RH says:
January 6, 2011 at 8:42 am
R.Gates says, “higher than normal amounts of energy remaining in and around the Arctic”. The solar energy doesn’t remain. It returns to space. CO2 and water vapor help it return to space more quickly. The fact that it is passing through the poles more quickly now is evidenced in the cooling of the Tropical oceans. Even the next five years should be quite exciting for weather and climate buffs.
____
Obviously I 100% disagree with you. CO2 and water vaper do not help solar energy “return to space more quickly”. I’m not sure what science manuals you’re reading, but you might want to throw them out.
By the way, Summit Greenland is -46C today and this is definitely not the first time this Fall and Winter that it has been that cold there. Ojmjakon and Verhojansk, Russia are -54C and -46C respectively. All of these locations have had extremely cold periods earlier this Fall. It was -40C in Ojmjakon on November 8, 2010.
R. Gates says:
January 6, 2011 at 8:56 am
You are half right, geographically, about Arctic temperatures, but not due to CO2 (Remember? No CO2, No You): See the last graph from Vukcevic
http://www.vukcevic.talktalk.net/MF.htm
David A. Evans says:
January 6, 2011 at 7:46 am
Could it be this one…
http://wattsupwiththat.com/2008/12/12/today-in-climate-history-dec-12th-1938-getting-warmer/
From 2008. I know time flies. 🙂
This may be the post, although I do seem to recall that the article was a current discussion on historical records from the period.
Thanks for the help… time does indeed fly!
Gates, I must ask you, are you saying that the ice is melting in spite of natural atmospheric/oceanic conditions or because of them? And if it is because of them, tell us again how CO2 drives these natural conditions to extremes, changes them, makes them unique, or forces them to act different, that then affects the ice. In particular I am talking about the AO, the invasion of El Nino warmed waters into the Arctic (I refer to the Pacific Warm Pool and its slow migration North), and the warm phase of the Atlantic and its slow migration North.
Pamela Gray says:
January 6, 2011 at 7:01 pm
Gates, I must ask you, are you saying that the ice is melting in spite of natural atmospheric/oceanic conditions or because of them? And if it is because of them, tell us again how CO2 drives these natural conditions to extremes, changes them, makes them unique, or forces them to act different, that then affects the ice.
============================
He won’t be able to produce it for you, because he can’t, Pamela.
I have recommended that he consider applying to do support work for the IPCC or maybe even NASA.
They would welcome him there.
[Not a compliment].
Chris
Norfolk, VA, USA
Pamela Gray says:
January 6, 2011 at 7:01 pm
Gates, I must ask you, are you saying that the ice is melting in spite of natural atmospheric/oceanic conditions or because of them? And if it is because of them, tell us again how CO2 drives these natural conditions to extremes, changes them, makes them unique, or forces them to act different, that then affects the ice. In particular I am talking about the AO, the invasion of El Nino warmed waters into the Arctic (I refer to the Pacific Warm Pool and its slow migration North), and the warm phase of the Atlantic and its slow migration North.
_______
I look at it from the broadest perspective. Do the shorter term signals, such as the PDO, ENSO, and NAO (relative to the longer term CO2 forcing) cause changes in the Arctic sea ice? Undoubtedly. And sometimes, (if AGW is occurring) these natural cycles may reinforce the warming caused by GHG’s, and sometimes they might work against it. I would also not discount the possibility that AGW could change the very nature of these natural ocean cycles. To assume that a 40% increase in atmospheric CO2 will have no affect on ocean heat transport seems foolish at best. In the long run though, if AGW is occurring, on a decade by decade basis we will see more energy from various atmospheric and ocean sources in the Arctic and thus we will see all the signs of long-term warming in Arctic…lower seasonal sea ice, warmer air and water temps, melting permafrost, etc. Also, there must necessarily be positive feed backs as the energy balance changes in such a system on the edge of chaos, much like the collapse of a sandpile turns into mini landslide with the addition of just one single grain of sand. Rapid changes and alterations in atmospheric circulation patterns would not be surprising, and these may well affect things like the AO and the so-called Dipole Anomaly, (which hasn’t been so anomalous these past few years…)
Thought so. You have no idea what the mechanism might be or how much energy is potentially available from the additional amount of anthropogenic CO2 we have experienced in the last 30 years compared to the amount of energy needed to affect these incredibly large, powerful systems.
Oh, and by the way, it really gets tiring to hear some skeptics very incorrectly keep suggesting that climate scientists have only recently “made up” the excuse that lower Arctic sea ice could affect things like the AO or NAO. Here one research paper (from very reputable source) that looks at this subject, and it was published in 2003… 4 years before the dramatic decline we saw in 2007 to Arctic sea ice:
http://journals.ametsoc.org/doi/full/10.1175/1520-0442%282004%29017%3C0890%3ATARTRA%3E2.0.CO%3B2?prevSearch=&searchHistoryKey=
A quote from the study says:
“Thus, unlike in the Atlantic, the Pacific ice anomalies could have a positive feedback on the atmospheric circulation. However, the wave train response was less pronounced and the AO/NAO-like response more prominent in the Win96c compared to the Win96e experiment, which suggests that the enhanced surface heat flux anomalies in the concentration simulations may preferentially excite internal modes of atmospheric variability.”
This is worth a read for those of you who would really like to see what climate scientists have been saying for quite some time about the effects of lower Arctic sea ice on atmospheric circulation patterns.
Pamela Gray says:
January 6, 2011 at 10:03 pm
Thought so. You have no idea what the mechanism might be or how much energy is potentially available from the additional amount of anthropogenic CO2 we have experienced in the last 30 years compared to the amount of energy needed to affect these incredibly large, powerful systems.
________
The mechanism is simple…more energy in the atmosphere and oceans caused from the 40% increase in CO2 over the past 250+ years of steadily increasing fossil fuel buring. Each additional ppm added year to year ensure a bit more energy is kept in the system as opposed to being re-transimtted into space. This energy will of necessity be primarily trapped in the oceans, as it has the highest capacity for storage. A question for you though…why did you use the past 30 years of CO2 build-up in your statement as any effects from CO2 would be cummulative with decided tipping points along the way as would be the case for any energy related system on the edge of chaos?
Just wondering. “The planet’s northern magnetic pole is drifting slowly but steadily towards Russia.” reference: http://www.foxnews.com/scitech/2011/01/06/magnetic-north-pole-shifts-forces-closure-florida-airport/?test=latestnews
Can drifts in the magnetic pole affect climate / weather patterns / ice ?