I’ve held the normal Sunday Sea Ice news until NSIDC released their monthly report, which they did today. I’m repeating it here verbatim. The main issue with Arctic extent has to do with the persistent Arctic Oscillation induced high over eastern Canada, which has kept that area warm this past month, and kept Hudson Bay from freezing over like it normally does. Otherwise, inside the Arctic circle is mostly filled with ice and the areas not filled per normal for this period are mostly outside the Arctic Circle. Click this image for reference:

And if you’ll have a look at this image from NSIDC, you’ll see Hudson bay has started to freeze up as the AO changes.
There’s also some interesting news on the new Multisensor Analyzed Sea Ice Extent (MASIE) which we’ll examine at a future date.
===========================================================
From NSIDC:
Repeat of a negative Arctic Oscillation leads to warm Arctic, low sea ice extent
Arctic sea ice extent for December 2010 was the lowest in the satellite record for that month. These low ice conditions are linked to a strong negative phase of the Arctic Oscillation, similar to the situation that dominated the winter of 2009-2010.

Figure 1. Arctic sea ice extent for December 2010 was 12.00 million square kilometers (4.63 million square miles). The magenta line shows the 1979 to 2000 median extent for that month. The black cross indicates the geographic North Pole. Sea Ice Index data. About the data.
—Credit: National Snow and Ice Data Center
Overview of conditions
Arctic sea ice extent averaged over December 2010 was 12.00 million square kilometers (4.63 million square miles). This is the lowest December ice extent recorded in satellite observations from 1979 to 2010, 270,000 square kilometers (104,000 square miles) below the previous record low of 12.27 million square kilometers (4.74 million square miles) set in 2006 and 1.35 million square kilometers (521,000 square miles) below the 1979 to 2000 average.
As in November, ice extent in December 2010 was unusually low in both the Atlantic and Pacific sides of the Arctic, but particularly in Hudson Bay, Hudson Strait (between southern Baffin Island and Labrador), and in Davis Strait (between Baffin Island and Greenland). Normally, these areas are completely frozen over by late November. In the middle of December, ice extent stopped increasing for about a week, an unusual but not unique event.

Figure 2. The graph above shows daily Arctic sea ice extent as of January 2, 2011, along with daily ice extents for previous low-ice-extent years in the month of November. Light blue indicates 2010-2011, pink shows 2006-2007 (the record low for the month was in 2006), green shows 2007-2008, and dark gray shows the 1979 to 2000 average. The gray area around the average line shows the two standard deviation range of the data. Sea Ice Index data.
—Credit: National Snow and Ice Data Center
Conditions in context
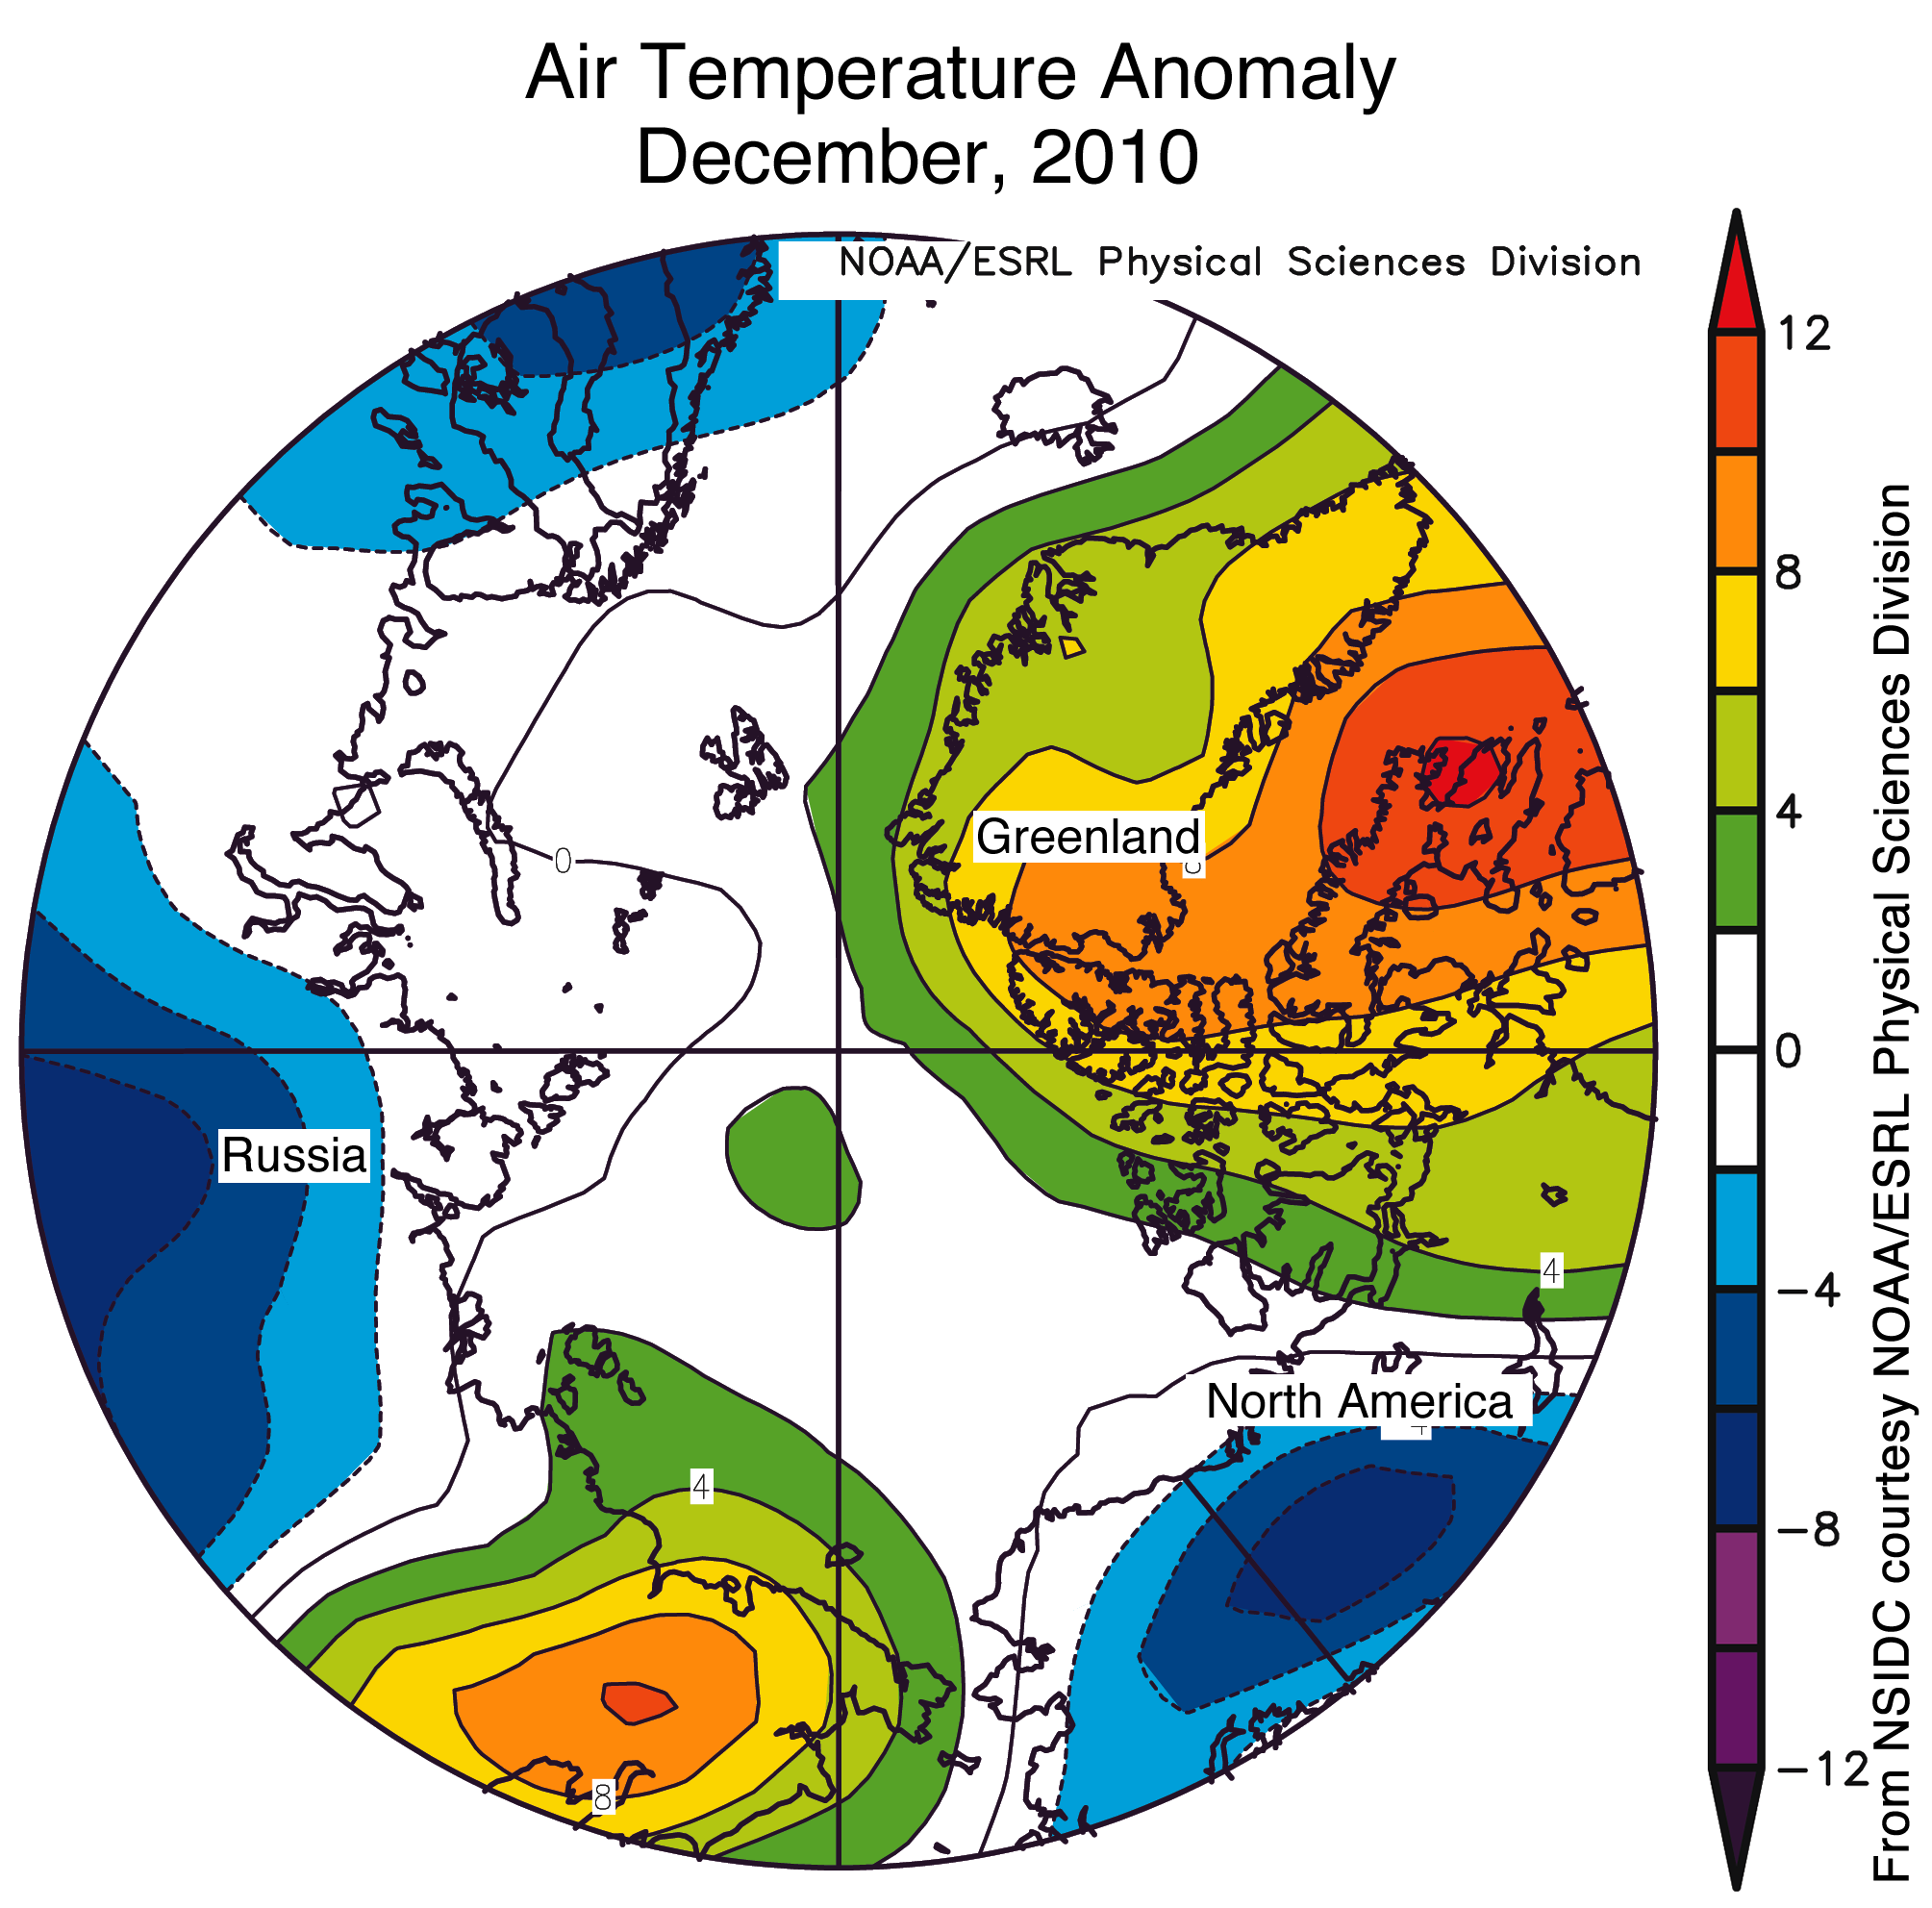
The low ice conditions in December occurred in conjunction with above-average air temperatures in regions where ice would normally expand at this time of year. Air temperatures over eastern Siberia were 6 to 10 degrees Celsius (11 to 18 degrees Fahrenheit) above normal in December. Over the eastern Canadian Arctic Archipelago, Baffin Bay/Davis Strait and Hudson Bay, temperatures were at least 6 degrees Celsius (11 degrees Fahrenheit) higher than average. Southern Baffin Island had the largest anomalies, with temperatures over 10 degrees Celsius (18 degrees Fahrenheit) higher than normal. By sharp contrast, temperatures were lower than average (4 to 7 degrees Celsius, 7 to 13 degrees Fahrenheit) over the Alaska-Yukon border, north-central Eurasia, and Scandinavia.
The warm temperatures in December came from two sources: unfrozen areas of the ocean continued to release heat to the atmosphere, and an unusual circulation pattern brought warm air into the Arctic from the south. Although the air temperatures were still below freezing on average, the additional ocean and atmospheric heat slowed ice growth.
 Figure 3. Monthly December ice extent for 1979 to 2010 shows a decline of 3.5% per decade.
—Credit: National Snow and Ice Data Center
December 2010 compared to past yearsDecember 2010 had the lowest ice extent for the month since the beginning of satellite records. The linear rate of decline for the month is –3.5% per decade.
 Figure 4. Air temperatures were higher than normal over Baffin Island, Hudson Bay, and eastern Siberia for the month of December, which was associated with low sea ice extent in those areas. The temperature pattern resulted from a negative phase of the Arctic Oscillation.
—Credit: NSIDC courtesy NOAA/ESRL PSD
Negative phase of the Arctic Oscillation
As in December 2009, a strongly negative phase of the Arctic Oscillation dominated the middle and high latitudes of the Northern Hemisphere in December 2010, bringing higher-than-normal pressures to the Arctic region, with lower-than-normal pressures in middle latitudes. However, unlike 2009, when higher-than normal pressures centered near the central Arctic , in December 2010 higher pressures centered near Iceland and the eastern tip of the Aleutians in the Pacific, and yielded a different pattern of winds. As a result, different areas experienced warm anomalies in 2010, and a different pattern of ice extent emerged.
Our January 5, 2010 post discussed the connection between very warm temperatures over much of the high Arctic in December 2009 and a strongly negative phase of the Arctic Oscillation.
 Figure 5. This full-year graph puts 2010 sea ice extent in context. The gray line shows the 1979 to 2000 climatology, thick blue-gray indicates the 1979 to 2008 (30-year) climatology, dashed green shows 2007, and 2009 is shown in sky blue. Sea Ice Index data.
—Credit: National Snow and Ice Data Center
2010 year in review
Despite a late date of the maximum in winter sea ice extent, the minimum sea ice extent for September 2010 was third lowest in the 1979 to 2010 satellite record, above only 2007 (the record low) and 2008. The late summer of 2010 saw an open Northwest Passage: this year, the deep water channel (the northern route) from M’Clure Strait to Lancaster Sound was navigable. The Northern Sea Route along the Siberian coast also became briefly navigable.
2010 started out with a highly negative phase of the Arctic Oscillation, an atmospheric pattern that in the past has favored the survival of old ice through the winter, and more ice at the end of this summer. But this tendency seems to be changing. A recent study led by Julienne Strove of NSIDC showed that while wind patterns linked with the strongly negative Arctic Oscillation winter of 2009-2010 transported much old ice into the southern Beaufort and Chukchi Seas, most of this ice later melted. It may be that with a warmer Arctic, old rules regarding links between the atmospheric pressure patterns and sea ice extent no longer hold. So far the winter of 2010-2011 has also had a strongly negative Arctic Oscillation, but it is not yet clear how this pattern will affect summer sea ice.
 Figure 6. The graph of Antarctic sea ice extent as of January 3, 2011. Light blue indicates 2010-2011, dark blue shows 2009-2010, and dark gray shows the 1979 to 2000 average. The gray area around the average line shows the two standard deviation range of the data
—Credit: National Snow and Ice Data Center
A note on Antarctica
While sea ice is growing in the Arctic, it is early summer in the Antarctic and sea ice is melting. For the past four months, Antarctic sea ice extent has remained well above average. The high ice extent around Antarctica appears to relate to a persistently positive phase of the Southern Annular Mode—an Antarctic counterpart to the Arctic Oscillation—and to the mild La Niña conditions in the Pacific. In December 2010, the monthly mean Southern Annular Mode index was lower, and Antarctic sea ice extent had dropped back to within about standard deviation of the mean.
For more information about Antarctic sea ice, see the Frequently Asked Questions section. Antarctic sea ice data is available on the Sea Ice Index.
New sea ice data
NSIDC has recently released a new sea ice extent product, called the Multisensor Analyzed Sea Ice Extent (MASIE). The MASIE project is a collaborative effort with the U.S. National Ice Center to provide a daily high-resolution sea ice extent estimate based on the NOAA Interactive Mapping System (IMS) product. This new product is considered more accurate for tracking the current position of the ice edge; for climate studies, the passive microwave product (on which Arctic Sea Ice News & Analysis is based) is preferred for a more consistent, long-term average. For more information, read an article about the product at the NSIDC Monthly Highlights Web site.
Further reading
Stammerjohn, S. E., D. G. Martinson, R. C. Smith, X. Yuan, and D. Rind, 2008. Trends in Antarctic annual sea ice retreat and advance and their relation to El Nino — Southern Oscillation and Southern Annular Mode variability. Journal of Geophysical Research, 113, C03S90, doi: 10.1029/2007JC004269.
Stroeve, J.C., J. Maslanik, M. C. Serreze, I. Rigor, W. Meier, and C. Fowler. 2010. Sea ice response to an extreme negative phase of the Arctic Oscillation during winter 2009/2010. Geophysical Research Letters. In Press.
===============================================================
As always, up to date info is available 24/7/365 on the WUWT Sea Ice Page
It’s warm in one plkace and cool in another.
Brilliant climatological insight.
REPLY: Uh no, you’re the one with the problem. It’s weather, not climate when we discuss the AO and the short term effects it has on regions.- Anthony
Tamino has shown that 2010 is the hottest year on record,
http://tamino.wordpress.com/2011/01/02/hottest-year/
Looks like were about to be baked at 450 for decades and decades to come.
Be intersting to see the Cryosat-2 data when it comes on stream – anyone know when summary data will be available to the public?
When I look at the current charts I see little or no Ice in the Sea of Okhotsk.. and yet there are ships caught in the ice there.. Watts up with that? http://news.uk.msn.com/articles.aspx?cp-documentid=155759835
Yes, the strong AO is doing a job on arctic “ice extent” which was the lowest for December in the satillite record. Anyway, the amount of ice in winter is not as important as ice during summer for arctic wildlife.
Is there any evidence whether a late freeze during fall and winter carries over to faster melting during the following summer?
The problem with attributing low Arctic sea ice to the negative AO is that the sea ice steadily declined throughout the previous period of positive AO.
I think one needs to take into account the sea ice depleting effect of the long run of late 20th century El Ninos that fed increasingly warmer water into the Arctic Circle with eventually a peak melt around 2007.
The effect of the negative AO is more likely to be of delaying the recovery rather than causing the decline because a more negative AO encourages warm air flows in and cold air flows out of the Arctic Circle so the polar regions warm up even whilst mid latitudes cool down.
The effect of the positive AO was more likely to be of delaying the decline rather than causing it because a more positive AO isolates the poles from warm air flows in so the polar regions actually get colder even whilst the rest of the troposphere warms up.
Top quote of the new year comes from this gem:
“The warm temperatures in December came from two sources: unfrozen areas of the ocean continued to release heat to the atmosphere, and an unusual circulation pattern brought warm air into the Arctic from the south.”
As if warm air advections in the Arctic were “unusual”… such willful ignorance of atmospheric circulation is amazing…
“… and an unusual circulation pattern brought warm air into the Arctic from the south.”
well and since the Arctic is warming so much, soon warm air will come from the North… and cold air will come from outer space brought by aliens who scared the birdies over Arkansas… but that will be a normal atmospheric circulation pattern! LOL
As for Tamino, GIssGOss…
Why is Hudson Bay considered “arctic sea”? Can anyone go back, remove the Hudson Bay area from the base line and stop counting it, then show what the difference in real arctic ice anomalies would be?
Since 30 December, Russian ships have been trapped by ice in the Sea of Okhotsk, part of the Gulf of Sakhalin, and rescue attempts have so far been frustrated. The drama, redolent of the 1983 ice crisis, apparently involves ten ships, including a research vessel and what are described as three “fishing boats”. With crews totalling 400, it is more likely that these are factory or processing ships.
The BBC report, claiming to cite the Russian news agency TASS, refers to ice of 12-inch depth – which seems unlikely. Ice hardened ships, which would be needed in these waters, can usually handle up to three feet (1 metre) of ice. Sure enough, the TASS report talks of ice approaching two metres thick, with the icebreaker Magadan (pictured below) struggling to reach the trapped ships. Such is the density of the ice that it had to halt four miles away from the vessels.
According to a second report by TASS, Magadan will be joined by the Admiral Makarov icebreaker, one of the largest in the far eastern icebreaker fleet. Rescue operations will then resume, scheduled for 4 January. No lives are said to be at risk. Currently, temperatures are reported down to -22°C and the extent of ice has clearly caught the Russian by surprise – and indeed the thickness, as the Magadan has been unable to cope.
How does the above report at http://eureferendum.blogspot.com/ compare with the map above showing no ice in the Sea of Okhotsk?
With Russian ships still trapped in the Sea of Okhotsk, in ice of two-metre thickness, Republican American blogger Steve Macoy recalls a 2006 symposium on global warming.
Illustrated were findings that that a large warming area existed in the western part of the Sea of Okhotsk, and a warming trend widely extended toward the western North Pacific. It was thus “widely believed” that the global warming was recently proceeding and the East Siberia region just north of the Sea of Okhotsk was one of the most sensitive areas to the global warming in the Northern Hemisphere.
The Sea of Okhotsk turns out to be quite an important area from the warmist perspective, this paper reporting that it plays a role as the pump of the North Pacific – thus having a significant effect on the climate of the region. It forms a significant ice factory for the whole region and there are said to be “clear indications of global warming” around the sea.
This report in 2006 claimed a dramatic shrinkage of ice (illustrated), and a shortening ice season – with dire economic consequences. And it was this paper which reported on the area of the sea being “a sensitive area to the current global warming”, despite cyclical effects being reported elsewhere.
With the region now experiencing thick – and evidently unexpected – ice, this is clearly of more importance than just the trapping of a number of ships. The ice in the whole region is something of a warmist poster child, and another one that has suddenly lost its appeal.
http://eureferendum.blogspot.com/ Richard North has more news of the drama occurring as one of the icebreakers has got stuck as well.
“North Pole ice ‘may disappear by September'”
“The Centre [NSIDC] has been predicting that the Arctic Ocean could be virtually ice-free by 2012 but that point may be reached within months rather than years.
—
That has been the widely published and supported prediction for the last 5 years.
Everyone has heard it at least 30 times.
By 2012, now mean This Year. The predition is that the Arctic Will Be Ice Free THIS YEAR, in September; no more waiting around for the ‘in five years’ lead time.
Let us wait and see just how well they can predict the climate Five Years In Advance.
Ice free, this year.
—
“North Pole ice ‘may disappear by September'”
By Paul Eccleston 2:45PM BST 27 Jun 2008
http://www.telegraph.co.uk/earth/earthnews/3345666/North-Pole-ice-may-disappear-by-September.html
Global warming caused Brain Freeze. Fortunately, it only affects people who believe in man-made global warming.
Tom in Florida says: January 5, 2011 at 3:01 pm
“Can anyone go back, remove the Hudson Bay area from the base line and stop counting it, then show what the difference in real arctic ice anomalies would be?”
Well here’s NSIDC’s plot for Hudson Bay;
ftp://sidads.colorado.edu/DATASETS/NOAA/G02186/plots/r10_Hudson_Bay_ts.png
and here’s the one from Cryosphere Today:
http://arctic.atmos.uiuc.edu/cryosphere/IMAGES/recent365.anom.region.13.html
Here is NSIDC’s data broken out by region for the last 30 days:
ftp://sidads.colorado.edu/DATASETS/NOAA/G02186/masie_extent_sqkm.csv
Note how Sea Ice increased in Hudson Bay until December 15th (2010349) and then dropped, remaining below the Dec 15th high for 13 days until Dec 28th (2010362). A similar retrenchment also occurred in Baffin Bay/Gulf of St. Lawrence.
Also, in addition to the negative Arctic Oscillation noted in the NSIDC press release, the North Atlantic Oscillation (NAO) has been in an extended negative phase as is reflected in this NAO index chart;
http://www.cpc.ncep.noaa.gov/products/precip/CWlink/pna/month_nao_index.shtml
In fact the North Atlantic Oscillation (NAO) Index has been negative for last 15 months;
http://www.cpc.ncep.noaa.gov/products/precip/CWlink/pna/norm.nao.monthly.b5001.current.ascii.table
which is the longest stretch of negative monthly NAOs in the historical record.
If you look at the 60 year trend of the North Atlantic Oscillation (NAO) Index;
http://www.cpc.ncep.noaa.gov/products/precip/CWlink/pna/JFM_season_nao_index.shtml
it looks like the trend of more positive AAOs that began in the 70s has ceased, and the AAO may be trending towards more extended and strongly negative phases in the coming years.
For those of you who would like to keep track Arctic Sea Ice by region, NSIDC’s monthly info is here;
ftp://sidads.colorado.edu/DATASETS/NOAA/G02186/
the plots are here;
ftp://sidads.colorado.edu/DATASETS/NOAA/G02186/plots/
and Cryoshpere Today’s data can be found under the banner “Latest regional sea ice coverage and anomalies” halfway down on this page:
http://arctic.atmos.uiuc.edu/cryosphere/
pkatt re where’s the ice in Sea of Okhotsk
looks like ice to me here:
http://arctic.atmos.uiuc.edu/cryosphere/NEWIMAGES/arctic.seaice.color.003.png
pkatt says:
January 5, 2011 at 2:11 pm
When I look at the current charts I see little or no Ice in the Sea of Okhotsk
Are you sure?
Here is the NIC Snow & Ice Chart (Asia & Europe) for Wed 5 Jan 2011
Since the Arctic sea ice extent hasn’t declined 3.5% per decade, then certainly there must be one month out of the year that is showing a gain.
Does anyone have the data to produce a graph for each of the months Jan-Nov?
Tom in Florida:
Hudson Bay has been known as a bay off the Arctic ocean for some time. Henry Huson had a hand in this recognition.
Many people understand that Hudson Bay gets cold.
If you have trouble with Henry Hudson, think of the Hudson River. He did a bit of exploring a long time ago.
Tom in Florida re: what would anomalies be without Hudson’s Bay
based on data from cryosphere today, Hudson’s Bay is off its mean by 500,o00 km2
http://arctic.atmos.uiuc.edu/cryosphere/IMAGES/recent365.anom.region.13.html
therefore if Arctic is less than its mean by 800,000 km2, Hudson’s Bay accounts for 5/8 of anomaly
MSN says that two Russian ships have been freed from ice today.
WUWT,
DMI has a 2011 temperature graph at http://ocean.dmi.dk/arctic/meant80n.uk.php that isn’t making it onto your pages for some reason. It continues to be hot, hot, hot, at least by comparison to the norm.
REPLY: It is on our sea ice page 24/7/365 so your concern is unwarranted. – Anthony
Being lower than Dec 2006 is certainly not pleasant. Otoh, the areas where it is lower are generally outside the central core that is going to determine next summer’s minimum.
And, yes, “extent” still sucks, even tho it is what we have. C’mon Cryosat-2!
“Repeat of a negative Arctic Oscillation leads to warm Arctic, low sea ice extent”
As we all know, during NH winter the arctic is pointing away from the sun. It’s not warm, just less cold.
If surface ice insulates the liquid water below it from losing energy, it follows that having less ice means more energy lost from the water, to the air, then to space. This is a signal of warmth now, but with cooling taking place.
and dark gray shows the 1979 to 2000 average
==========================================
I have a real problem with this.
There was cooling to the point of predicting the next ice age, from 1945 to the mid 1970’s.
That was a 30 year bounce down and a 3o year bounce back to the year 2000.
The 1979-2000 average has entirely too much of that bounce back in it for it to be “average”.
Since it’s obvious that last few years sea ice extent has been trending much closer together than the “average”/”normal”……
…isn’t it about time someone sat down and established a new/real average/normal
Could there also be increased activity on the Gakkel ridge? Is anyone looking?
http://volcanism.wordpress.com/?s=Gakkel+ridge&searchbutton=go!
OTOH, Tom Moriarty doesn’t think there would be enough heat.
http://climatesanity.wordpress.com/2008/07/10/volcanos-in-gakkel-ridge-not-responsible-melting-the-arctic-ice/
Let me stake my claim! If Global Warming gives rise to record breaking low temperatures then I hypothesise that Global Cooling gives rise to record breaking, and unprecedented, high temperatures.
Both conjectures are unfalsifiable, each is based upon belief but only one is fiscally profitable.
By standing upon the shoulders of the “Ice Age Commeth” prophets of earlier decades, I can cite CO2 as the main driver of CC, as easily, as the proponents of fiery death can. The task being made easier, of course, as many of the proponents have switched sides and are now lapsed prophets.
To whom do I send my funding application?