Note: I want to thank everyone who commented here and elsewhere regarding my last post about GISS that sent everyone into a tizzy. All that is very helpful. Here’s more on GISS and the AO. -Anthony

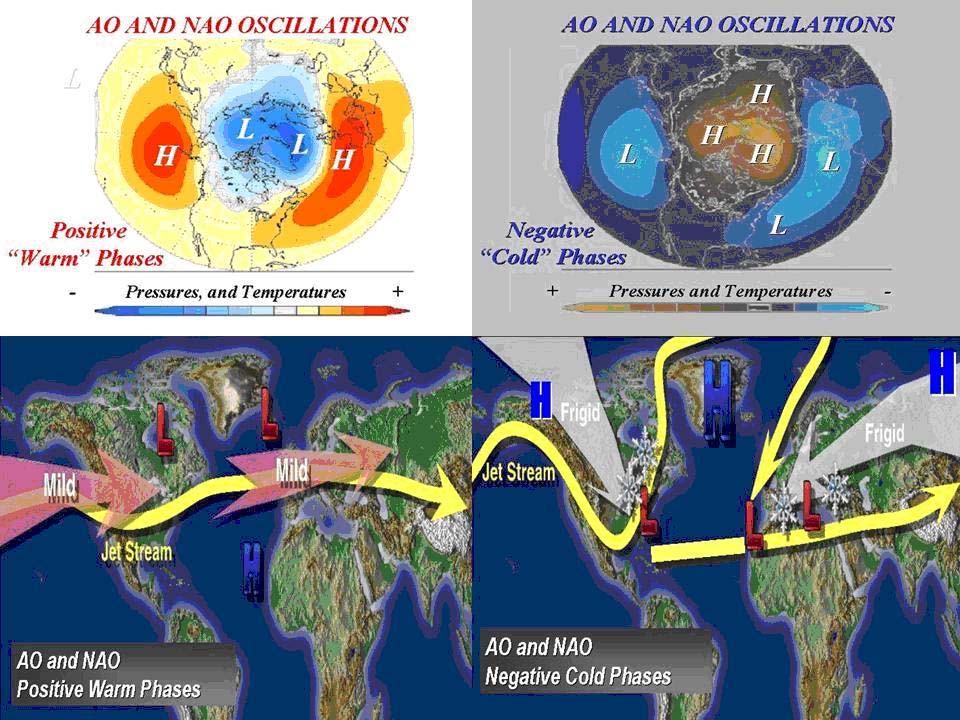
Effects of the Positive Phase | Effects of the Negative Phase
of the Arctic Oscillation of the Arctic Oscillation
(Figures courtesy of J. Wallace, University of Washington)
By Joseph D’Aleo, CCM
In a recent post to counter the snow and cold in the news that was spoiling the announcement by Dr. Hansen that it was the warmest year on record, NASA GISS authors note for November:
“Northern Europe had negative anomalies of more than 4C, while the Hudson Bay region of Canada had monthly mean anomalies greater than +10C. The extreme warmth in Northeast Canada is undoubtedly related to the fact that Hudson Bay was practically ice free. It is for this reason that some of the largest positive temperature anomalies on the planet occur in the Arctic Ocean as sea ice area has decreased in recent years.
The cold anomaly in Northern Europe in November has continued and strengthened in the first half of December. Combined with the unusual cold winter of 2009-2010 in Northern Hemisphere mid-latitudes, this regional cold spell has caused widespread commentary that global warming has ended. That is hardly the case.”
Bob Tisdale has relevant posts on Watts Up With That that here shows how NASA GISS removed Arctic and Southern Ocean sea surface temperature data and then used 1200km smoothing that uses land stations to refill in the data (resulting in a warming) and here how leftover warm water from a strong El Nino gets spun up into the Kuroshio-Oyashio Extension (KOE) where it continues to release heat to help explain why the ‘global warmth’ has persisted into the early stages of the current La Nina.
See in this Steve Goddard post here how Hansen blamed the cooling in recent years on La Nina but now has decided this El Nino warming is global greenhouse warming.
Even Kevin Trenberth, head of climate analysis at the National Center for Atmospheric Research in Colorado, admitted here: “We have seen rapid warming recently, but it is an example of natural variation that is associated with changes in the Pacific rather than climate change.”
We have shown how NASA and the other data centers have mined the data for warmth and manipulated the data – new and old – to enhance the apparent warming. This includes a cooling (up to a quarter degree or more celsius) of the pesky warm period from the 1920s to 1950s right up to 1980. This includes the NASA GISS base period for anomalies of 1951 to 1980. Numerous data issues post 1980 have exaggerated the warmth.

The warming NASA remarked about this fall in northeast Canada and Hudson Bay is part of the very strong negative arctic oscillation pattern we have seen the last few years, in part related to the long solar minimum and high latitude volcanoes.

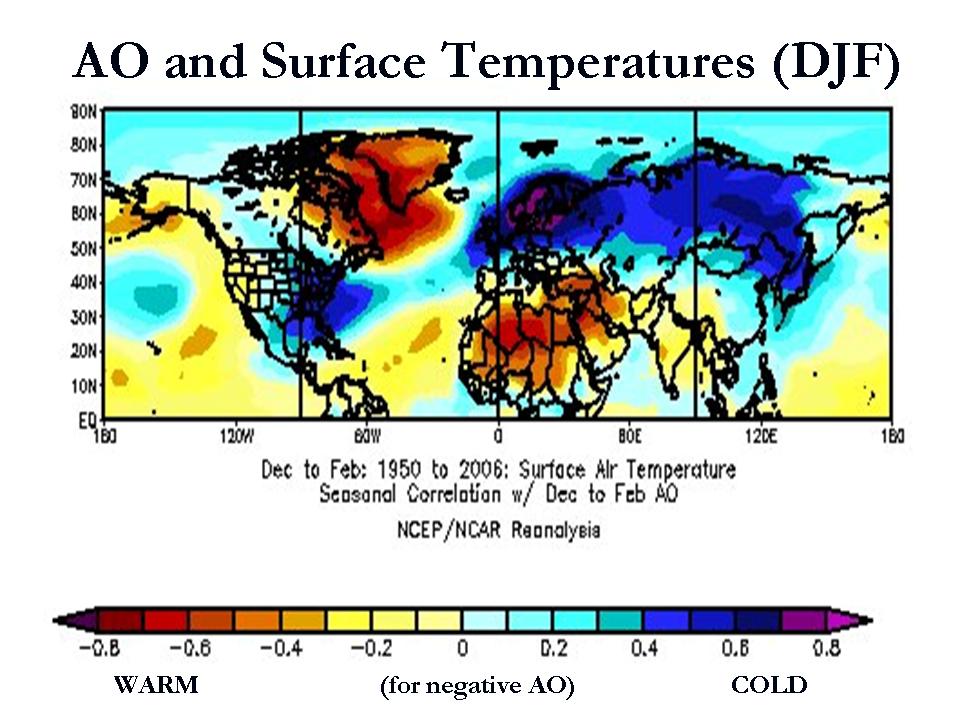
The positive AO state is characterized by an anomalously strong polar vortex that traps cold air in high latitude and more zonal mid-latitude jet stream that allows maritime Pacific air to invade North America and Atlantic air to flood Europe often as far east as the Urals. In the negative mode, high pressure dominates the polar region and North Atlantic, shunting arctic air south in North America and Siberian air west to Western Europe.
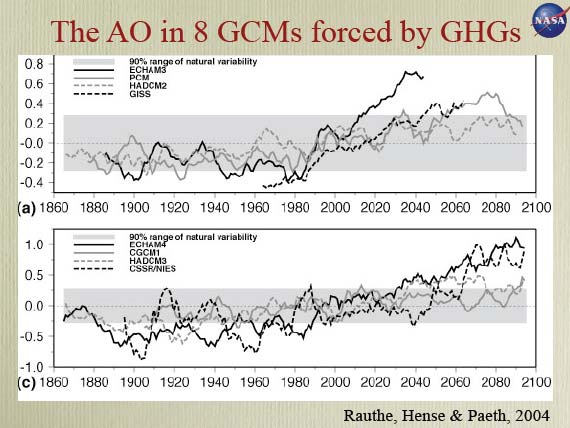
The greenhouse models all predict an increase in the frequency and strength of the positive arctic oscillation in time, most (2/3rds) exceeding the 90% range of natural variability.

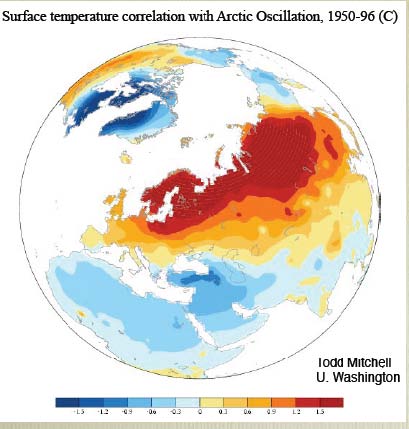
A positive AO would lead to increasing temperatures in the Northern Hemisphere continents with colder than normal air trapped in the arctic down to the northern parts of Canada and Hudson Bay. The following from Mitchell shows the warmth over Eurasia.

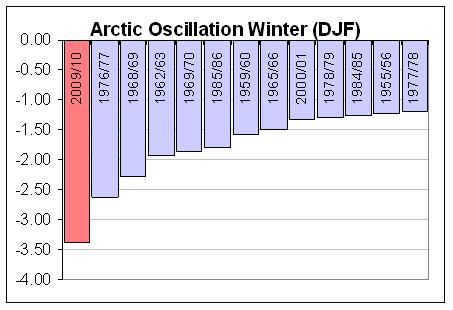
Last winter saw the most negative AO of the record back to 1950.

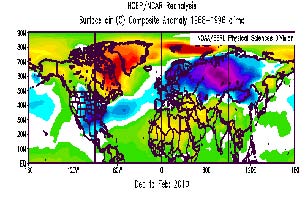
The global anomalies with a negative winter AO are as follows:

See how well that verified this past winter. No GHG need apply.

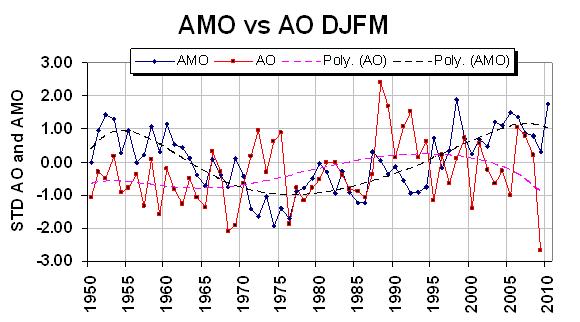
As noted, the North Atlantic Oscillation, an important component of the overall arctic oscillation varies with the ocean temperature tripole in the Atlantic, known as the AMO or Atlantic Multidecadal Oscillation. When the Atlantic is in the warm positive AMO mode as is currently the case, the NAO and AO tend to be more negative.

When the AMO is positive with warm water in the North Atlantic and in the Tropical Atlantic, the NAO was mainly negative (1960s). When the North and Tropical Atlantic turned cold in the 1980s, the NAO was mainly positive (data in chart above through 1999). Note the AMO flipped positive (warm) in 1995 with a big dip in the NAO. See the inverse relationship with the AO in the graph below. Data for both is averaged for the December through March periods and standardized.

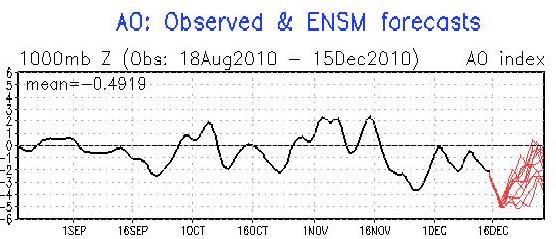
So far this late fall, the AO has been mainly negative and forecast by the model ensembles overnight to reach 5 standard deviations negative the next few days.

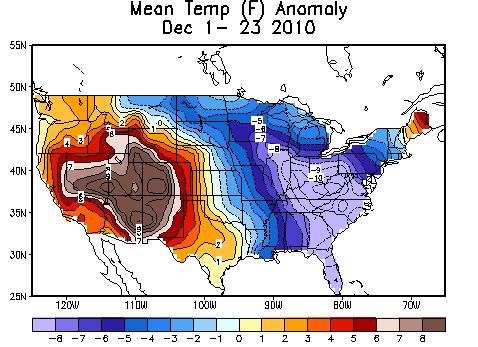
This explains not only the brutal cold in Europe and Asia but also the amazing 11F negative anomalies in the southeastern United States.

PDF of this report here.
Discover more from Watts Up With That?
Subscribe to get the latest posts sent to your email.
RE: ZT says:
December 15, 2010 at 9:34 pm
Thanks for the link.
Interesting that the Center for Biological diversity release of Dec 14/15, the source of Dr Mann’s comment you provided, which calls for the Obama administration to increase the protection of polar bears, would choose to use Dr Mann’s observations about the plight of the polar bears – he observed apparently pining for winter ice on Hudson’s Bay – as a feature quote.
First because Dr Mann is a climate scientist, not a biologist.
Second because the bears Dr Mann observed on Hudsons Bay – Canadian as maple syrup – are hardly going to be helped by any designation the US gives to the polar bear.
Brutal cold to Europe?
We have only -20 C in northern Finland. 0 C in south. It is nothing. A mild winter day. Brutal cold is below -40 C. Then you have to use arctic diesel, wear hat inside a car, use long underwears, able to ski max 60 min, etc.
Last witer supposed to be cold. But the teperature was only two days below -40 C (just -41 C). The all time record is -52 C. We were nowhere near to it. This winter is going to be same. A colder that couple of last winters, but nothing compared that it used to be in 70’s and 80’s.
I wonder if Al Gore has Emergency food surpplies for the next ice age ?
“Julian in Wales says:
December 15, 2010 at 10:30 pm
Do we know whether these types of weather patterns prevailed during the Dalton and Maunder minimums? Is it a possibilty that we are seeing the beginnings of another long period of cold in Europe, another mini ice age? ”
There is lots of anecdotal evidence and reports from ships logs confirming that in earlier global cooling periods (when the sun was less active) the jets were generally more equatorward and/or more meridional in their movements. There are short term exceptions but I would put that down to oceanic modulation of the jet stream positions partly offsetting the solar effect on the polar vortices.
It was also the case but to a lesser degree in the mid 20th century cooling period which coincided with quieter solar cycle 20 and negative ocean cycles.
What happens next appears likely to depend on how long the solar quietness continues. It is a bit early to have reached the warming peak of the historical 1000 year cycle so this could be a temporary situation but we really do not know.
Whatever, the link between solar activity and the polar vortices is becoming more likely by the day. To break the link we would need to see a lengthy period of positive AO whilst the sun remains quiet and there is no strong El Nino or series of El Ninos pushing the jets poleward.
If there are any research funds available they should be directed at the region from stratopause upwards and the chemical reactions arising from changes in the density, speed and composition of the solar wind.
December 16, 2010 at 1:53 … Sorry Jussi… How disappointing… Don’t be too sure there
won’t be some places reaching -40C or -45C…after all -36,6C already in November in Nikkaluokta…How much in Finland…?? Greetings from across the Baltic de SL…
‘”Northern Europe had negative anomalies of more than 4C, while the Hudson Bay region of Canada had monthly mean anomalies greater than +10C.”‘
So essentially, as an example, going from -20° C to -10° C is considered to exclamation point and underscore “+10C”.
Looking at the images of today at ec.gc.ca more ‘an half of Hudson bay has frozen over already! No wonder those poor poor polar bears are starving with less and less open water.
I played with the Canadian Ice Service IceGraph and got these:
Historical accumulated ice trend’s down sloping.
http://tinyurl.com/2a2rh8p
But of course the historical ice coverage trend’s is up and up
http://tinyurl.com/26auxlm
And the historical weekly ice coverage i got this, where, apparently, not much ever happens.
http://tinyurl.com/2agxf6a
It seem to me that I know have enough “evidence” to write me a “scientific” paper laying out the “facts” that: Hudson Bay’s ice coverage is a no worry. Of course that is a only a maybe, but a really good trollified maybe, I could of course be completely wrong and Hudson Bay might be going down the drain, polar bears becoming extinct by 2020 and all that, but for a very hefty grant I could up the confidence interval and be more sure about what’s going on with that unnaturally warm polar bear pond.
If that doesn’t work I read that the whole region is going through a 60 cm uplift per 100 years, so, soon all that water might break the surrounding natural walls and flood the whole of north eastern Canada . . . by my calculation about 08:02 pm, 3 och may, 2031. Of course I don’t know this for sure, but just imagine that not only will the polar bears in that region, probably, drown, you wont have any children left to cry over the poor polar bears because, to not suffer the same horrible fate of rapidly thinning oxygen concentration, they, unlike stubborn you, will, according to my socioeconomic statistical analysis of your current situation, leave the threatened area with half the marriage by 2019 already.
But like I, almost said, nothing is sure but sure is as sure as feeling sure and for a hefty grant I could probably come up with other less doom and gloomy mights and maybes.
When the Atlantic is in the warm positive AMO mode as is currently the case, the NAO and AO tend to be more negative.
I am not sure this is rock solid. The AMO recently has lagged the PDO but eventually gets in line. 1970 saw both oceans at negative and the NAO was also the same and it was also the low point of the NAO, temperature and solar output.
The position of the blocking highs and what drives them is interesting. After all they are what control the atmospheric teleconnections. Looking at the position of the global static high pressure zones right now they are above the areas of highest SST. Does the warm water suck in the high pressure zones or is it the other way around?
Chris
Norfolk, VA, USA
Wow. Coldest ever. Of course….that is only 120 or so years. So no big deal, right R Gates?
If it is no big deal on being the coldest “ever” then it is no big deal your stupid alarmist crap about the quote unquote long-term trends in the Arctic.
Don’t hold back, Chris, tell it how it is!!!!!!!!!
Reading post like these with NASA splashed all over them reminds me of being young and idolising NASA, it’s a shame when you lose your childhood innocence to be replaced by doubt and shame.
It’s a sad day for the little boy inside me who always wanted to fly to the moon with NASA.
It occurrs to me that the giant push to create new global governance built on the “crisis” of warming that MUST BE ADDRESSED NOW, before its too late, is a little too convenient to have been coincidental. It would appear we need to rethink the premise that correlation does not prove causation… in some cases, it just might. Perhaps, the cooling cycle was seen coming and the warmist social justice grant stooges had good reason to create a policy driving panic… the rationale for their enrichment was about to be stripped away… brings new meaning to the phrase “get it while it’s hot”!
An article from April, 2010; physicists saying the sun is causing cold winters in the UK and Europe, and that there will be more cold winters to come. Also, Mann is quoted as saying he knew the cold of 300 years ago and the warmth of 1000 years ago were due to solar variability. Delicious.
http://physicsworld.com/cws/article/news/42298
I assume that the GISS boys and girls think they are so clever that no one else on earth can figure their chicanery out — Bad choice.
I think a better use of time would be to study the onset of the next glaciation period, as it is now past due. Things like, what triggers it? And what can humans do to cope.
Stephen Wilde says:
December 16, 2010 at 2:06 am
Hi Stephen, while agreeing with your general thrust, there are a couple of points you have made that bear more research.
What happens next appears likely to depend on how long the solar quietness continues. It is a bit early to have reached the warming peak of the historical 1000 year cycle so this could be a temporary situation but we really do not know.
I have researched solar activity over the Holocene and there does not appear to be a 1000 year cycle. But there might be a 4800 year cycle where the golden era’s like the LIA are repeated.
If there are any research funds available they should be directed at the region from stratopause upwards and the chemical reactions arising from changes in the density, speed and composition of the solar wind.
The solar wind is fickle and does not follow the solar cycle directly, it also does not really fluctuate all that much….I would be putting my money into EUV and the size of the ionosphere first.
Has anyone ever had the temerity to ask Hansen or Trenberth the following:
‘The Earth’s climate is clearly headed for an orgasm fairly soon. Do you think it will display the characteristics of a male one or a female one?’
I suspect the answer to that will determine whether the climate heads rapidly toward an ice age, gently back down to a 1970s mean or, if the opposite sex’ performance left something to be desired, a plateau followed by another bout of warming……
Both things are associated with wave-like oscillations you know……….
But it might get those two off their hobby horses and a bit more able to laugh at their own inconsistencies……….
Stephen, what about doing a guest post about it? My feeling is exactly the same, changes in cloud cover causing SST changes, resulting in shifts in air circulation do much sense.
Btw, MWP has been also explained as long-term persisting NAO.
http://climateaudit.org/2009/04/17/explaining-a-positive-nao/
Julian in Wales says:
December 15, 2010 at 10:30 pm
I do find these posts quite difficult to follow, I hope this is not foolish question. Do we know whether these types of weather patterns prevailed during the Dalton and Maunder minimums? Is it a possibilty that we are seeing the beginnings so of another long period of cold in Europe, another mini ice age?
I remember reading that the famines and mini ice age in the 1300s started with very wet summers in the UK, so wet the farmers could not harvest their crops. We had very wet summers here in the UK in 2008 and 2009, so wet that many farmers did not get their hay inside until September. If they had not had modern machinery it would have rotted in the fields.
Gareth says,
Indeed Julian as a smallholder I have also observed this change over the last few years and it’s similarity to mediaeval records. The main change appears to be these high pressure areas in the Winter, with constant low pressure in the summer. I suspect something is happening that none of us, warmist or skeptics predicted. Interesting to hear the cracks in the radio 4 news where one presenter suggested we need to get used to these low winter temperatures and re-purchase the snow ploughs that were scrapped on the basis of snow being a thing of the past. I would imagine Eddy Mayer took the employee to task for the comment and she is even now being “re-educated” in the cellars under Bush house, but even so it’s interesting to hear that journalists and presenters are breaking ranks on climate change.
Nadoleg Llawen!
( Merry Christmas to our non-Celtic friends)
A naive question: What does it make change the Arctic Oscillation?. Just because we can not go back to sleep without knowing the truth. A tag it is not enough.
This from NOAA http://www.wrh.noaa.gov/pdt/
“On This Day, December 16, In 1917, An Ice Jam Closed The Ohio River Between Warsaw, Kentucky And Rising Sun, Indiana. The Thirty Foot High Ice Jam Held For 58 Days, And Backed Up The River A Distance Of 100 Miles.”
I would bet that much of the same atmospheric conditions were in play in 1917 that are current right now. The placement of the ice dam certainly corresponds with the Arctic blast location. Except the Arctic blast probably started before December 16 and stayed around for a longer time. It will likely happen again since there is no reason to believe it would not. The conditions that lead to this kind of cold are clearly driven by natural forces much stronger than minute increases in CO2 atmospheric ppm. These kinds of atmospheric conditions have comparatively tremendous energetic power behind them than do the tiny affects of fractions of increases in ppm greenhouse gasses, and easily sweep aside such things. These large ice dams will happen again.
“Northern Europe had negative anomalies of more than 4C, while the Hudson Bay region of Canada had monthly mean anomalies greater than +10C. The extreme warmth in Northeast Canada is undoubtedly related to the fact that Hudson Bay was practically ice free. It is for this reason that some of the largest positive temperature anomalies on the planet occur in the Arctic Ocean as sea ice area has decreased in recent years.”
http://www.cpc.ncep.noaa.gov/products/precip/CWlink/stormtracks/mstrack.shtml
Or it could be that changes in the AO, AMO, & NAO cause changes to weather patterns.
Julian in Wales and Stephen in England
You are interested in the mechanisms that drive climate change. Here is my viewpoint, an unconventional one because I am not a believer that CO2 makes one iota of difference to atmospheric temperature. I see the atmosphere as a very effective heat vent to energy that arrives at the surface having run the gauntlet of a ‘cloud zone’ of variable transparency.
Negative AO corresponds to strong surface atmospheric pressure in the Arctic and weak pressure in mid latitudes and about the equator. Some effects:
If a negative trend in the AO is sustained (it runs to a 60 year cycle from peak to peak, last peak in the 1940S and currently peaking again) , the stratosphere cools as a continual flow of nitrogen oxide from the mesosphere finds its way down through the funnel called the polar night jet or the ‘stratospheric vortex’ (as distinct from the polar front vortex at the surface) eroding stratospheric ozone. The Arctic has been on a trend for increasing atmospheric pressure in winter since the early 1990s.
If the AO goes positive for a week or two and the flow of nitrogen oxides from the mesosphere is curtailed, there is a build up in ozone in the interaction zone above 10hPa and the subsequent increase in pressure (fall in the AO) inevitably and very regularly causes rather spectacular ‘sudden stratospheric warmings’ of the sort experienced last February. When this ozone finds its way into the mid latitude troposphere (as it always does regardless of whether the warming is spectacular or not) cloud cover will disappear and the ocean will warm strongly all the way to the equator.
When the AO is persistently low (high polar pressure) the westerlies are weakened and the polar easterlies strengthened . The entire northern hemisphere will cool in winter, reversing the winter warming that has occurred since 1978. Places like the Napa Valley will be frosty like they were in the 1970’s. The stratosphere will cool because the flow of nitrogen oxides from the mesosphere will be continually strong. The troposphere will cool and cloud cover will increase.
And what causes this flux in polar pressure? Here is the kicker: The Dst index measures the strength of the electric currents in the atmosphere that are generated by the solar wind. The Dst index goes negative when the solar wind is active. The poles (both of them together) lose atmospheric mass as air is attracted towards the equator where the ‘ring current’ is to be found in the ionosphere.
A curious thing can be observed, namely this. When the sun is quiet the atmosphere is very compact. Neutrals and charged particles are more densely packed, more closely associated. In this circumstance a very small advance in the solar wind can cause a spectacular shift in atmospheric mass from the pole. This is the story that has unfolded each winter except that of February 2008 (the big La Nina year) since about 2007.
And one more thing: The poles are most susceptible to the solar wind in winter when surface atmospheric pressure is highest.
So, our mates the warmers are predicting an increase in climatic extremes in the future. Their prediction is right but their reasoning is wrong. Heaven help us!
If Canada gets frozen up solid in winter, we will see even more of these funny looking elk wondering around in our pastures here in NE Oregon.
http://www.wallowacountychieftain.com/main.asp?Search=1&ArticleID=22795&SectionID=5&SubSectionID=5&S=1
They have not lost temperatures but their “temper” 🙂
They Lied
Just read those reports singl-ing
And commingling too
All kinds of nasty weather
Warmist claims altogether untrue.
Outside the snow is falling
And warmists call it a coup
Come on, it’s only weather
But you know they’ll blame it on you.
All their yap, all their flap is just crap we know
Just look at the snow
We’re watching the polar ice caps grow.
All their yap, all their flap is just crap it’s planned
So they can demand
Our societies move ahead
much like Custer at his last stand.
Reports reviewed by cronies
And phony as phony can be
Warmists collude together to
Model bad weather you see.
Like a Tyrannosaurus
We’ll tell George Soros he’s through
We know it’s only weather
There’s no need to build an igloo.
The theory of AGW is in disarray
Once it’s shown that they were liars there’ll be hell to pay
We’ll be righting their wrongs til finally they’re forced to close up shop
At the the end of the day we’ll watch their theory flop.
Flop! Flop Flop!
There’ll be many consequences from the hue and cry
When alarmist cranks are forced to eat their humble pie
It’ll really be great to see them all shamed in the public eye
From the skeptic blogs springs these things
Now we want our damn Nobel Prize!
Courtesy of Don B
“Comparing the changes in English temperatures (which the researchers say are representative of European temperatures as a whole) with fluctuations in solar activity, the researchers found a strong correlation. Indeed, they say, winter temperatures are on average about a half degree centigrade lower when solar activity is low. Further analysis of the data allowed the team to conclude that the probability of the connection being a statistical fluke was less than 5%. ”
Courtesy of Pamela Gary,
“On This Day, December 16, In 1917, An Ice Jam Closed The Ohio River Between Warsaw, Kentucky And Rising Sun, Indiana. The Thirty Foot High Ice Jam Held For 58 Days, And Backed Up The River A Distance Of 100 Miles.”
That was a 100 year solar minimum.
In 1812 Napoleon had to back out of Russia and leave his grand army behind. That was a 200 year solar minimum
Weak sun, persistently high polar pressure, decline in ozone, colder stratosphere, middle and upper troposphere, more cloud cover, cool ocean, especially in winter. Weak Westerlies, heavy duty polar Easterlies.
In the southern hemisphere the flux in polar atmospheric pressure runs to a 100 year cycle which is currently hitting bottom. Weak vortex, warm stratosphere and upper troposphere disappearing cloud cover and warming seas. But this regime is already changing. Just watch the ozone hole grow as polar pressure begins to increase. In the south west of Western Australia we are already on a cooling trend over the last 10 years.
Erl Happ said:
“If a negative trend in the AO is sustained (it runs to a 60 year cycle from peak to peak, last peak in the 1940S and currently peaking again) , the stratosphere cools as a continual flow of nitrogen oxide from the mesosphere finds its way down through the funnel called the polar night jet or the ‘stratospheric vortex’ (as distinct from the polar front vortex at the surface) eroding stratospheric ozone.”
But Erl the, stratosphere cooled when the sun was more active and has stopped cooling while the sun is less active and may even be warming.
At the moment I can’t go with your view because I think one needs a warmer stratosphere to strengthen the polar high pressure systems and expand the polar air masses at the surface for a negative AO.
Also Joanna Haigh reports that from 2004 to 2007 whilst the sun was less active ozone declined below 45km but increased above 45km.
I think that when the sun is less active the reduction in ozone depletion above 45km allows ozone up there to increase whilst at the same time the creation of ozone below 45km declines. Yet despite the ozone reduction below 45km the stratosphere still warms which puts the upper level ozone destruction processes in net overall control.
An active sun increases ozone destruction above 45km whilst at the same time creation of ozone below 45km increases.
The level of 45km would therefore constitute the height at which the upper level ozone destruction processes take over from the lower level ozone creation processes.
Only that way can we get the stratospheric temperature trends right for the observed changes in pressure distribution in the troposphere.