Note: I want to thank everyone who commented here and elsewhere regarding my last post about GISS that sent everyone into a tizzy. All that is very helpful. Here’s more on GISS and the AO. -Anthony

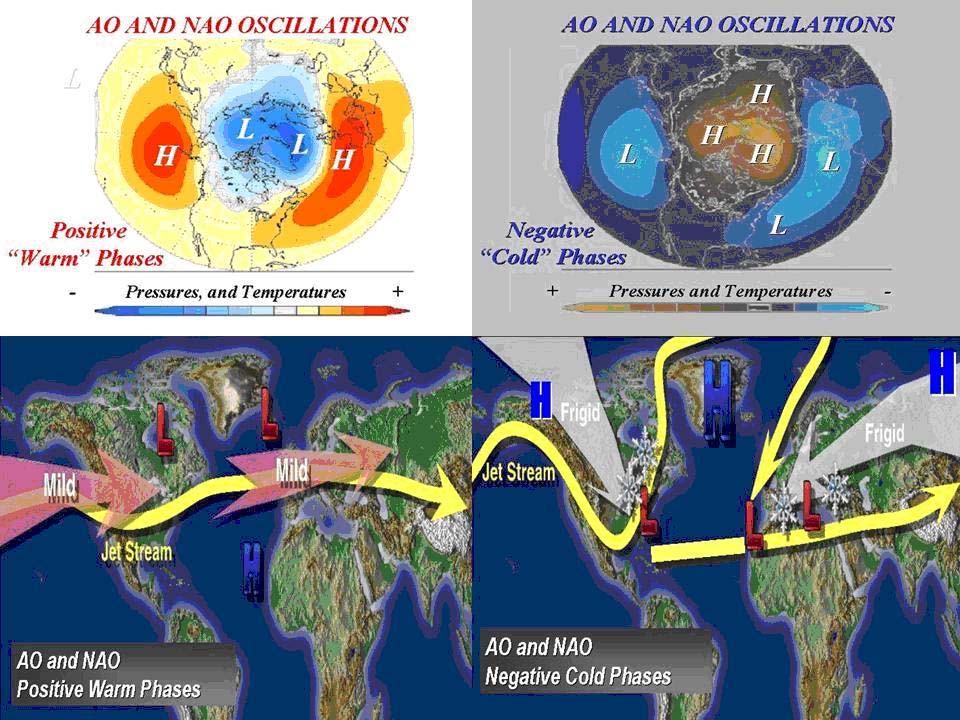
Effects of the Positive Phase | Effects of the Negative Phase
of the Arctic Oscillation of the Arctic Oscillation
(Figures courtesy of J. Wallace, University of Washington)
By Joseph D’Aleo, CCM
In a recent post to counter the snow and cold in the news that was spoiling the announcement by Dr. Hansen that it was the warmest year on record, NASA GISS authors note for November:
“Northern Europe had negative anomalies of more than 4C, while the Hudson Bay region of Canada had monthly mean anomalies greater than +10C. The extreme warmth in Northeast Canada is undoubtedly related to the fact that Hudson Bay was practically ice free. It is for this reason that some of the largest positive temperature anomalies on the planet occur in the Arctic Ocean as sea ice area has decreased in recent years.
The cold anomaly in Northern Europe in November has continued and strengthened in the first half of December. Combined with the unusual cold winter of 2009-2010 in Northern Hemisphere mid-latitudes, this regional cold spell has caused widespread commentary that global warming has ended. That is hardly the case.”
Bob Tisdale has relevant posts on Watts Up With That that here shows how NASA GISS removed Arctic and Southern Ocean sea surface temperature data and then used 1200km smoothing that uses land stations to refill in the data (resulting in a warming) and here how leftover warm water from a strong El Nino gets spun up into the Kuroshio-Oyashio Extension (KOE) where it continues to release heat to help explain why the ‘global warmth’ has persisted into the early stages of the current La Nina.
See in this Steve Goddard post here how Hansen blamed the cooling in recent years on La Nina but now has decided this El Nino warming is global greenhouse warming.
Even Kevin Trenberth, head of climate analysis at the National Center for Atmospheric Research in Colorado, admitted here: “We have seen rapid warming recently, but it is an example of natural variation that is associated with changes in the Pacific rather than climate change.”
We have shown how NASA and the other data centers have mined the data for warmth and manipulated the data – new and old – to enhance the apparent warming. This includes a cooling (up to a quarter degree or more celsius) of the pesky warm period from the 1920s to 1950s right up to 1980. This includes the NASA GISS base period for anomalies of 1951 to 1980. Numerous data issues post 1980 have exaggerated the warmth.

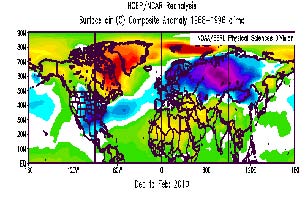
The warming NASA remarked about this fall in northeast Canada and Hudson Bay is part of the very strong negative arctic oscillation pattern we have seen the last few years, in part related to the long solar minimum and high latitude volcanoes.

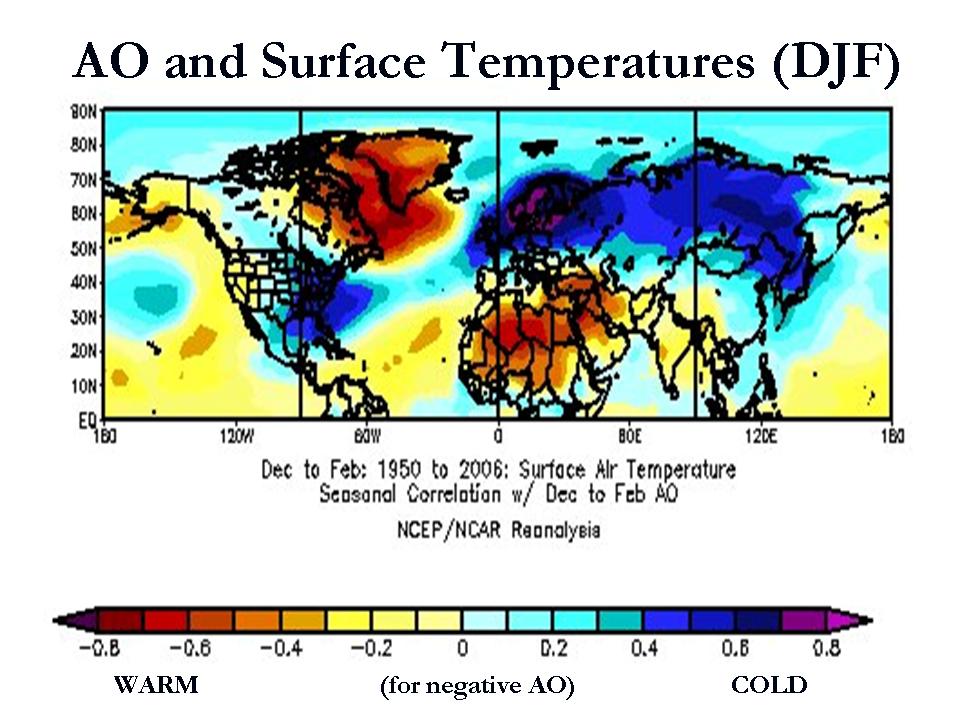
The positive AO state is characterized by an anomalously strong polar vortex that traps cold air in high latitude and more zonal mid-latitude jet stream that allows maritime Pacific air to invade North America and Atlantic air to flood Europe often as far east as the Urals. In the negative mode, high pressure dominates the polar region and North Atlantic, shunting arctic air south in North America and Siberian air west to Western Europe.
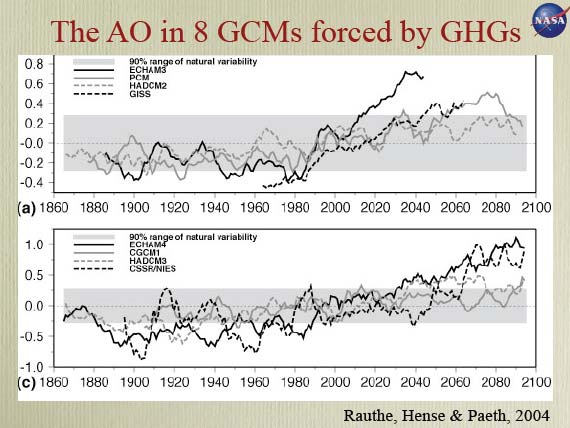
The greenhouse models all predict an increase in the frequency and strength of the positive arctic oscillation in time, most (2/3rds) exceeding the 90% range of natural variability.

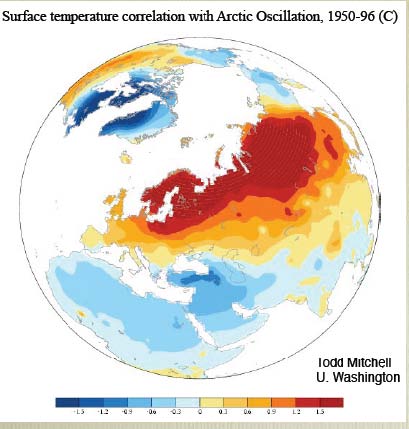
A positive AO would lead to increasing temperatures in the Northern Hemisphere continents with colder than normal air trapped in the arctic down to the northern parts of Canada and Hudson Bay. The following from Mitchell shows the warmth over Eurasia.

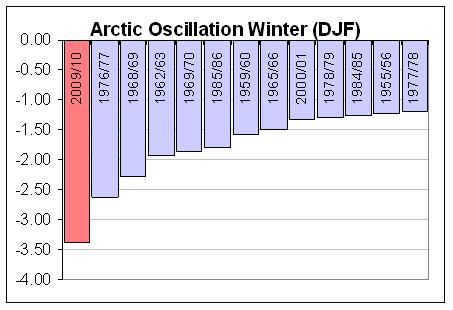
Last winter saw the most negative AO of the record back to 1950.

The global anomalies with a negative winter AO are as follows:

See how well that verified this past winter. No GHG need apply.

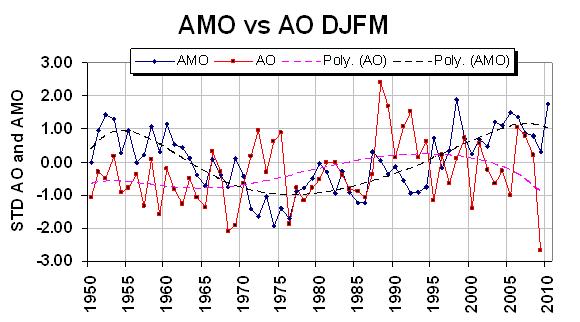
As noted, the North Atlantic Oscillation, an important component of the overall arctic oscillation varies with the ocean temperature tripole in the Atlantic, known as the AMO or Atlantic Multidecadal Oscillation. When the Atlantic is in the warm positive AMO mode as is currently the case, the NAO and AO tend to be more negative.

When the AMO is positive with warm water in the North Atlantic and in the Tropical Atlantic, the NAO was mainly negative (1960s). When the North and Tropical Atlantic turned cold in the 1980s, the NAO was mainly positive (data in chart above through 1999). Note the AMO flipped positive (warm) in 1995 with a big dip in the NAO. See the inverse relationship with the AO in the graph below. Data for both is averaged for the December through March periods and standardized.

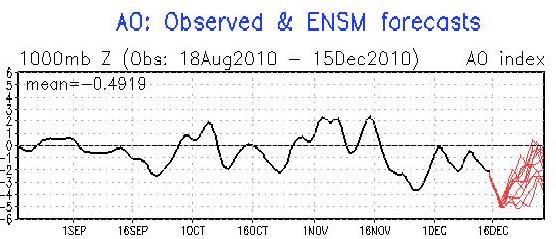
So far this late fall, the AO has been mainly negative and forecast by the model ensembles overnight to reach 5 standard deviations negative the next few days.

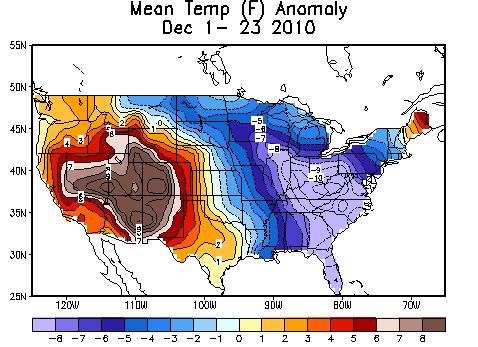
This explains not only the brutal cold in Europe and Asia but also the amazing 11F negative anomalies in the southeastern United States.

PDF of this report here.
erlhapp says:
“from mars says:
“The greenhouse models all predict an increase in the frequency and strength of the positive arctic oscillation in time, most (2/3rds) exceeding the 90% range of natural variability.””
I do NOT said that, IT WAS WRITTEN IN THIS POST BY By Joseph D’Aleo, CCM.
I was quoting him to show that the graph that he shows below that statement clearly indicate that that was a prediction for the 2030s/2040s,not for the present time (2000s) so the statement, that compares present day AO with the AO predicted for 30 years in the future, is misleading.
Did you notice the “” or have read this post?
Do that before comment, please.
from mars says:
December 16, 2010 at 1:59 pm
Interesting review of the Arctic/North Atlantic Oscillation (AO/NAO). And the relationships with the Atlantic Multidecadal Oscillation (AMO).
But, why the need to attack NASA GISS?
Saying “AO spoiling NASA GISS party” is just silly.
================================
No. Its just true.
NASA GIZZ has discredited itself long ago.
James Hansen is the worst aberration of a scientist in modern times (especially in light of the fact that he is a “public servant” funded by the taxpayer).
Unfortunately his poison affects the entire organization.
Chris
Norfolk, VA, USA
From Mars,
I took it that when you said :
‘What is evident in the figure is that the sentence quoted is true only from the 2030s-2040s.’
Was an endorsement of that statement.
Joe’s opinion of the models (and Hansen is a great promoter of them) is encapsulated in the words:
‘No GHG need apply.’.
from mars says:
“Ah, in trend the outlier is UAH, not GISTEMP…”
Looks to me like GISS is the black line, and RSS is the dark blue line. Which would be confirmed by your second graph and speaking of cherry-picking, that’s what you’re doing with WFT. That’s why I don’t use it – it’s a cherry-picker’s dream. [And if you think the chart I posted was my own, it’s not. I was using it to make the point that Hansen is being disingenuous].
Here is another chart showing satellite records vs massaged GISS & NOAA manipulations. The “adjustments” done to the raw data always result in either higher temperatures, or a steeper rising trend line, or both.
It’s obvious that the temperature record is manipulated to make it look scarier.
Mike D
I’m no expert, but my reading of glacial advance begins with wet summers and cooler winters. Not too sure about ‘tipping points’, even large volcanic eruptions in a colder periodicity have only temporary impact.
erlhapp says:
December 16, 2010 at 6:43 am
A curious thing can be observed, namely this. When the sun is quiet the atmosphere is very compact. Neutrals and charged particles are more densely packed, more closely associated. In this circumstance a very small advance in the solar wind can cause a spectacular shift in atmospheric mass from the pole. This is the story that has unfolded each winter except that of February 2008 (the big La Nina year) since about 2007.
This is were the answer lies I think, something that is sure is height of the atmosphere is at record modern lows. Solar EUV varies by at least 16% over the cycle and it doesn’t have a base floor like other indexes. The current minimum is substantially lower than the previous minimum which has lead us to a more compact atmosphere which is unlikely to grow much looking at the last 12 months of EUV output. Perhaps the solar wind is more of a player in these conditions or maybe its something else that drives the higher pressures in the Arctic. Interestingly the opposite has been happening at the other end of the world which shoots a bullet in the theory, but this has had the effect of strengthening the La Nina pattern as has been shown in the past. Also of interest is Antarctica is experiencing the most positive AAO on record but here in Oz we have had persistent blocking highs that have added to the massive rainfall.
Stephen keeps referring to the ozone readings during a quiet Sun (2004-2007), but looking at the record the Sun was not quiet in that period, nothing like it is now. If the NAO keeps positive all winter we need to get this message out there, the models are so far off on this one. The long term NAO is looking very interesting right now.
I understand the 100 year pattern, there are 2 distinctive forces in play that occur around every 200 years that overlap to make it appear as a 100 year cycle. One is grand minima, the other is just low cycles at the bottom of the wave. Both have climate implications but if the stars are aligned correctly the grand minima force is much stronger and prolonged.
This story fits the pattern:
“Torrential rain prompts Gaspe state of emergency”
http://www.ctv.ca/CTVNews/TopStories/20101216/rain-gaspe-101216/
Recall the recent massive snows further west (in the blue) and look at where Gaspe is (near the limit of red) on the map:
http://wattsupwiththat.files.wordpress.com/2010/12/ao71.jpg
–
Erl Happ: Interesting notes. I’ve recently turned more attention towards solar wind records and I can confirm that there are unambiguously shared nonlinear patterns over the entire record. Anyone sticking to linear methods might draw hilariously obtuse conclusions. Piers Corbyn is surely LHAO. I am also developing the opinion that ENSO is constrained from the poles – and particularly by the distribution of continents (notably the north). I hope that sometime you might have time to get everything that you think is important summarized into as concise a summary as is possible. If so, many who are already appreciative will be even more so. Best Regards.
Geoff Sharp said:
“Stephen keeps referring to the ozone readings during a quiet Sun (2004-2007), but looking at the record the Sun was not quiet in that period, nothing like it is now.”
Agreed but I’m comparing 2004/7 to the period covering the cycles 18 to the peak of 23. The period since 2007 will be interesting either way.
Compared to the oscillating energy available in our own oceans, and atmosphere (in a way, another vast “ocean”) to affect change in temperature, changes in anything the Sun has wrought just does not have that same potential. And neither do human sourced CO2 changes. Anybody willing to suggest a driver outside of these two systems, oceans and atmosphere, must first rule out these very powerful influences. No one has done that yet to my satisfaction. Show me a mechanism and put it to maths. And please, do not send me to an article to read. If you don’t know the calculations related to the Sun’s influence or that of human sourced CO2, then find a source that does and cut and paste their calculation here.
This Arctic blast is clear and present evidence (with clear and present maths to quantify it) of the power involved in both oceans and atmosphere to affect the temperature we experience. So put up or…
Geoff Sharp says:
December 16, 2010 at 6:56 pm
============================
Well said, Geoff.
Stephen Wilde says:
December 16, 2010 at 7:39 pm
Agreed but I’m comparing 2004/7 to the period covering the cycles 18 to the peak of 23. The period since 2007 will be interesting either way.
EUV was high during this period, to be of use the period between 2008 and now will tell the story.
Check out the jet stream action over the south pole, lots of incursions brought about by the high/low pressure differences, lots of rain in Melbourne and Sydney looks to be copping it. Trouble is the AAO has been in high positive mode (in general). Perhaps the positive/negative phase is not the full story?
Ocean SST’s have lots of warm/cold pools, could this be the determining factor?
Geoff Sharp and Paul Vaughan and Pamela Gray,
If you look at daily data over the last two years some 49 movements of the Dst index produced a rise in both the AO and the AAO index. Some 24 movements to the negative involved a rise in the AO index alone and 22 movements to the negative resulted in a rise in the AAO index alone. A few movements saw no rise at all. Very few.
When atmospheric mass moves from the south pole, and the process has been going on since 1948, it finds its way mostly to the mid latitudes of both hemsipheres producing an increase in the differential driving both the trades and the westerlies but it is the westerlies that are most energized. As the polar index rises there is an increase in sea surface temperature in the mid latitudes. The signal in the northern hemisphere is very plain. In the southern hemisphere there can be short term cooling (I suggest cold water upwelling and effects of a speed up in the ocean circulation) but in the long term an index of differential pressure driving the westerlies is locked to the temperature of the southern ocean. Draw your own conclusion.
I have a full description of all this but it’s not concise as Paul Vaughan would like. But I am happy to provide it to those interested and look forward to feedback. My email is easy to find.
It’s a somewhat complicated story because the hemispheres of the earth are so different. A very important part involves the role of the polar stratospheric vortex in determining the flux of ozone into the winter hemisphere. Fortunately there is excellent material made available by the NOAA (a great resource) that enables one to put together a chain of causation to link from Dst (Disturbed time Index) through to SST (sea surface temperature). And Pamela for one will be surprised.
One can see a period of time when air pressure was strong over Antarctica when sea surface temperature was driven by the AAO. Currently, its being driven by the AO because air pressure over the Arctic in winter is at a 60 year high.
Low AAO in winter (high surface pressure) was behind the La Nina of 2007 -2008.
It goes this way. Low pressure at pole increases westerlies. The stratospheric vortex (night jet if you like) is very weak. There is little mesosphere/stratosphere interaction. Upper stratosphere above 10hpa loaded with ozone. Every weekly or so the solar wind falls away. Dst relaxes. AO and AAO fall slightly from whatever level they happen to be at. Vortex invigorated, transport of high ozone air commences, increase in geopotential heights at 60-90° lat. Convectional circulation in the stratosphere commences as ozone absorbs OLR. High Ozone warmed air descends into the troposphere in locations that create a mirror image of geopotential heights to that in the stratosphere. That is where the ocean warms.
Reversing the cycle: High pressure at the pole weakens the westerlies and the sea cools as cloud cover increases. Cloud cover increases as the ozone content of the atmosphere is reduced by a burgeoning vortex bringing nitrogen oxides down from the mesosphere. If there is less ozone, there is less absorption of outgoing radiation from the Earth so the stratosphere and the upper troposphere is cool. Cool air,relatively invariable specific humidity, sub freezing temperatures, more ice cloud, more reflection of solar energy, cooler ocean. And its the mid latitudes rather than the tropics where most of the action is.
Truly abundantly and hopelessly heretical stuff. Open system. Hourly and daily fluctuation. Trends over centuries. A very direct link between the solar wind and change in SST at the surface. Mediated via the influence of the most potent greenhouse gas of them all, ozone. That is the poetic element.
So, that is the short version Paul. No diagrams, no pictures, just words.
Geoff Sharp:
Re: “Interestingly the opposite has been happening at the other end of the world which shoots a bullet in the theory, but this has had the effect of strengthening the La Nina pattern as has been shown in the past. Also of interest is Antarctica is experiencing the most positive AAO on record.”
Considering what you have said I don’t think it is helpful to look at the SST in the tropics and the be all and end all of what is about to happen to global temperature. There can be contrary trends in the hemsipheres. The mid latitudes are where cloud cover dynamics play out. The Southern hemisphere has more ocean. Low AAO drives the westerlies and SST increase in winter but the flux in ozone from the south pole and change in stratospheric temperatures is negligible in summer. Those spots of cold ocean in the southern ocean reflect a colder stratosphere and upper troposphere at the moment. All the action is now in the Arctic.
The AO has been mostly negative since September but the degree of fluctuation is now increasing. You can see the movement in atmospheric temperature here: http://www.cpc.noaa.gov/products/stratosphere/temperature/
If we have a sudden stratospheric warming in the Arctic like last February you will see a marked increase in SST in the Pacific off Japan or wherever 200hpa and 500hpa geopotential heights are anomalously high….in both hemsipheres. The sea will warm first in mid latitudes and their will probably be a simultaneous cooling of the sea in the tropics.
It’s no good trying to simplify the thing any more than the real situation allows.
Erl, thanks for the notes. One thing I’m not clear on is why you think it is necessary to look beyond SW to Dst. This appears to put your view (electric apparently) at variance with that of Piers Corbyn (but perhaps I have misunderstood). (I also note that you make no mention of lunisolar tides.)
Pamela Gray says:
December 16, 2010 at 6:22 am
…………
Conditions in the North Pacific currently are surprisingly similar to those 1910’s and 1950’s.
http://www.vukcevic.talktalk.net/NPG.htm
Can we draw any conclusions from it ?
Solar activity may be in 1910’s (low) but not in 1950’s (highest ever).
AMO? PDO? Yes both on the way down, but they do not drive the climate, they are the climate.
AMO, PDO, SOI, etc are indices (temperature and pressure differentials) do not determine the real temperature and atmospheric pressure, they are result of those temperature and pressure movements.
Enneagram says:
December 16, 2010 at 6:15 am
Compare details on top map (Hudson Bay – Lake Baikal) here
http://data.giss.nasa.gov/gistemp/2010november/fig1.gif
and the maps here
http://www.vukcevic.talktalk.net/NFC1.htm
I am sure you got the idea, but you knew that anyway, there are
far too many waiting to know what is already known.
Paul
Re: DST
Paul here is my post in reply to R. Gates on another thread:
Solar has an effect, but I think not the way most of scientist consider, but in the odd strong pulses of magnetic field known as magnetic storms (re: DST index), or as NASA would have it ‘magnetic ropes. They pump strong currents inducing magnetic field in the highly conducting magma (lithosphere in the Arctic is less 25-30km thick), while induction can go as deep as 100km or more. These counter act the Earth’s field itself causing shift of the GMF strength from the Hudson Bay area towards Siberia where lithosphere is much thicker. This can be clearly seen by the change in the Hudson bay’s area magnetic field’s and its negative correlation to the SSN.
http://www.vukcevic.talktalk.net/LFC9.htm
Correlation weakens to totally disappear further away. Antarctica doesn’t have any of the properties above.
Stratosphere is highly ionised, the bifurcation of the Arctic’s GMF causes the spreading polar vortex to split in two halves, having profound effect on the Arctic climate / temperatures.
http://www.vukcevic.talktalk.net/NFC1.htm
see also top map:
http://data.giss.nasa.gov/gistemp/2010november/fig1.gif
(clarification: The Dst is a geomagnetic index which monitors the world wide magnetic storm level. )
Paul
“Erl, thanks for the notes. One thing I’m not clear on is why you think it is necessary to look beyond SW to Dst. ”
Paul,
I don’t know what your reference to SW represents? Short Wave Radiation?
So vukcevic, let me see if I understand your view:
You envision GMF influencing tropospheric dynamics [as opposed to (a) solar wind influencing GMF & tropospheric dynamics via separate pathways or (b) solar wind influencing GMF via tropospheric dynamics]?
Erl Happ asked, “I don’t know what your reference to SW represents? Short Wave Radiation?”
Apologies. Solar wind.
savethesharks says: December 15, 2010 at 9:27 pm
Check out the latest scientific discussion from the Raleigh NWS:
“The very cold Arctic air mass in place over our region is a rare
occurrence this early in the winter season. The winter weather event
expected later tonight and Thursday will also be a rare event. It is
rare to have average temperatures running 10.1 degrees below normal
for an extended period of time – even for the first two weeks of
December at Raleigh-Durham and Greensboro. This makes these first
two weeks of December the coldest ever at both sites.”
Wow. Coldest ever. Of course….that is only 120 or so years. So no big deal, right R Gates? If it is no big deal on being the coldest “ever” then it is no big deal your stupid alarmist crap about the quote unquote long-term trends in the Arctic.
Wow! Pre-emptive strike. Nice touch. Too bad it didn’t succeed. :<(
Paul Vaughan says:
December 17, 2010 at 6:59 am
….
I will be updating soon http://www.vukcevic.talktalk.net/NFC1.htm, will drop you a note.
Paul Vaughan,
Paul
“Erl, thanks for the notes. One thing I’m not clear on is why you think it is necessary to look beyond SW to Dst. ”
Abbreviation is the source of our problem.
Dst is the Disturbed time index, a direct measure of the effect of the solar wind on the electric fields within the atmosphere. The enhanced flow of electrons in the ‘Ring Current’ is a singular example of changes in that electric field. Gravity and the electric field together with the distribution of kinetic energy (mainly due to absorption of long wave from the Earth by ozone and the release of latent heat of evaporation) determine the distribution of the atmosphere around the globe. The element that changes most on short and long time scales is the electric field. However, latent heat release in the tropics varies much more than surface temperature.
Our mental construct of stratosphere and troposphere, the former with all the ozone does not serve us well. There is mixing across the ‘boundary’ (the tropopause) which exists most tangibly in our minds and rather less tangibly in the atmosphere. This accounts for change in cloud cover. In the stratosphere, the incursion of water vapor from the troposphere is a denaturing factor of equal significance.
It can be observed that atmospheric mass moves from the winter pole towards the equator under the influence of this electric field when it is enhanced by the solar wind.
One immediate effect is a cooling of the upper stratosphere over the equator.
Once energized the ring current has a slow relaxation characteristic over a couple of months. There is a slow change in the base state across solar cycles particularly observable at solar minimum and in the evolution of atmospheric pressure at the poles where 30 bar of pressure can be lost and only a bar or two gained at the equator over a sixty year period.
The climate effect is related to change in the flow of air in the systems we know as the Trades, the Westerlies and the polar Easterlies and the most spectacular changes are seen in the latter two, especially in the northern hemisphere. As the westerly flow increases the ocean warms, the two tightly locked together on short and long time scales. The inference is that cloud cover has been lost. The observation that supports that is the flow of ozone into the troposphere in the mid latitudes. That comes from the polar upper stratosphere whenever surface atmosphere increases slightly. On a daily scale this can be observed as a fall in the Arctic Oscillation Index or the Antarctic Oscillation Index. There is an immediate response in terms of increased geopotential heights between 60-90° of latitude. In large scale events this starts at 1hPa within this latitude band. On smaller scale events the ozone is entrained into the polar stratosphere from outside that latitude band appearing at or about 100hPa.
Monitor this at:
http://www.cpc.noaa.gov/products/stratosphere/strat_a_f/
http://www.cpc.noaa.gov/products/intraseasonal/temp10anim.shtml
http://www.cpc.noaa.gov/products/stratosphere/temperature/
http://www.cpc.ncep.noaa.gov/products/intraseasonal/temp30anim.shtml
http://www.cpc.ncep.noaa.gov/products/intraseasonal/z200anim.shtml
http://www.cpc.ncep.noaa.gov/products/precip/CWlink/daily_ao_index/hgt.shtml
http://www.cpc.ncep.noaa.gov/products/intraseasonal/z500_nh_anim.shtml
Thanks Erl, I read your comments with interest. Your description of the weekly short term oscillations will be something I follow up on, but of more interest to me is why we have high pressure at the north pole right now as apposed to record low pressure at the south pole which has been that way over the entire southern winter.
This graph shows that a positive AAO (low pressure at the south pole) correlates with a high SOI or La Nina pattern so I must be missing something or confused. Your statement “Low AAO in winter (high surface pressure) was behind the La Nina of 2007 -2008.” seems to be at odds?
Geoff, I note that your graph (thanks for sharing that) is for ONDJ. When I get a chance I’ll take a look at how the relationship varies seasonally. (Related: In NAO / SOI relations, March tells an interesting story about the 1976 climate shift.)
—
A solar-terrestrial relations note:
I have confirmed the findings of the following paper using different methods:
Le Mouël, J.-L.; Blanter, E.; Shnirman, M.; & Courtillot, V. (2010). Solar forcing of the semi-annual variation of length-of-day. Geophysical Research Letters 37, L15307. doi:10.1029/2010GL043185.
The article first got a mention at WUWT Aug. 28, 2010:
http://wattsupwiththat.com/2010/08/28/weekly-climate-news-roundup/
On Oct. 3, 2010, a full WUWT article was devoted to the findings:
“Length of day correlated to cosmic rays and sunspots”
http://wattsupwiththat.com/2010/10/03/length-of-day-correlated-to-cosmic-rays-and-sunspots/
At the time I was too busy with financial pursuits to do an audit, but yesterday I found the time.
LOD also contains crystal clear information about lunisolar tides (no ambiguity whatsoever). This time series is a terrestrial climate gold mine (so we should be vigilantly watchful for any potentially arising efforts to vandalize this key record, such as we see with 1940s SST records).
—
Erl, thanks for the stimulating notes. The bit about electricity pulling the atmosphere towards the equator (if I haven’t misunderstood) will surely be mercilessly attacked by physicists. I’ll stick to exploring data, leaving physics to physicists. One thing I can tell the physicists with absolute confidence: The data have not been thoroughly explored by the climate science mainstream (so it’s no wonder that mainstream paradigms have run so seriously afoul). I sincerely hope that sensible researchers from all fields in these multidisciplinary investigations will pause to realize that climate science leaders fell victim to Simpson’s Paradox decades ago. The earth orientation experts will likely play a key role in the clean up of the climate science mess. I would like to caution all climate ‘hobbyists’ that it is necessary to condition analyses on the season of the year; the notion that anomalies have some ideal properties that obviate the need to look at seasons is purely nonsensical. Best Regards.