Note: I want to thank everyone who commented here and elsewhere regarding my last post about GISS that sent everyone into a tizzy. All that is very helpful. Here’s more on GISS and the AO. -Anthony

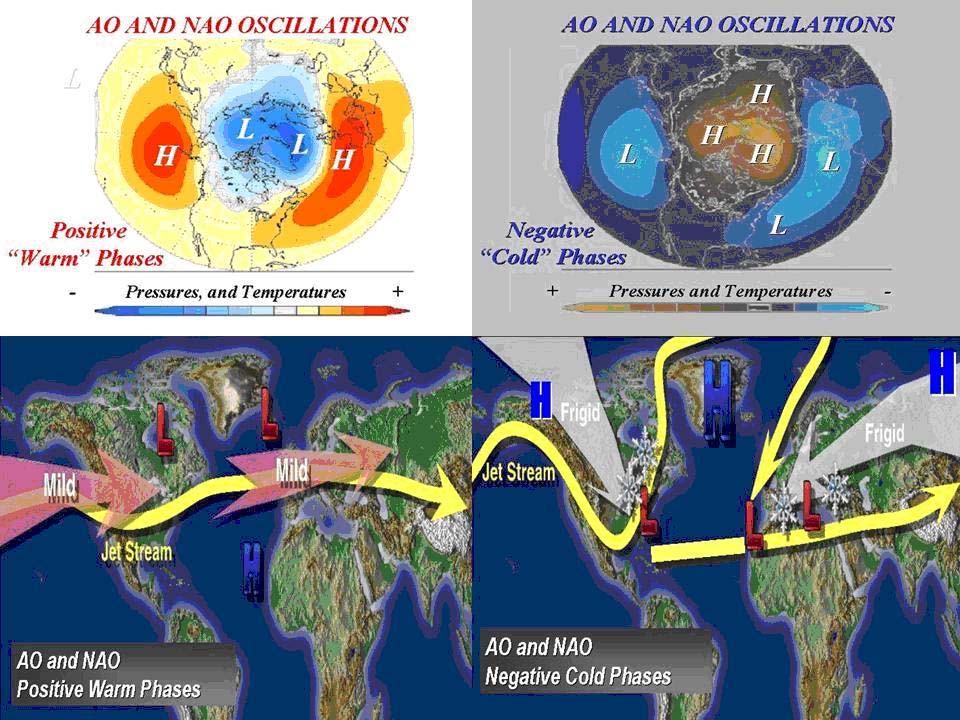
Effects of the Positive Phase | Effects of the Negative Phase
of the Arctic Oscillation of the Arctic Oscillation
(Figures courtesy of J. Wallace, University of Washington)
By Joseph D’Aleo, CCM
In a recent post to counter the snow and cold in the news that was spoiling the announcement by Dr. Hansen that it was the warmest year on record, NASA GISS authors note for November:
“Northern Europe had negative anomalies of more than 4C, while the Hudson Bay region of Canada had monthly mean anomalies greater than +10C. The extreme warmth in Northeast Canada is undoubtedly related to the fact that Hudson Bay was practically ice free. It is for this reason that some of the largest positive temperature anomalies on the planet occur in the Arctic Ocean as sea ice area has decreased in recent years.
The cold anomaly in Northern Europe in November has continued and strengthened in the first half of December. Combined with the unusual cold winter of 2009-2010 in Northern Hemisphere mid-latitudes, this regional cold spell has caused widespread commentary that global warming has ended. That is hardly the case.”
Bob Tisdale has relevant posts on Watts Up With That that here shows how NASA GISS removed Arctic and Southern Ocean sea surface temperature data and then used 1200km smoothing that uses land stations to refill in the data (resulting in a warming) and here how leftover warm water from a strong El Nino gets spun up into the Kuroshio-Oyashio Extension (KOE) where it continues to release heat to help explain why the ‘global warmth’ has persisted into the early stages of the current La Nina.
See in this Steve Goddard post here how Hansen blamed the cooling in recent years on La Nina but now has decided this El Nino warming is global greenhouse warming.
Even Kevin Trenberth, head of climate analysis at the National Center for Atmospheric Research in Colorado, admitted here: “We have seen rapid warming recently, but it is an example of natural variation that is associated with changes in the Pacific rather than climate change.”
We have shown how NASA and the other data centers have mined the data for warmth and manipulated the data – new and old – to enhance the apparent warming. This includes a cooling (up to a quarter degree or more celsius) of the pesky warm period from the 1920s to 1950s right up to 1980. This includes the NASA GISS base period for anomalies of 1951 to 1980. Numerous data issues post 1980 have exaggerated the warmth.

The warming NASA remarked about this fall in northeast Canada and Hudson Bay is part of the very strong negative arctic oscillation pattern we have seen the last few years, in part related to the long solar minimum and high latitude volcanoes.

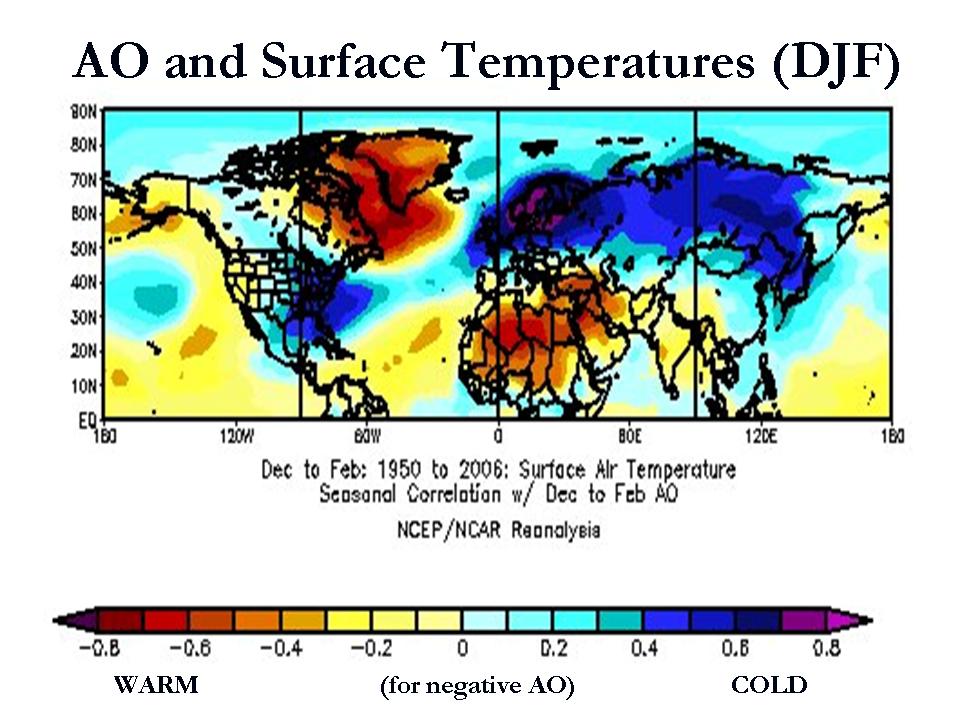
The positive AO state is characterized by an anomalously strong polar vortex that traps cold air in high latitude and more zonal mid-latitude jet stream that allows maritime Pacific air to invade North America and Atlantic air to flood Europe often as far east as the Urals. In the negative mode, high pressure dominates the polar region and North Atlantic, shunting arctic air south in North America and Siberian air west to Western Europe.
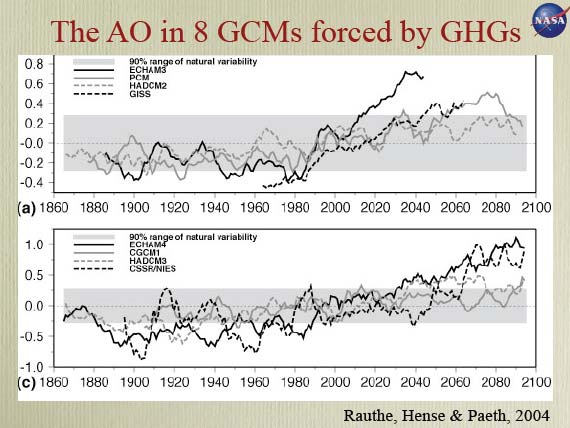
The greenhouse models all predict an increase in the frequency and strength of the positive arctic oscillation in time, most (2/3rds) exceeding the 90% range of natural variability.

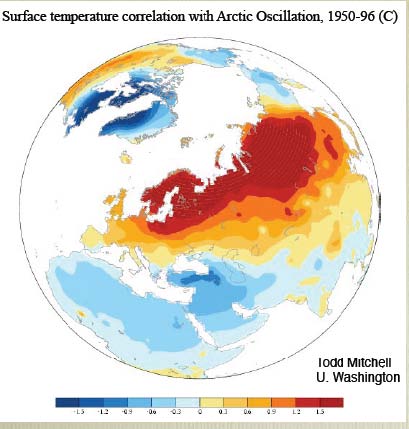
A positive AO would lead to increasing temperatures in the Northern Hemisphere continents with colder than normal air trapped in the arctic down to the northern parts of Canada and Hudson Bay. The following from Mitchell shows the warmth over Eurasia.

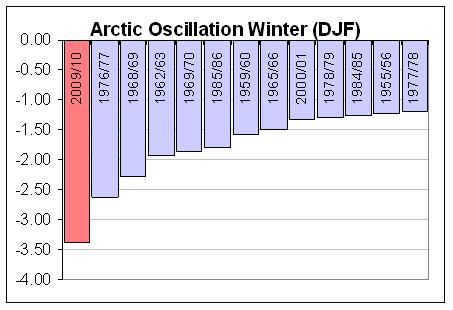
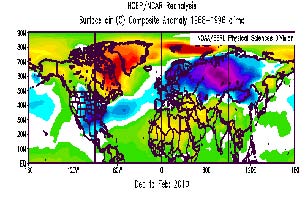
Last winter saw the most negative AO of the record back to 1950.

The global anomalies with a negative winter AO are as follows:

See how well that verified this past winter. No GHG need apply.

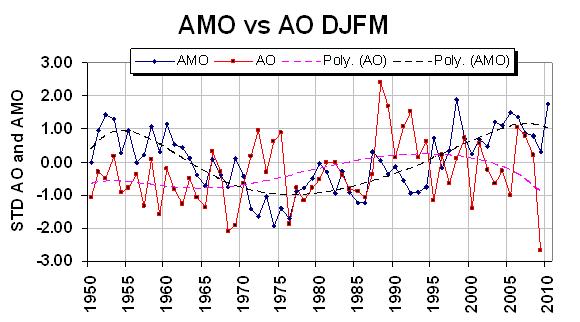
As noted, the North Atlantic Oscillation, an important component of the overall arctic oscillation varies with the ocean temperature tripole in the Atlantic, known as the AMO or Atlantic Multidecadal Oscillation. When the Atlantic is in the warm positive AMO mode as is currently the case, the NAO and AO tend to be more negative.

When the AMO is positive with warm water in the North Atlantic and in the Tropical Atlantic, the NAO was mainly negative (1960s). When the North and Tropical Atlantic turned cold in the 1980s, the NAO was mainly positive (data in chart above through 1999). Note the AMO flipped positive (warm) in 1995 with a big dip in the NAO. See the inverse relationship with the AO in the graph below. Data for both is averaged for the December through March periods and standardized.

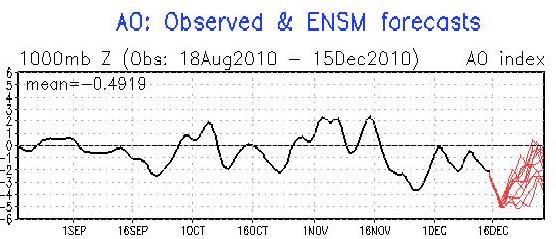
So far this late fall, the AO has been mainly negative and forecast by the model ensembles overnight to reach 5 standard deviations negative the next few days.

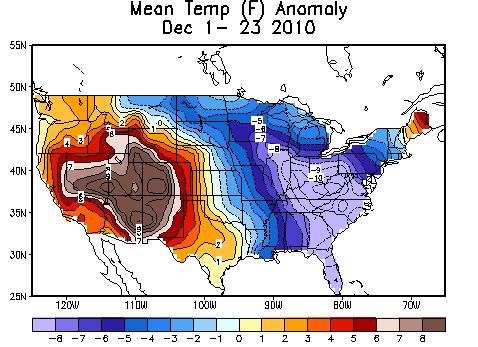
This explains not only the brutal cold in Europe and Asia but also the amazing 11F negative anomalies in the southeastern United States.

PDF of this report here.
Now approaching -5. Just how low will this lady get?
http://www.cpc.noaa.gov/products/precip/CWlink/daily_ao_index/ao_index_mrf.shtml
Hi Geoff,
Nothing like a searching question to focus the mind. The following represents a very careful reply.
The AAO is a direct proxy for the strength of the westerlies in the mid latitudes of the southern hemisphere as is the AO for the westerlies in that hemisphere. The strength of the westerlies I estimate as the difference in pressure between 30-40°S and 60-70°S in the southern hemisphere and 30-40N and 50-60N in the northern hemisphere. When the differential rises the sea between 30-50° lat warms. So, in general terms does the sea between the equator and 30° lat. but the relationship is looser. If we are suggesting that the AAO drives the lot we must recognize that SST at 0-30N and 30-50N has a pretty loose relationship with 30-50S. ENSO is in the middle of this lot.
The AAO was low mid 2007.
The westerlies strengthen as polar pressure falls. Cloud cover down. SST up.
A weaker sun is associated with lower AAO and AO, higher pressure at the poles.
Your measure of ENSO could be the SOI or ENSO 3.4 SST. None of these approximate SST between 20N and 20S.
The flux in the strength of the westerlies is several times the flux in the strength of the trades.
In general low pressure at either pole is associated with strong westerlies, cloud loss and warming seas in mid latitudes 30-50°S. This generally means a similar trend at 0-30S but not necessarily in the northern hemisphere. On a longer time scale low pressure is associated with a warmer stratosphere due to an inactive stratospheric vortex, less influence from the mesosphere and less middle and upper troposphere cloud.
Now, the question as to how we can have low pressure at the south pole and near record pressure at the north pole is something that is of great interest to me too. On the face of it the solar wind energizes the ring current over the equator and atmosphere is sucked away from both poles. Currently low geomagnetic activity should mean high pressure at both poles and this is in general the way it works on longer time scales. But, the pressure at the pole is weak in summer and strong in winter. It is much stronger in the south in winter than it is in the north in winter. The northern landmasses play a role in northern summer by heating up the atmosphere. Perhaps the currently very cold northern land masses due to several successive cold winters are allowing the Arctic to accumulate atmospheric mass in a way that we have not seen before. The trend for higher pressure in the Arctic in winter set in after a phenomenal collapse in the early nineties. Arctic pressure was high in the forties and it is high again sixty years later. It’s a different pattern to the south pole where pressure has fallen continuously.
Within the space of twelve months we see half a dozen peaks in both polar indices (but not this year). Normally there is a tug of war going on so that when one is high the other is low. But, on an annual (or somewhat longer) basis they tend to move together.
Low pressure at the southern pole is due to a progressive loss since 1948. Currently pressure is bottoming, in fact it has started to rise in one season (summer I think but can’t find the graph at this moment).
We should not forget that there are two poles and the north is where ozone is in highest concentration. Flux in the vortex in the north produces ozone pulses that drive change in SST at 30-50N that are higher in amplitude than at 0-30N, 0-30S and 30-50S. These pulses in ozone from the north are responsible for extending the very broad peaks in anomalous SST at 30-50S from the time the southern vortex is active in late winter through to February-March at the time when the northern vortex is most influential. It has recently been noticed that there is a relationship between ENSO and the AO which is documented by Butler et al “The Influence of the El Niño-Southern Oscillation on the Arctic Oscillation and Implications for Surface Climate Prediction”
It has been noticed that between January and March if the AO is high we tend to have La Nina, but the argument in the paper is that La Nina causes high AO. Could it be that the AAO is concurrently low and this is the cause of the La Nina? Silly thing is that the relationships all move over time with the solar wind and the pattern of warming that we have today is very different to that prior to 1978 or even prior to 1993 when the AO began to rise. Nothing in our climate system is stable. There are two poles, two vortexes.
So far as mid latitudes are concerned high AO represents lower polar pressure enhanced westerlies and warming seas in the mid latitudes of the northern hemisphere but also in the mid latitudes of the southern hemisphere because the differences are large and the mixing is speedy. The mid latitudes respond more than low latitudes because there is more cloud and more flux in ozone. If we look at anomalous SST this year a warming started at 30-50N in January and continues while cooling at 30-50S also began in January and continues. At 0-30S cooling began about June and continues with temperatures 0.1°C below the 1948-2010 average. However at 30-50°N cooling began about June, it has been slight and temperature is currently stalled at 0.4 °C above the 1948-2010 average.
“ENSO”, the SOI and ENSO 3.4, a tiny stretch of ocean in the mid Pacific is something that we ought to forget about. It’s simplifying the matter to the point where study is likely to be unproductive. Fact is that the ocean warms in any place where cloud cover diminishes and cloud cover is most variable in the middle and upper troposphere as determined by the flux of ozone out of whichever pole is currently active. There are no golden rules. Just a mix of disparate trends that never repeat themselves.
So, I will withdraw that comment about low AAO and La Nina in 2008.
Paul,
Re: “The bit about electricity pulling the atmosphere towards the equator (if I haven’t misunderstood) will surely be mercilessly attacked by physicists.”
Leif tells me this:
“The standard way of making such an analysis is called a ‘superposed epoch’. You pick a set of ‘key times’, e.g. a dip in Dst. Say you have 90 such dips. Then you take 90 slices of ao each several days wide and line them up such that they coincide on the key times. finally, you compute the average for each day of those slices and plot the result. This gives you the response and the spread gives you the error bar.
Can you help?
I will second this statement:
“I would like to caution all climate ‘hobbyists’ that it is necessary to condition analyses on the season of the year; the notion that anomalies have some ideal properties that obviate the need to look at seasons is purely nonsensical.”
If we notice that sea surface temperatures relate to atmospheric conditions at disparate latitudes from pole to pole and that sea surface temperatures relate strongly to the differential pressure driving the wind systems we can further note that the differential pressure driving the trades and the westerlies in the northern hemisphere depends upon atmospheric pressure over Antarctica and also over the Arctic. And the same applies in reverse.
Pressure fluxes much more at the poles than elsewhere, the atmosphere moves across the hemsipheres. This is the result of an external, not an internal driver.
I thought I would show some diagrams. In the end it was easier to do a quick and dirty post on my blog. So, the data that backs up my comment is at: http://climatechange1.wordpress.com
Erl, I’m not convinced (at all) that SW should be swapped for Dst. I encourage you to consider where SW is measured (vs. where SW-influenced geomagnetic indices, such as Dst, are measured).
—
Erl Happ asked, “Can you help?”
If a sufficient research grant is supplied: Yes.