
Guest post by Thomas Fuller and Tony Brown
When we separate what scientists have actually said from what messages are carefully prepared and communicated to us through the media, one thing jumps out to the most casual of readers.
Some marketing strategists reduced the information content of the messages given to the public and introduced popular symbols to indicate what they wanted us to believe was threatened by climate change.
For over 5 years we have been bombarded with images of polar bears, hurricanes, flooded cities, icebergs calving, drought-stricken deserts, and the like. Perhaps the most symbolic representation wasn’t even a picture, but a PowerPoint slide of paleoclimatic temperature reconstructions now famous as the Hockey Stick Chart.
Those symbols all have one thing in common. They were mistakenly used. As has been cataloged here and elsewhere, these ‘signature’ issues were either blown out of proportion or presented falsely.
Polar bears, like all large mammals that haven’t had the good fortune to be domesticated, have a shaky status on this planet–but that status does not appear to have very much at all to do with climbing temperatures. They survived higher temperatures in the past, and their population is rising–and would be rising even more quickly if we quit shooting them, that being the major cause of polar bear deaths.
There is no historical trend in either the frequency or intensity of hurricanes, as Roger Pielke Jr. has pointed out in academic publications. And yet global warming has been blamed for specific storms, such as Hurricane Katrina, in a manner that is frankly antithetical to the principles of science.
And so it is with icebergs calving (a completely normal and mechanical reaction to ice accumulation that happens whether temperatures are rising or falling), droughts (which were worse in the past) and all the other symbolic climate porn photography inflicted upon us.
Yesterday I wrote about sea level rise, and attempts to measure ice loss in Antarctica via satellite. And again, it is very clear that the results of scientific work are being hijacked in an attempt to push a scary message at us. The analysis of gravimeter measurements start with guesses and inferences, and the result is presented with a huge margin of error, and amounts to less than 1% of the annual ice loss Antarctica experiences every year.
Commenter TonyB went to the trouble of cataloging the difficulties inherent in sea level measurements. By rights it should be posted here as an article. I’ll paste it in at the bottom of this piece–and I will wager most readers will think it is more informative than my words above it.
But before I turn the stage over to TonyB, I want to make a couple of points:
First, it should be obvious that the manipulation of the messages isn’t coming from scientists. It is too professional, too slick and ultimately too wrong. This is a professional, coordinated media strategy using calendars with press schedules and release dates, a well-stocked photo library and a rapid response team that shoves new releases out the door in response to news events or skeptical messages that seem to be gaining traction.
Second, and really most important, all of the messages have very serious flaws in the narratives that accompany the pictures they ship out. And it is the exposure of these flaws that has crippled the climate change political movement, far more than criticism or political opposition.
If climate change or global warming is now a declining motivation for political and economic action, and it may well be, the reason is not Monckton or Morano. It is not even more measured criticism coming from McIntyre and Watts. Nor is it corrective science administered by both Pielkes.
It is their own butchery of the facts behind the images they decided we needed to see that hamstrung their movement. If they have been defeated in the first series of battles (in what I predict will be a 30-year war), they done it to themselves.
Here’s Tony–read on!
No problem. I was going to work this up into an article on sea levels one of these days although someone must have already posted an article here on this fragile part of a fragile science.
“We are being bamboozled by science which likes to have a nice graph to explain everything, unfortunately the real world is more complicated than that. Global sea levels are -like global temperatures-a nonsensical artifact dreamt up in a computer laboratory where satellite records are tacked on to manufactured and highly incomplete historic records from selected tide gauges.. Modern Sea level rises- where happening- are not being seen in context as another of those regular cycles that stretch back much further than the satellite records or tide gauges into the depths of recorded time.
This is the latest IPCC assessment which confirms sea level calculations from 1993 are by satellite.(page 5 onwards)
Link1
http://www.ipcc.ch/pdf/assessment-report/ar4/wg1/ar4-wg1-spm.pdf
The sea level calculations rely on an enormous number of variable factors including pressure, location, tides, warmth of oceans, structures, storms, wave heights, surges, stasis, location of the gauge/sensor, slope of the underlying strata etc. The accuracy of measurements is said to be 3cm (10 times the level of the alleged annual rise) but in reality is often vaguer than that because of the inherent difficulties of measuring. Observed real world sea levels generally simply do not show the rate of increase suggested by the IPCC (although this varies enormously from place to place for reasons cited above)
Link 2 The document below was written by many of our old friends including Phil Jones and Mike Hulme-page 19 gives the sea level data
http://ukclimateprojections.defra.gov.uk/images/stories/trends_pdfs/Trends_section1&2.pdf
The information for historic sea levels was ‘extended’ from a paper by one of the scientists at Proudman
Link3
http://www.pol.ac.uk/ntslf/products.php
Link 4 This is reconstruction of sea level data from 1700 of three extremely incomplete Northern Hemisphere records from which IPCC extrapolate their figures, take them to be a global figure and splice them on to the satellite records
Link 5 .
http://www.pol.ac.uk/psmsl/author_archive/jevrejeva_etal_1700/
These three are taken to represent global figures since 1700-much data missing and subsequently interpolated.
Amsterdam from 1700 (Van Veen 1945)
Liverpool since 1768 (Woodworth 1999)
Stockholm since 1774 (Ekman 1988)
It says there are differences even in the same ocean basin between tide gauges of up to plus or minus 6cm rendering their use for a global record to be irrelevant
Link 6
http://www.pol.ac.uk/psmsl/author_archive/jevrejeva_etal_1700/2008GL033611.pdf
pdf from 1700 link
6cm margin of error from tide gauges in same ocean basin
Both the following sites give a good description of the satellite process-which is being constantly refined but doesn’t get more extremely accurate as the inherent flaws in measuring capabilities can’t be fully resolved no matter how many satellite passes are made.
Link 7
http://www.tos.org/oceanography/issues/issue_archive/issue_pdfs/15_1/15_1_jacobs_et_al.pdf
Link 8
http://jchemed.chem.wisc.edu/Journal/Issues/1999/dec/abs1635.html
The following sites deals with problems of satellite accuracy and data;
Link 9
http://www.ocean-sci.net/5/193/2009/os-5-193-2009.html
Link 10
This with reliability
http://www.climateaudit.org/?p=859
Link 11
http://lightblueline.org/satellite-tracking-sea-levels-set-launch
The UK Environment Agency -where possible like to use physical tide gauges as well when developing flood defence schemes, which are both visually observed or can send data electronically. Best of all is gathering information from local people such as the Harbour master or those who work the fishing boats and who know what is really happening.
The following link leads to a graph produced by the Dutch Govt sea level organisation- and confirm sea levels are stable and are somewhat lower than during the MWP. (This won’t stop them reacting to the IPCC by raising sea defences)
Link 12
http://www.climateaudit.org/?p=61
Link 13
We have much observational evidence of historic sea levels (p162 on-including a map in the following link)
Ancient Greek explorer Pytheas traveled to Iceland and not only discovered the frozen seas lying one days journey beyond, but was the first to quantify the moons action as being responsible for tides, and took physical measurements of heights. Sea level heights are generally said to be lower today than back in the Roman warm period and Mwp.
Sea castles in the UK built in the 11th century are now above the sea level entrances which ships used to re-supply them.
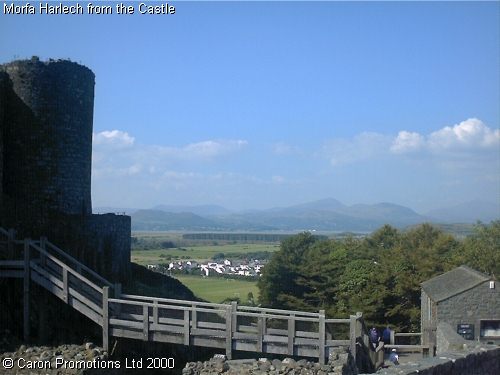
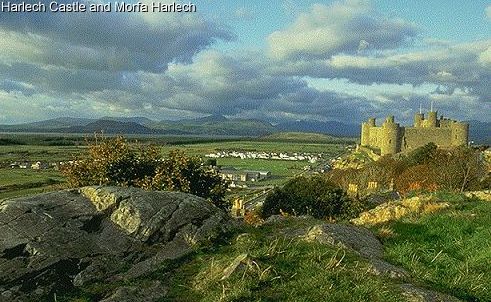
This links leads to a 1913 book on Harlech castle-one such building which is now high and dry-nothing to do with stasis or deposition, but that sea levels are lower now than when it was built 1000 years ago. Suggest readers select the b/w pdf
Link 14
http://www.archive.org/details/merionethshire00morr
Extract
“In 1409 an attack was made upon Harlech, led by Gilbert and John Talbot for
the King; the besiegers comprised one thousand well armed soldiers and a big siege train. The besieged were in the advantageous situation of being able to receive their necessary supplies from the sea, for the waves of
Cardigan Bay at that time washed the base of the rock upon which the castle stands. Greater vigilance on the part of the attacking force stopped this and the castle was surrendered in the spring of the year.
A remarkable feature of the castle is a covered staircase cut out of the rock, defended on the seaward side by a looped parapet, and closed above and below by small gatehouses. This was the water-gate of the fortress,
and opened upon a small quay below.”
Link 15 The following pictures show the current location of the sea.
http://westwales.co.uk/graphics/morfaharlech.jpg
Link 16
Sea in far distance from Harlech castle
http://westwales.co.uk/graphics/harlech.jpg
and this
Link 17
http://www.buildmodelcastles.com/html/castle_history.html
very good item about Harlech
Link 18
http://www.walesdirectory.co.uk/Castles/Harlech_Castle.htm
Sea levels AND temperatures were higher in the MWP and the Roman warm periods and presumably other extended warm periods (the period 1700 to 1740 is looking increasingly comparable to today).
The worlds leading sea level expert Professor Morner has called the IPCC figures ‘a lie.’ Google ‘The greatest lie ever told’
Morner says: “The mean eustatic rise in sea level for the period 1850-1930 was in the order of 1.0-1.1 mm/year,” but that “after 1930-40, this rise seems to have stopped (Pirazzoli et al., 1989; Morner, 1973,2000).” This stasis, in his words, “lasted, at least, up to the mid-60s.” Thereafter, “the record can be divided into three parts: (1) 1993-1996 with a clear trend of stability, (2) 1997-1998 with a high-amplitude rise and fall recording the ENSO event of these years and (3) 1998-2000 with an irregular record of no clear tendency.” Most important of all, in his words, “There is a total absence of any recent ‘acceleration in sea level rise’ as often claimed by IPCC and related groups.”
He concludes: “When we consider past records, recorded variability, causational processes involved and the last century’s data, our best estimate of possible future sea-level changes is +10 +/- 10cm in a century, or, maybe, even +5 +/- 15cm.” See also Morner (1995); INQUA (2000).”
I am inclined to agree with Professor Morner that sea level is not really doing very much generally (with exceptions either way in some places)
Link 19
http://www.publications.parliament.uk/pa/ld200506/ldselect/ldeconaf/12/12we18.htm
The above link dissects the data and states that a rise by 2100 of 5cm is possible…. plus or minus 15cm!
Morner stresses (as I do) that observational data contradicts the theoretical interpolated and massaged data that is used by the IPCC.
John Daly also had a good handle on all this.
Link 20
http://www.john-daly.com/deadisle/index.htm
The sea level is not rising at the rate suggested-it has stumbled in recent years according to many local gauges (what is global sea level supposed to mean with a million kilometres of coastline?)
To reach a 1 metre increase by 2100 means an average of nearly 11mm a year (only 90 years remaining). There is simply no evidence to show this is happening.
We must stop looking at just a few years of data as ‘proof’ of rising levels , and instead view things in a historic context, whilst retaining a great deal of scepticism at the notion you can create a highly accurate global figure in the first place, or that tacking dubious satellite data on to even more dubious tide gauge data is any way to create a worthwhile measurement .
I had intended to cover historic sea levels as a companion to my ‘arctic ice variation through the ages’ series.
Thomas Fuller http://www.redbubble.com/people/hfuller
Yeah, but then I’d have to write a book or something…
tonyb says:
September 7, 2010 at 4:08 pm
Thanks for the additions! Now you’ll know better than to submit a “raw”
datasetstory to anyone! 😉Good work!
Justa Joe says:
September 7, 2010 at 1:35 pm
GeoFlynx says:
September 7, 2010 at 9:55 am
“…Championing the continued dumping of some 30 billion tons of fossil CO2 into the Earth’s atmosphere …”
Excuse me as I’m unimpressed….
Funny how the 96 -97% of natural CO2 is innocent as the wind driven snow while so called man made CO2 is of the devil and enough to throw the whole world’s climate out of whack.
________________________________________________________________________
Yes and isn’t it interesting how the establishment scientists always neglect the much higher CO2 was in the geologic past. They neglect the fact commercial greenhouses have found plants much prefer 1000ppm of CO2 thanks to their genetic history. Given that 180ppm is the lower threshold, below which we kill off most of the planet, I for one are very glad the earth did not continue sequestering the available CO2. I am glad mankind is returning much needed carbon to the life cycle. After all we and all the plants and animals are made of carbon water but everyone seems to forget that.
Instead of vilifying skeptics people should thank us for keeping idiots from sequestering a much needed element – carbon.
Please do not bring up the CO2 in ice cores, I have read:
Segalstad, T. V. 1998: Carbon cycle modelling and the residence time of natural and anthropogenic atmospheric CO2: on the construction of the “Greenhouse Effect Global Warming” dogma. In Bate, R. (Ed.): Global warming: the continuing debate. ESEF, Cambridge, U.K. (ISBN 0952773422), pp. 184-219.
http://www.co2web.info/ESEF3VO2.pdf
Gail Combs says: September 7, 2010 at 4:02 pm
Doug says:
September 7, 2010 at 1:26 pm
…..Gail. Thanks
—————————————————————————————Did you note that one of the funding groups was the Council on Foreign Relations? David Rockefeller of Standard Oil is an honorary chairman and its earlier origins included Paul Warburg, a German, who was responsible for the Federal Reserve.
============================================================
Gail Yes I did. I have also read a lot of your references concerning this whole matter which is quite alarming to contemplate. The problem as I see it is that there are very strong indications that the building blocks for this are already being placed. For some time now, I have noticed the demise of the European states and the rise of the undemocratic EU which (IMO)has emasculated them as well as the say of individuals within them. I see the UN trying to do this on a global scale. I had thought that the U.S. with its political background would not be caught up in this – but ???
Anyway, thanks for your posts – I always read these!
Doug
John Shade (10:06): You mentioned an agency called Futerra. I never heard of them before, but with a little digging you can find links to a vast, vast, green advocacy industry. A few examples: Sandbag (an AGW ‘campaigning organization), Education Action International, the Refugee Council, Friends of the Earth, Stop Climate Chaos, the UN Sustainable Lifestyles Taskforce, Tomorrow’s Company (an ‘agenda-setting think and do tank’), Green Energy Scheme, Climate Care, etc etc etc.
Question: Do these people do any work? Next question: Where does all the money come from to feed this army of windbags?
Or, approach the question from the opposite direction: With all these thousands of educated and intelligent people occupying these NGO non-jobs, is it any surprise that they latch on to a non-problem like Global Warming and develop it with sophisticated propaganda skills? We never ‘ad all this palaver when the grandparents of these chatterboxes worked in the docks and steelworks!
Mike Roddy says:
September 7, 2010 at 2:58 pm
…Here’s a good summary of what the future really looks like, from a comprehensive analysis done at MIT:
http://web.mit.edu/newsoffice/2009/roulette-0519.html
REPLY: readers, Mike Roddy’s MO is a “drive by troll”. His history is that he posts potshots like this, then runs from debate. My advice is that you simply ignore him – Anthony
______________________________________________________
Actually I thought a glance at the article about MIT’s “revised model” was pretty funny. When you quickly glance at it you see what looks like a roulette wheel in the upper right corner, no doubt representing their “model”
Do they throw darts at it, spin it or do a “pin the tail on the donkey”? I figure any of those three options are as accurate as their “new improved” computer model.
REPLY: yeah we covered that here: http://wattsupwiththat.com/2009/10/02/wheel-of-silly/
All the more reason to ignore Mike Roddy – Anthony
Re: Mike Roddy
Aww give the poor guy a break. He’s just tryin’ to make a buck (or two).
http://www.rushprnews.com/2008/09/26/california-dreamin-changing-the-world-in-2112/
Philip Thomas says:
September 7, 2010 at 12:28 pm
I cannot help thinking that this article, while dismissive of much of the GW propaganda, was written just to try and exonerate the scientists and blame somebody else…..
___________________________________________________
Actually given the climategate e-mails and the slick hype, I see it as collusion and a well orchestrated media campaign.
Here are the most obvious examples:
Consider Real Climate
“It should be foremost on the minds of many that the RealClimate.org webserver domain is funded by Fenton Communications, an eco media group.” http://wattsupwiththat.com/2009/12/20/a-telling-omission-by-real-climate/
Consider Wikipedia
“The editor who takes issue with this event writes:
On Sunday night, I went to the William Connolley wiki page and entered:
Additional criticism appeared on December 19, 2009, in nationalpost.com, as “How Wikipedia’s green doctor rewrote 5,428 climate articles.” This alleges that Connolley removed more than 500 wiki articles of which he disapproved; that he published inaccurate information on the controversial “hockey stick” graph; that he specifically opposed scientists from the Harvard-Smithsonian Center for Astrophysics.”
http://wattsupwiththat.com/2009/12/22/william-connolley-and-wikipedia-turborevisionism/
The scientist were all part of the slick media hype because they provided the fuel as well as crossed the line between science and advocacy. My first post was only to show that there was a professionally organized media campaign and not to let the scientists off the hook. They are guilty as He!! and I have no sympathy for them. If you want to look at yourself in the mirror without cringing you do not compromise your scientific integrity. As a scientist I have walked from more than one job for just that reason.
latitude says: “. . . the sea is presently about a 1/2 mile away.”
September 7, 2010 at 3:24 pm
The report you cite is from 2006 and seems to be just someone’s quick estimate.
52.861259, -4.110437
Use Google Earth. Go to the above Lat./Long.
The Google image shows a date of March 5, 2006.
Use the ruler – make a direct line to the thin ‘almost white’ or dry beach.
I went to the dark/white divide, probably the recent tide line.
0.61 miles or 1 km.
However, as I doubt this has much to do with sea level rise (or fall) it is of little importance in the great cosmic question – “Are we all going to drown?”
Repeat this: John F. Hultquist says at 2:42 pm
barry woods says:
“Futerra and The UK Department for Environment published the Rules of the Game on 7 March 2005” which included the term “Climate Change Deniers”.
related?
21 March 2005: Independent: David Nicholson-Lord: The biggest challenge of our time
When the definitive history of climate change is written, it may well include a chapter on denial. A new study from the Department for the Environment, Food and Rural Affairs (Defra) shows that while people acknowledge the threat posed by climate change, they tend to see it as remote – a problem for the developing world, for future generations, for industry and Government rather than individuals. ..
Last month, following a report from the communications consultancy Futerra, Defra announced a £12m climate communications initiative aimed at what Margaret Beckett, the secretary of state, called engaging people “close to home”. …
http://www.independent.co.uk/environment/the-biggest-challenge-of-our-time-529294.html
another of the Independent newspaper’s CAGW zealots, Johann Hari, had the following published in UK Independent and the US Seattle Post-Intelligencer just weeks later. of course, no-one – sceptic or otherwise – doubts the climate changes but asking/demanding the scientists and media to stop using this UN-sanctioned false equivalent for CAGW has failed to date. btw, if anyone has evidence of the use of “climate change deniers” earlier than Futerra and the articles here, please post it.
24 April 2005: UK Independent: Johann Hari: The shame of the climate change deniers
More than 10,000 reputable scientists believe in man-made global warming; seven doubt it
The climate-change deniers are rapidly ending up with as much intellectual credibility as creationists and Flat Earthers. Indeed, given that 25,000 people died in Europe in the 2003 heatwave caused by anthropogenic climate change, given that the genocide unfolding in Darfur has been exacerbated by the stresses of climate change, given that Bangladesh may disappear beneath the rising seas in the next century, they are nudging close to having the moral credibility of Holocaust deniers. They are denying the reality of a force that – unless we change the way we live pretty fast – will kill millions.
http://www.independent.co.uk/opinion/commentators/johann-hari/the-shame-of-the-climatechange-deniers-508762.html
same story, different headline:
29 May 2005: Seattle Post-Intelligencer: Johann Hari: Global warming? A small few non-believers say no
http://www.seattlepi.com/opinion/226175_climate29.html
Tony B., Thanks for stepping into this. Your extensive reading is obvious and the links and references are outstanding.
I was on Banks Isl and, Northwest Territories two summers ago. I`m a geologist, so wandering the beaches of the Arctic I observed that the 3 to 5 m high, eroding cliffs of silt, mud and (lesser amounts) sand were offshore deposits, deltaic in origin but truncated at a point more seaward than landward. The deposits result from stream-fed erosion and washing of the interior of the island and post-date the loss of glacial ice. I asked a couple of government geologists studying exposed, ancient permafrost beds about this and they explained that work has suggested that the entire Banks Island (i.e. regional Arctic) is now 26m higher than it was during the end of the ice age. In this area the ice age ended something like 8 or 10, 000 years ago. The land has risen a minimum of 26 m since then, and is actually rising. This rise was clear to me when I drove the Dempster Highway to Inuvik (a 700 km dirt road) that hit the Mackenzie River about 125 km south of its Arctic terminus, but it was already a delta. You can get lost in the deltaic tributaries 125km from the ocean. The delta has infilled 125km since the Arctic Ocean became ice-free (although permafrost still underlies its entire length). This is a classic transgressiver shoreline, created this time not by sediment load overwheming the coastline, but by the rise of the northern continent.
Last summer I was on the shores of Hudson Bay, at Churchill. Hudson Bay is still rising, and causing, to the south, the growth of Lake Winnipeg as a flexure exists between Hudson Bay and Lake Winnipeg. Lake Winnipeg is about 4X the size it was 7000 years ago as a result. And if you want to find paleo-Inuit campspots of 4000 years ago, you have to go 100 km inland.
We hear of the Arctic being inundated by rising sea levels. It will have to do so in a hurry to move faster than the land, and even at that we will be way above what it was a few thousand years ago. The warmists who believe in a static planet must have aproblem with the northern part of our continent.
This rising sea level business is another project for hair-splitters, statisticians and computer models. None of which is a warmist, come to think of it.
Perhaps the repair kit shown at the top of the page should include a number of special McShane and Wyner angle section inserts…
Oh right the CRU emails were between PR hacks, no scientists were involved. Thankyou Mr Fuller that explains everything. Just as environment canada is fully staffed by PR nitwit. Oh wait thats true.Its getting so I can’t see any science in climate science, so you might be right. Or is this part of the negotiation phase of AWG? Your accumlative posts are forming a pattern. I have already bought enough BS involuntarily(think tax dollar) I doubt I’m buying what you are trying to sell. I value science not sciency feelings.Think the UN team has any to offer?
Maybe next time I drop by the responses to my post will include legitimate scientific rebuttals of the MIT study, not descriptions of the “roulette wheel” or references to my unproduced screenplay. Or, maybe not.
REPLY: Maybe next time you’ll post something substantial and drop the snark in your drive by trolling. So far your MO doesn’t lend itself to that happening though. – Anthony
D Caldwell says: September 7, 2010 at 4:11 pm
“All very interesting, but despite the volume of “peer reviewed” papers, the (amazingly consistent) conclusions are still speculative in nature”
I am unsure why “peer reviewed” deserves its double quotes. Anybody is free to examine the papers in question and, if found deficient, publish accordingly. “Amazingly consistent” is also a bit of a stretch. The papers, published across many decades, cover a range of estimates from +0.1C to +9.6C. Each one has its deficiencies to be sure, but in aggregate they send a coherent message. Every single paper shows a positive response of temperature to CO2 increase. What is the chance that that all these positive responses have happened by random coincidence? What is that chance that the direction lines up with the known physical properties of CO2?
Mike Roddy says:
September 7, 2010 at 7:44 pm
Well, Mike, if it’s a critique of the MIT press release that you want, it’s here.
http://www.drroyspencer.com/2009/05/the-mit-global-warming-gamble
But if you really want to get your cognitive dissonance on a roll, check this out by your MIT crew.
http://web.mit.edu/press/2010/wind-economy
Gonna stick that in your movie?
“Each one has its deficiencies” should read “Each one has its uncertainties” in my previous post.
Ammonite says:
“Every single paper shows a positive response of temperature to CO2 increase.”
Stand and deliver. Produce every single paper.
While we’re waiting, folks can click here to see that rises in temperature always precede rises in CO2 over the past 400,000 years.
Hi Smokey. Please see a list earlier in this blog. Note that CO2 is not the only forcing driving temperatures. A rise in temperature will generally cause a rise in CO2 and vice-versa. The two effects are coupled. Orbital forcing leads the earth out of glaciation causing CO2 to rise, which in turn causes temperatures to rise further. Fortunately the process does not cause runaway…
The Cinque Ports along the South East Coast of England, were originated during Henry ll reign in the 12th. Century, being first mentioned in the Royal Charter of 1155.
They were started with five ports: Dover, Sandwich, New Romney, Hythe and Hastings, originally to provide the Crown with a “ships service” of 57 ships, each with a crew of 21 men and a boy, for 15 days each year.
The main five Cinque Ports (pronounced SINK, not SANK) weren’t always able to provide the needs of the King, so two more main ports were added – Rye and Winchelsea
The Cinque Ports reached the peak of their powers in the 13th Century, acting on many occasions for the King, but earning some disgrace by their acts of robbery, pillage and smuggling.
The cause of their decline however, was due to the coastline changes that were taking place; some ports were no longer navigable and in some cases actually landlocked.
Dover is now the only Head Port to retain an important Harbour. Much of Hastings was in the 13th century washed away by the sea.
New Romney is now about a mile and a half from the seafront
Hythe is still on the coast. However, although it is beside a broad bay, its natural harbour has been removed by centuries of silting.
Sandwich is now 3 km (2 miles) from the sea and no longer a port.
Rye stands approximately two miles from the open sea.
Winchelsea retains its medieval setting on a hill surrounded by largely empty marsh
Ammonite,
It is the perception of some (including me) that the peer review process is not working as it should in the climate science community. Most papers are from a relative few in the “club” who review each other’s work and, to put it nicely, are very “mutually supportive”. There is also evidence in certain e-mail traffic that they try to exclude those with whom they disagree from publishing.
You said, “…but in aggregate they send a coherent message. Every single paper shows a positive response of temperature to CO2 increase.”
Yes, yes, I am aware of the great number of papers in support of CO2 warming and a sensitive climate, but try to remember that good science is not a matter of a consensus of opinion. There have been many times in the past when the majority have been wrong and a small minority were eventually proved correct.
Consensus is not scientific proof and the results of computer simulations are not the same as actual observed data.
A rant.
Forcing as used in climate “science” is not a physics term.
Force in physics is clearly and well defined:
F=ma where m is the mass and a is the acceleration a body undergoes when interacting.
As a verb in physics it has no defined meaning .
In everyday language, force and forcing has many meanings, and climate “science” is using an ad hoc definition, “anything that changes climate is a forcing”, and mainly with units of energy per second.
The units are wrong too.
Force=mdv/dt units: mass velocity/time
forcing= d(1/2*mv^2)/dt units:mass (velocity squared)/time
Some forcing broke the icons.
It is bad to utilize confusing terminology, unless one wants to confuse. The terminology “force” carries with it a number of physical consequences that by no means are provable for “forcing”.
rant/off
Does the apparatus to correct broken sticks work for floorball sticks, too? I (or my co-players, to be more precise) have already broken two… There could be at least some application of demagogic Mannian attempts to fix the unfixable. 🙂
Apologies for having played this left-wing sport. 😉
@Anna V. Please please please rant like that some more 😎
Every time I hear “forcing” used my skin crawls. It just ISN’T a term of science. It has no defined units and it just not “real”. It’s mush for “I want to believe things will be moved by the animal spirits”…
Very early on, I learned from my chemistry teacher, Mr. McGuire, to solve the units first, and only then do the arithmetic. If you don’t have the units right, the arithmetic is just a fools errand resulting in a trash answer. And with the use of unit-less “forcing” every answer must be trash. If you can’t do the physics in proper physics units, then your approach is just dreams and fantasy.
I am very happy to hear a kindred spirit with the same belief about this “sand in the teeth”…