
Guest post by Thomas Fuller and Tony Brown
When we separate what scientists have actually said from what messages are carefully prepared and communicated to us through the media, one thing jumps out to the most casual of readers.
Some marketing strategists reduced the information content of the messages given to the public and introduced popular symbols to indicate what they wanted us to believe was threatened by climate change.
For over 5 years we have been bombarded with images of polar bears, hurricanes, flooded cities, icebergs calving, drought-stricken deserts, and the like. Perhaps the most symbolic representation wasn’t even a picture, but a PowerPoint slide of paleoclimatic temperature reconstructions now famous as the Hockey Stick Chart.
Those symbols all have one thing in common. They were mistakenly used. As has been cataloged here and elsewhere, these ‘signature’ issues were either blown out of proportion or presented falsely.
Polar bears, like all large mammals that haven’t had the good fortune to be domesticated, have a shaky status on this planet–but that status does not appear to have very much at all to do with climbing temperatures. They survived higher temperatures in the past, and their population is rising–and would be rising even more quickly if we quit shooting them, that being the major cause of polar bear deaths.
There is no historical trend in either the frequency or intensity of hurricanes, as Roger Pielke Jr. has pointed out in academic publications. And yet global warming has been blamed for specific storms, such as Hurricane Katrina, in a manner that is frankly antithetical to the principles of science.
And so it is with icebergs calving (a completely normal and mechanical reaction to ice accumulation that happens whether temperatures are rising or falling), droughts (which were worse in the past) and all the other symbolic climate porn photography inflicted upon us.
Yesterday I wrote about sea level rise, and attempts to measure ice loss in Antarctica via satellite. And again, it is very clear that the results of scientific work are being hijacked in an attempt to push a scary message at us. The analysis of gravimeter measurements start with guesses and inferences, and the result is presented with a huge margin of error, and amounts to less than 1% of the annual ice loss Antarctica experiences every year.
Commenter TonyB went to the trouble of cataloging the difficulties inherent in sea level measurements. By rights it should be posted here as an article. I’ll paste it in at the bottom of this piece–and I will wager most readers will think it is more informative than my words above it.
But before I turn the stage over to TonyB, I want to make a couple of points:
First, it should be obvious that the manipulation of the messages isn’t coming from scientists. It is too professional, too slick and ultimately too wrong. This is a professional, coordinated media strategy using calendars with press schedules and release dates, a well-stocked photo library and a rapid response team that shoves new releases out the door in response to news events or skeptical messages that seem to be gaining traction.
Second, and really most important, all of the messages have very serious flaws in the narratives that accompany the pictures they ship out. And it is the exposure of these flaws that has crippled the climate change political movement, far more than criticism or political opposition.
If climate change or global warming is now a declining motivation for political and economic action, and it may well be, the reason is not Monckton or Morano. It is not even more measured criticism coming from McIntyre and Watts. Nor is it corrective science administered by both Pielkes.
It is their own butchery of the facts behind the images they decided we needed to see that hamstrung their movement. If they have been defeated in the first series of battles (in what I predict will be a 30-year war), they done it to themselves.
Here’s Tony–read on!
No problem. I was going to work this up into an article on sea levels one of these days although someone must have already posted an article here on this fragile part of a fragile science.
“We are being bamboozled by science which likes to have a nice graph to explain everything, unfortunately the real world is more complicated than that. Global sea levels are -like global temperatures-a nonsensical artifact dreamt up in a computer laboratory where satellite records are tacked on to manufactured and highly incomplete historic records from selected tide gauges.. Modern Sea level rises- where happening- are not being seen in context as another of those regular cycles that stretch back much further than the satellite records or tide gauges into the depths of recorded time.
This is the latest IPCC assessment which confirms sea level calculations from 1993 are by satellite.(page 5 onwards)
Link1
http://www.ipcc.ch/pdf/assessment-report/ar4/wg1/ar4-wg1-spm.pdf
The sea level calculations rely on an enormous number of variable factors including pressure, location, tides, warmth of oceans, structures, storms, wave heights, surges, stasis, location of the gauge/sensor, slope of the underlying strata etc. The accuracy of measurements is said to be 3cm (10 times the level of the alleged annual rise) but in reality is often vaguer than that because of the inherent difficulties of measuring. Observed real world sea levels generally simply do not show the rate of increase suggested by the IPCC (although this varies enormously from place to place for reasons cited above)
Link 2 The document below was written by many of our old friends including Phil Jones and Mike Hulme-page 19 gives the sea level data
http://ukclimateprojections.defra.gov.uk/images/stories/trends_pdfs/Trends_section1&2.pdf
The information for historic sea levels was ‘extended’ from a paper by one of the scientists at Proudman
Link3
http://www.pol.ac.uk/ntslf/products.php
Link 4 This is reconstruction of sea level data from 1700 of three extremely incomplete Northern Hemisphere records from which IPCC extrapolate their figures, take them to be a global figure and splice them on to the satellite records
Link 5 .
http://www.pol.ac.uk/psmsl/author_archive/jevrejeva_etal_1700/
These three are taken to represent global figures since 1700-much data missing and subsequently interpolated.
Amsterdam from 1700 (Van Veen 1945)
Liverpool since 1768 (Woodworth 1999)
Stockholm since 1774 (Ekman 1988)
It says there are differences even in the same ocean basin between tide gauges of up to plus or minus 6cm rendering their use for a global record to be irrelevant
Link 6
http://www.pol.ac.uk/psmsl/author_archive/jevrejeva_etal_1700/2008GL033611.pdf
pdf from 1700 link
6cm margin of error from tide gauges in same ocean basin
Both the following sites give a good description of the satellite process-which is being constantly refined but doesn’t get more extremely accurate as the inherent flaws in measuring capabilities can’t be fully resolved no matter how many satellite passes are made.
Link 7
http://www.tos.org/oceanography/issues/issue_archive/issue_pdfs/15_1/15_1_jacobs_et_al.pdf
Link 8
http://jchemed.chem.wisc.edu/Journal/Issues/1999/dec/abs1635.html
The following sites deals with problems of satellite accuracy and data;
Link 9
http://www.ocean-sci.net/5/193/2009/os-5-193-2009.html
Link 10
This with reliability
http://www.climateaudit.org/?p=859
Link 11
http://lightblueline.org/satellite-tracking-sea-levels-set-launch
The UK Environment Agency -where possible like to use physical tide gauges as well when developing flood defence schemes, which are both visually observed or can send data electronically. Best of all is gathering information from local people such as the Harbour master or those who work the fishing boats and who know what is really happening.
The following link leads to a graph produced by the Dutch Govt sea level organisation- and confirm sea levels are stable and are somewhat lower than during the MWP. (This won’t stop them reacting to the IPCC by raising sea defences)
Link 12
http://www.climateaudit.org/?p=61
Link 13
We have much observational evidence of historic sea levels (p162 on-including a map in the following link)
Ancient Greek explorer Pytheas traveled to Iceland and not only discovered the frozen seas lying one days journey beyond, but was the first to quantify the moons action as being responsible for tides, and took physical measurements of heights. Sea level heights are generally said to be lower today than back in the Roman warm period and Mwp.
Sea castles in the UK built in the 11th century are now above the sea level entrances which ships used to re-supply them.
This links leads to a 1913 book on Harlech castle-one such building which is now high and dry-nothing to do with stasis or deposition, but that sea levels are lower now than when it was built 1000 years ago. Suggest readers select the b/w pdf
Link 14
http://www.archive.org/details/merionethshire00morr
Extract
“In 1409 an attack was made upon Harlech, led by Gilbert and John Talbot for
the King; the besiegers comprised one thousand well armed soldiers and a big siege train. The besieged were in the advantageous situation of being able to receive their necessary supplies from the sea, for the waves of
Cardigan Bay at that time washed the base of the rock upon which the castle stands. Greater vigilance on the part of the attacking force stopped this and the castle was surrendered in the spring of the year.
A remarkable feature of the castle is a covered staircase cut out of the rock, defended on the seaward side by a looped parapet, and closed above and below by small gatehouses. This was the water-gate of the fortress,
and opened upon a small quay below.”
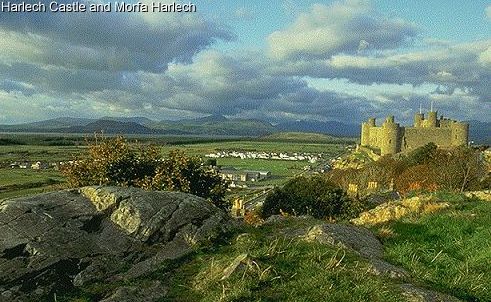
Link 15 The following pictures show the current location of the sea.
http://westwales.co.uk/graphics/morfaharlech.jpg
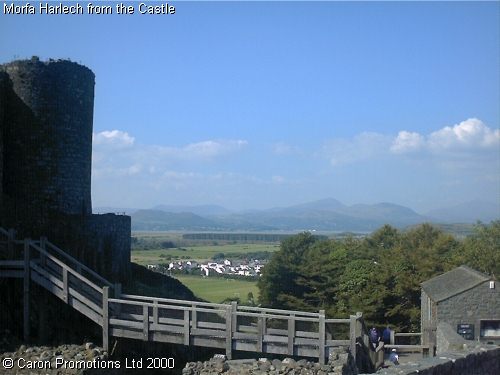
Link 16
Sea in far distance from Harlech castle
http://westwales.co.uk/graphics/harlech.jpg
and this
Link 17
http://www.buildmodelcastles.com/html/castle_history.html
very good item about Harlech
Link 18
http://www.walesdirectory.co.uk/Castles/Harlech_Castle.htm
Sea levels AND temperatures were higher in the MWP and the Roman warm periods and presumably other extended warm periods (the period 1700 to 1740 is looking increasingly comparable to today).
The worlds leading sea level expert Professor Morner has called the IPCC figures ‘a lie.’ Google ‘The greatest lie ever told’
Morner says: “The mean eustatic rise in sea level for the period 1850-1930 was in the order of 1.0-1.1 mm/year,” but that “after 1930-40, this rise seems to have stopped (Pirazzoli et al., 1989; Morner, 1973,2000).” This stasis, in his words, “lasted, at least, up to the mid-60s.” Thereafter, “the record can be divided into three parts: (1) 1993-1996 with a clear trend of stability, (2) 1997-1998 with a high-amplitude rise and fall recording the ENSO event of these years and (3) 1998-2000 with an irregular record of no clear tendency.” Most important of all, in his words, “There is a total absence of any recent ‘acceleration in sea level rise’ as often claimed by IPCC and related groups.”
He concludes: “When we consider past records, recorded variability, causational processes involved and the last century’s data, our best estimate of possible future sea-level changes is +10 +/- 10cm in a century, or, maybe, even +5 +/- 15cm.” See also Morner (1995); INQUA (2000).”
I am inclined to agree with Professor Morner that sea level is not really doing very much generally (with exceptions either way in some places)
Link 19
http://www.publications.parliament.uk/pa/ld200506/ldselect/ldeconaf/12/12we18.htm
The above link dissects the data and states that a rise by 2100 of 5cm is possible…. plus or minus 15cm!
Morner stresses (as I do) that observational data contradicts the theoretical interpolated and massaged data that is used by the IPCC.
John Daly also had a good handle on all this.
Link 20
http://www.john-daly.com/deadisle/index.htm
The sea level is not rising at the rate suggested-it has stumbled in recent years according to many local gauges (what is global sea level supposed to mean with a million kilometres of coastline?)
To reach a 1 metre increase by 2100 means an average of nearly 11mm a year (only 90 years remaining). There is simply no evidence to show this is happening.
We must stop looking at just a few years of data as ‘proof’ of rising levels , and instead view things in a historic context, whilst retaining a great deal of scepticism at the notion you can create a highly accurate global figure in the first place, or that tacking dubious satellite data on to even more dubious tide gauge data is any way to create a worthwhile measurement .
I had intended to cover historic sea levels as a companion to my ‘arctic ice variation through the ages’ series.
Thomas Fuller http://www.redbubble.com/people/hfuller
D Caldwell says: September 7, 2010 at 10:40 am
GeoFlynx,
You obviously accept at face value the alarmist assertions that:
1. CO2 is the dominant driver in the warming observed in the last 150 years and will contine to be the dominant driver in future decades.
2. Earth’s long term climate is sensitive and a modest increase in global temperatures will initiate a cascade of positive feedbacks resulting in certain climate catastrophe.
The earth’s climate sensitivity to a doubling of CO2 is around +3C (+/-1C). For a partial list of papers (up to 2006) supporting this proposition read below. Global tempatures at or near record highs, melting of ice globally and mulitple species migrations are all consistent with AGW. There is no rug big enough to sweep these under. Note that the sensitivity estimates do not specify the trajectory by which warming takes place. They just note that it happens (whatever the feedbacks in play).
For what +3C might be like, please read Mark Lynas “Six Degrees” and feel free to stop reading at the “3C” chapter. I regularly post this recommendation as the book is entertaining and well researched and many posters seem unsure where the boundary is between environmental hyperbole and scientifically informed judgment.
Augustsson T. and Ramanathan V. 1977. “A Radiative-Convective Model Study of the CO2 Climate Problem.” J. Atmos. Sci. 34, 448-451.
Arrhenius, Svante 1896. “On the Influence of Carbonic Acid in the Air Upon the Temperature of the Ground.” Philosophical Magazine 41, 237-76.
Bertrand, C. 1998. “Climate simulation at the secular time scale.” Thèse de doctorat, Université catholique de Louvain, 208 pp.
Boer, G. J., G. Flato, M. C. Reader, and D. Ramsden 2000. “A transient climate change simulation with greenhouse gas and aerosol forcing: Experimental design and comparison with the instrumental record for the twentieth century.” Climate Dynamics 16, 405–425.
Boer, G.J., N.A. McFarlane, and M. Lazare, 1992. “Greenhouse Gas-induced Climate Change Simulated with the CCC Second-Generation General Circulation Model.” J. Climate, 5, 1045-1077.
Boer George G. and Yu Bin 2003. “Dynamical aspects of climate sensitivity” Geophys. Res. Lett. 30(3), 35-1 – 35-4.
Callendar, G.S. 1938. “The Artificial Production of Carbon Dioxide and Its Influence on Climate.” Quarterly J. Royal Meteorological Society 64, 223-40.
Chen C.-T. and Ramaswamy V. 1996. “Sensitivity of Simulated Global Climate to Perturbations in Low-Cloud Microphysical Processes. Part I. Globally Uniform Perturbations.” J. Climate 9, 1385-1402.
Chou Ming-Dah, Peng Li, Arking Albert 1982. “Climate Studies with a Multi-Layer Energy Balance Model. Part II: The Role of Feedback Mechanisms in the CO2 Problem.” J. Atmos. Sci. 39, 2657-2666.
Dai A., Wigley T. M. L., Boville B. A., Kiehl J. T., Buja L. E. 2001. “Climates of the 20th and 21st centuries simulated by the NCAR Climate System Model.” J. Climate 14, 485– 519.
Delworth Thomas L., Broccoli Anthony J., Dixon Keith; Held Isaac; Knutson Thomas R., Kushner Paul J., Spelman Michael J., Stouffer Ronald J., Vinnikov, Konstantin Y., Wetherald, Richard E. 1999. “Couple Climate Modelling at GFDL: Recent Accomplishments and Future Plans.” CLIVAR Exchanges 4(4), 15-20.
Gilliland, Ronald L. and Schneider, Stephen H. 1984. “Volcanic, CO2 and solar forcing of Northern and Southern Hemisphere surface air temperatures.” Nature 310, 38-41.
Goosse H., Arzel O., Luterbacher J., Mann M.E., Renssen H., Riedwyl N., Timmermann A., Xoplaki E., Wanner H. 2006. “The Origin of the European ‘Medieval Warm Period’.” Clim. Past, 2, 99–113.
Gordon, H. B., and S. P. O’Farrell 1997. “Transient climate change in the CSIRO coupled model with dynamic sea ice, Mon. Weather Rev. 125, 875–907.
Hall C.G. and Cacuci Dan G. 1982. “Sensitivity Analysis of a Radiative-Convective Model by the Adjoint Method. J. Atmos. Sci. 39, 2038-2050.
Hansen, James, Lacis A., Rind D., Russel G., Stone P., Fung I., Ruedy R., Lerner J. 1984. “Climate Sensitivity: Analysis of Feedback Mechanisms.” Climate Processes and Climate Sensitivity, Geophys. Mono. 29, 130-163. Am. Geophys. Union.
Hegerl, G. C., K. Hasselmann, U. Cubasch, J. F. B. Mitchell, E. Roeckner, R. Voss, and J. Waszkewitz 1997. “Multi-fingerprint detection and attribution analysis of greenhouse gas-plus-aerosol and solar forced climate change.” Climate Dynamics 13, 613–634.
Hegerl Gabriele C., Crowley Thomas J., Hyde William T., Frame David J. 2006. “Climate Sensitivity Constrained by Temperature Reconstructions over the Past Seven Centuries.” Nature 440, 1029-1032 (letter).
Hoffert, Martin I., Covey, Curt 1992. “Deriving Global Climate Sensitivity from Palaeoclimate Reconstructions.” Nature 360, 573-576.
Hulburt, E.O. 1931. “The Temperature of the Lower Atmosphere of the Earth.” Physical Review 38, 1876-1890.
Idso, Sherwood B. 1980. “The Climatological Significance of a Doubling of Earth’s Atmospheric Carbon Dioxide Concentration The Climatological Significance of a Doubling of Earth’s Atmospheric Carbon Dioxide Concentration.” Science 207(4438), 1462-1463.
Lambert Stephen J. 1995. “The Effect of Enhanced Greenhouse Warming on Winter Cyclone Frequencies and Strengths.” J. Climate 8, 1347-1452.
MacKay Robert M., Ko Malcolm K.W., Shia Run-Lie, Yang Yajaing, Zhou Shuntai, Molnar Gyula 1997. “An Estimation of the Climatic Effects of Stratospheric Ozone Losses during the 1980s.” J. Climate 10(4), 774-788.
Mahfouf J.F., Cariolle D., Royer J.F., Geleyn J.F., Timbal B. 1993. “Response of the Meteo-France Climate Model to Changes in CO2 and Sea Surface Temperature.” Climate Dynamics 9(7), 345-362.
Manabe, Syukuro 1971. “Estimates of future change of climate due to the increase of carbon dioxide concentration in the air.” Man’s Impact on the Climate, W. I-I. Matthews, W. W. Kellogg, and G. D. Robinson, Eds., Cambridge, MA: The MIT Press, 249-264.
Manabe Syukuro 1975. “The dependence of atmospheric temperature on the concentration of carbon dioxide” 73-77 in The Changing Global Environment, Dordrecht, D. Reidel Publishing Co.
Manabe, Syukuro, and Stouffer, Ronald J. 1979. “A CO2-Sensitivity Climate Study with a Mathematical Model of the Global Climate.” Nature, 282, 491-493.
Manabe, Syukuro, and Stouffer, Ronald J. 1993. “Century-scale effects of increased atmospheric CO2 on the ocean-atmosphere system.” Nature 364, 215-218.
Manabe, Syukuro, and Wetherald, Richard T. 1967. “Thermal Equilibrium of the Atmosphere with a Given Distribution of Relative Humidity.” J. Atmospheric Sciences 24, 241-59.
Manabe, Syukuro, and Wetherald, Richard T. 1980. “On the Distribution of Climate Change Resulting from an Increase of CO2 Content of the Atmosphere.”
Manabe, Syukuro, and Wetherald, Richard T. 1975. “The effects of doubling the CO2 concentration on the climate of a general circulation model.” J. Atmos Sci. 32, 3–15
McAvaney, B.J., Colman. R., Fraser, J.F., and Dahni, R.R. 1991. “The response of the BMRC AGCM to a doubling of CO2.” BMRC Technical Memorandum No. 3 (in preparation).
Mitchell, J.F.B., Senior, C.A., and Ingram, W. J. 1989. “CO2 and climate: A missing feedback?.” Nature, 341, 132-134.
Möller, Fritz 1963. “On the Influence of Changes in the CO2 Concentration in Air on the Radiation Balance of the Earth’s Surface and on the Climate.” J. Geophysical Research 68, 3877-3886.
Nicoli Maria Pia and Visconti Guido 1982. “Impact of Coupled Perturbations of Atmospheric Trace Gases on Earth’s Climate and Ozone” Pure Appl. Geophys. 120(4), 626-641.
Noda, A., and Tokoika, T. 1989. “The effect of doubling CO2 concentration on convective and nonconvective precipitation in a general circulation model coupled with a simple mixed layer ocean.” J. Met. Soc. Japan, 67, 95-110.
Oglesby, R.J., and Saltzman, B., 1990. “Sensitivity of the equilibrium surface temperature of a GCM to systematic changes in atmospheric carbon dioxide.” Geophysical Research Letters, 17(8), 1089-1092.
Ohring George and Adler Shoshana 1978. “Some Experiments with a Zonally Averaged Climate Model.” J. Atmos. Sci. 35(2), 186-205.
Plass, Gilbert N. 1956. “The carbon dioxide theory of climatic change.” Tellus 8, 140-154.
Ramanathan, V. 1981. “The Role of Ocean-Atmosphere Interactions in the CO2 Climate Problem.” J. Atmos. Sci. 38, 918-930.
Rasool, S.I. and Schneider H.I. 1971. “Atmospheric Carbon Dioxide and Aerosols: Effects of Large Increases on Global Climate.” Science 173, 138-141.
Roeckner, E., L. Bengtsson, J. Feichter, J. Lelieveld, and H. Rodhe 1999. “Transient climate change simulations with a coupled atmosphere-ocean GCM including the tropospheric sulfur cycle” J. Climate, 12, 3004–3032.
Schlesinger Michael E., Zhao Zong-Ci, Vickers Dean 1989. “Design and Critical Appraisal of an Accelerated Integration Procedure for Atmospheric GCM/Mixed-Layer Ocean Models.” J. Climate 2, 641-655.
Schlesinger, M.E., N. Andronova, A. Ghanem, S. Malyshev, T. Reichler, E. Rozanov, W. Wang and F. Yangi 1997. “Geophysical Scenarios of Greenhouse_Gas and Anthropogenic Sulfate Aerosol Induced Climate Changes.” Climate Research Group Report, Department of Atmospheric Sciences, University of illinois at Urbana Champaign, Urbana, IL, USA.
Sellers, William D. 1973. “A New Global Climatic Model.” J. Appl. Meteorol. 12, 241-254.
Sellers, William D. 1974. “A Reassessment of the Effect of CO2 Variations On a Simple Global Climatic Model.” J. Appl. Meteorol. 13, 831-833.
Shaviv, N., Veizer, J. 2003. “Celestial driver of Phanerozoic climate?” GSA Today 13(7), 4-10.
Stern, David I. 2005. “An atmosphere–ocean time series model of global climate change.” Computational Statistics & Data Analysis uncorrected proof — http://www.rpi.edu/~sternd/CSDA_inpress.pdf, accessed 1/31/2007
Sumi, Akimasa 2005. “Global Warming Simulation due to the High Resolution Climate Model by Using the Earth Simulator.” Annual Report of the Earth Simulator Center April 2004 – March 2005.
Temkin Richard L. and Snell Fred M. 1976. “An Annual Zonally Averaged Hemispherical Climatic Model with Diffuse Cloudiness Feedback.” J. Atmos. Sci. 33(9), 1671-1685.
Thompson, S.L. and Pollard, D. 1995. “A global climate model (GENESIS) with a Land-Surface-Transfer Scheme (LSX). Part 2: CO2 sensitivity.” J. Climate, 8, 1104-1121.
Washington, W.M., and Meehl, G.A. 1984. “Seasonal cycle experiments on the climate sensitivity due to a doubling of CO2 with an atmospheric GCM Coupled to a simple mixed layer ocean model.” J. Geophys. Res., 89, 9475-9503.
Washington, W.M., and Meehl, G.A. 1989. “Climate sensitivity due to increased CO2: experiments with a coupled atmosphere and ocean general circulation model.” Climate Dynamics, 4, 1-38.
Washington, W. M., J. W. Weatherly, G. A. Meehl, A. J. Semtner, T. W. Bettge, A. P. Craig, W. G. Strand, J. Arblaster, V. B. Wayland, R. James, and Y. Zhang 2000. “Parallel climate model (PCM) control and transient simulations” Climate Dynamics 16, 755– 774.
Weare B.C. and Snell F.M. 1974. “A Diffuse Thin Cloud Structure as a Feedback Mechanism in Global Climatic Modeling.” J. Atmos. Sci. 31, 1725-1734.
Wetherald, R.T., and Manabe, S. 1986. “An investigation of cloud cover change in response to thermal forcing.” Climatic Change, 10, 11-42.
Wetherald, R.T., and Manabe, S. 1989. “Cloud feedback processes in a general circulation model.” J. Atmos. Sci., 45, 1397-1415.
Wetherald, Richard T., Stouffer, Ronald J., Dixon, Keith W. 2001. “Committed Warming and its Implications for Climate Change.” Geophys. Res. Lett. 28(8), 1535-1538.
Wilson, C.A., and Mitchell, J.F.B. 1987. “Simulated climate and CO2 induced climate change over western Europe.” Climatic Change, 19, 11-42.
Wolbarst, Anthony B. 1999. “Effective thermal conduction model for estimating global warming.” American Journal of Physics 67(10), 885–890.
HArlech:
And, having searched, here is the url for National Nature Reserves in Wales, Morfa Harlech is #6:
http://countryside.wales.info/National_Nature_Reserves.asp#6
And here is the tale of the lost lands ..
http://www.mysteriousbritain.co.uk/wales/gwynedd/folklore/the-lost-land-of-wales.html
“First, it should be obvious that the manipulation of the messages isn’t coming from scientists.”
To the contrary, it is not obvious at all. I was amazed how Judith Curry was able to continue to insinuate – through these very pages – her AGW message by appearing heroically to turn on her own party, and vaguely put blame on poor “communication”. In your two previous posts, Thomas, you did a similar thing, each time managing to tippy-toe a little further away from the AGW position while at no point admitting error on your part. The manipulation of the messages has obviously been by scientists. I’m bothered by media distortion, but I’m most bothered by scientific incompetence and/or fraud.
“It is their own butchery of the facts behind the images they decided we needed to see that hamstrung their movement. If they have been defeated…”
You say “they” and “their”. Thomas, when you use a plural personal pronoun and plural personal adjective, it needs to refer to some people recently mentioned. The only people mentioned in a text full of passive voice and impersonal subjects are “some marketing strategists”…mentioned at the other end of your essay, eleven paragraphs before! Please be very specific about which people and movement you are talking about. If you really think that scientists are innocent of imposing climate alarmism you’ll need to do a bit more than manipulate language to get your case across. Are you nervous about something you’ve said or done in the past? Are you, in fact, in favour of carbon taxation, ETS, expensive energy alternatives etc? Who are you and what are you?
“The worlds leading sea level expert Professor Morner has called the IPCC figures ‘a lie.’ Google ‘The greatest lie ever told’…”
Tony B.’s interesting article, like so many pieces published on Anthony’s invaluable site, points to something far more serious than naughty marketing. I really can’t see how Thomas Fuller’s peculiar exoneration of “scientists” has anything at all to do with Tony B’s contribution. It’s very strange.
CO2 = AGW
Absolute tosh !
pyromancer76 – check out Fenton Communications for a start . You can google it . Their list of clients and related clients is quite interesting .
Ammonite – thanks for rounding up the usual suspects .
RichieP says:
September 7, 2010 at 2:03 pm
I always understood that Harlech has been cut off from the sea by the Morfa, the dune system, which is caused by longshore drift from another nearby formation along the coast ( a long beach I think). I assume that doesn’t necessarily mean that the sea level here is significantly lower than in medieval times. Just a point, for which I have no immediate references. Though there is the legend of Cantref Y Gwaelod, the lost land beyond the mouth of the Dyfi that the sea reclaimed when, despite warnings, the drunken lord of the area failed to maintain the levees and was drowned with his equally drunk followers .
Inspired no doubt by the fossilised forest at Ynyslas:
http://www.bbc.co.uk/wales/mid/sites/coast/pages/5.shtml
Atomic Hairdryer says:
September 7, 2010 at 11:25 am
“ ‘Ynys’, which is Welsh for Island, and it currently isn’t.”
A.H., While you are about it, see if you can find a map or two that would show the area way back when. It looks to me as though there has been a great deal of sedimentation that has been reworked into a recurved spit. So perhaps the lands upstream were ‘opened and cultivated’ after the Castle was constructed. In-filling of the bay in this manner might be a result of an agricultural revolution in the region following significant settlement following an historical development of some sort. I know nothing of this area but such processes have been documented in other places.
This is a fascinating sidetrip.
Queensland University calculations put sea level rise at 0.3mm per year – that is about an inch a century
http://www.twawki.com/?p=8534
Thanks for this, Tom and Tony, you are absolutely right. IPCC and the various commenters, including scientists, are off in their projections. Here’s a good summary of what the future really looks like, from a comprehensive analysis done at MIT:
http://web.mit.edu/newsoffice/2009/roulette-0519.html
Oops, I forgot to tell you: it’s actually going to be worse than what IPCC and typical scientists are telling us.
REPLY: readers, Mike Roddy’s MO is a “drive by troll”. His history is that he posts potshots like this, then runs from debate. My advice is that you simply ignore him – Anthony
Harlech Castle
I think we all agree that much has changed in the environs of this mighty fortress and that the sea is actually rather closer to the castle than the article suggests.
My main point though was that the photographic evidence used to support the sea level rise article exaggerated the distance from the castle to the sea. This may well have been unintentional and these were the only pictures available to the author. The preceding text on this page highlighted how the media have misused images in order forward the warmist agenda and I suspect that we are all familiar with examples. If sceptics use the same tactics then we are no better and I really feel that the good work included in the article has been let down by a lack of diligence is selecting some of the supporting material. Credibility is lost quickly when we see this lack of attention to detail.
The Link 2 paper from Jones and etc seems to be somewhat at odds with the British history of climate and weather covering the last 2000 years as collected by a British meteorologist from historical records and writings.
This climate and weather history record can be found at the Booty / Metindex site.
http://booty.org.uk/booty.weather/metindex.htm
Adam Gallon says:
September 7, 2010 at 11:23 am
“Are you talking out of your derriere?
“First, it should be obvious that the manipulation of the messages isn’t coming from scientists. It is too professional, too slick and ultimately too wrong.”
Been to Real Climate at all, or don’t you consider Drs Scmidt et al to be scientists?”
Ahemm… RealClimate SLICK??? Repeat that for me. Wait.
http://www.realclimate.org/index.php/archives/2005/01/peer-review-ii/
A typical arbitrary post by M. Mann. No picture. Desert of text. Slickness zero.
Now some typical slickness.
http://www.wwf.co.uk/
Yeah, Whatley Weston & Fox… wait, i meant to say:
http://www.wwf.org/
Cute mammals! See! SLICK!
Richard says:
September 7, 2010 at 12:33 pm
Just testing a thesus right now; so please endulge me.
What if continents float?….
_________________________
You are half right, continents do float, but it is on magma (molten rock) not water. That is why you have a “ring of fire” or volcanoes at the edges of the continental plates. It is the molten rock coming through the weak spots in the earth’s crust.
Ammonite says:
September 7, 2010 at 2:11 pm
“[…]The earth’s climate sensitivity to a doubling of CO2 is around +3C (+/-1C). For a partial list of papers (up to 2006) supporting this proposition read below. ”
The complete list can be found here.
http://www.numberwatch.co.uk/warmlist.htm
I don’t know if you guys are reading all of the links.
It doesn’t matter what the pictures look like,
link 18 says the sea is presently about a 1/2 mile away.
@Rom – the booty.org site is a nice site for historians too, thank you. And tells of a “major storm surge in Cardigan Bay” in 520, a date which fits well with the story of the lost lands.
I think Philip Thomas (12:28 pm) has hit the nail on the head.
John Shade (above at 10:06) refers to an “ethical” public relations company which he claims sexes up climate scare reports. It is interesting that, for a good cause, they consider this “ethical”. I wonder if sexing up weapons of mass destruction reports in order to galvanise a move against a dictator would be regarded as “ethical”? Or perhaps the police fabricating evidence against a known criminal that is too hard to catch. Is that “ethical”? What a wonderful moving feast ethics is.
With respect to sea level change – a huge percentage of the world’s population lives near the sea. You might think that they would have noticed if there was a significant or perhaps even an insignificant rise in sea level. You’d think that there would be one place on the globe where someone would have noticed a sea level change and reported it quick sticks to the local AGW community to turn into another scare. Another polar bear standing on an ice berg photo. I dont think Ive seen anything in the press at all. On the contrary I see more and more housing developments right down to the sea front. There seems to be a mismatch between rhetoric and action that tells its own story.
Doug says:
September 7, 2010 at 1:26 pm
…..Gail. Thanks – I had a read through the references you gave here. It is soul destroying stuff. These weasels have permeated everything with their evil ‘spin’. They operate in the shadows and under rocks. They need bright lights shone upon them so we can see to hunt them out.
Doug
____________________________________________________________
Yes the light of day needs to be shown on these people.
Did you note that one of the funding groups was the Council on Foreign Relations? David Rockefeller of Standard Oil is an honorary chairman and its earlier origins included Paul Warburg, a German, who was responsible for the Federal Reserve Act of 1913. (And the rape of the American public ever since.) Warburg was director of the Council on Foreign Relations at its founding in 1921, remaining on the board until his death.
The more you read about the people and the politics, the more difficult it becomes not to believe it is all planned. Dave Rockefeller even states in his Autobiography “Memoirs”:
“For more than a century, ideological extremists at either end of the political spectrum have seized upon well-publicized incidents such as my encounter with Castro to attack the Rockefeller family for the inordinate influence they claim we wield over American political and economic institutions. Some even believe we are part of a secret cabal working against the best interests of the United States, characterizing my family and me as ‘internationalists’ and of conspiring with others around the world to build a more integrated global political and economic structure — one world, if you will. If that is the charge, I stand guilty, and I am proud of it.” Page 405 of Rockefeller’s autobiography, “Memoirs”, ISBN-13: 978-0812969733.
UN Secretary-General Kofi Annan, at a book signing for “Memoirs” at the UN headquarters in New York, in 2002 — Will Banyan, 2006, (p.2).
“I think without internationalists like you, the international system we have been trying to build, the international system we have today, wouldn’t be here.”
At a meeting of the Trilateral Commission (June 1991); as quoted in Matrix of Power: How the World Has Been Controlled by Powerful Men Without Your Knowledge (2000) by Jordan Maxwell pp. 15-16
“We are grateful to The Washington Post, The New York Times, Time Magazine and other great publications whose directors have attended our meetings and respected their promises of discretion for almost forty years. It would have been impossible for us to develop our plan for the world if we had been subject to the bright lights of publicity during those years. But, the world is now much more sophisticated and prepared to march towards a world government. The supranational sovereignty of an intellectual elite and world bankers is surely preferable to the national auto-determination practiced in past centuries.”
There is just too much information like the above out there to ignore. Here is well referenced information onthe CRF’s sister organization and their attack on US agriculture for example.
GeoFlynx says:
September 7, 2010 at 9:55 am
“Championing the continued dumping of some 30 billion tons of fossil CO2 into the Earth’s atmosphere will, of course, require that sea levels do not rise, ice does not melt, thermometers read high, oceans do not acidify etc.”
30 billion sounds like a lot doesn’t it? How about this: Your president has spent that much, and way , way more. I’d post the number, but with each passing second that number increases by another mind blowing amount. 30 billion don’t seem like so much no-more… On a serious note however, 30 billion tons is a piffle when the entirety of the atmosphere is taken into account. Now go back to your crib before your mommy gets worried.
I was flattered and surprised to see my reply to Tom Fuller elevated to a full post. Had I known, I would have topped and tailed it, as generally I like my articles to have a narrative. Had I written it as an article I would have added much more about the other castles and landmarks of Britain affected by changing sea levels since Roman times and before. Hopefully this piece -written after the event in response to posters- will be acceptable as a postscript.
Firstly, I agree that when examining sea levels we have to be careful in separating out glacial rebound, tilt, deposition etc.
To put our constantly fluctuating sea levels into context may I quote from Brian Fagan, Professor of Archaeology at the University of California and author of ‘The Little Ice Age’ from which this short excerpt is taken.
“Ten thousand years ago the southern North sea was a marshy plain where elk and deer wandered…England was part of the continent until as recently as 6000 BC when rising sea levels caused by post ice age warming filled the North sea. By 3000 BC the ocean was at near modern levels. Sea levels fluctuated continually through late prehistoric and Roman times but rose significantly after 1000 AD. Over the next two centuries the North sea rose as much as 40-50 cms above today’s height in the low countries then slowly retreated again as temperature fell gradually in the north” (arctic)
We can usefully take up the story with this book-it’s all interesting, but on page 552 (halfway down the left column then continue on to the right) it talks of ‘innundation’ around 1200AD of many parts of low land coastal Europe including Holland and Britain. This displaced thousands of coastal dwellers and caused conflict with those whose land they tried to move on to, further inland. Sea levels were about 0.50cm higher than today
http://books.google.co.uk/books?id=yRMgYc-8mTIC&pg=PA552&lpg=PA552&dq=sea+level+height+britain+viking+times&source=bl&ots=OCN9aJt2PG&sig=2lMDcr4rE7WegGy1okZyqyEWJU4&hl=en&ei=UqWGTO2hIIuOjAeUopybCQ&sa=X&oi=book_result&ct=result&resnum=3&ved=0CBsQ6AEwAjgU#v=onepage&q&f=false
Harlech castle was built around 1283 and would of course have reflected the ocean height they saw at the time at around 50cm higher than today, which is why there was a sea gate that enabled small ships to provision the garrison.
We can usefully backtrack to Roman times when sea levels started rising rapidly around 350 AD and coastal areas became flooded.
http://www.lundyisleofavalon.co.uk/history/sealevels.htm
And here;
“Even so, the North Sea had a nasty little jump between 350 and 550AD, flooding the coasts of northern Europe with an extra 2 feet of water and sending its inhabitants — folk known as Angles and Saxons — fleeing (although “conquering” might be the better word) into ill-prepared Roman territories. At the start of this rise, the areas we know as the Fens were a well-settled part of Roman Britain ruled from the town of Duroliponte (Cambridge) by its native people, the Christianized Romano-Celtic Iceni. Then the sea level rose, and history’s curtain went down for two centuries.”
http://www.historynet.com/the-fens-england-below-sea-level.htm
So we can trace two warming eras during Roman and MWP times, which caused sea levels to rise, and the people directly affected to flee from the effects. The changing climate was said to be a major factor in the demise of Rome as the people affected by such events as described here took over previously peaceful prosperous farmland needed to feed Rome’s armies, and of course many ended up in Britain, hence ‘Anglo Saxons’.
For the sake of completeness, here is a little more about ‘post ice age warming which filled the North Sea.’ ‘Doggerland’ -an inhabited area in what is now the North Sea- was swamped by rising sea levels around 8000 years ago when Britain was separated from Europe and became an island.
http://humanities.exeter.ac.uk/archaeology/research/rdoggerland.shtml
The sea level rise at the end of the ice ages is documented here with a good graph, although it is better at showing generality rather than specific events.
http://www.sustainableoregon.com/oceanlevel.html
To get the specifics of today it is worth turning to Dr Morner who is an acknowledged expert on sea levels. Here is his article on his denunciation of the science used by IPCC to calculate sea levels
http://www.climatechangefacts.info/ClimateChangeDocuments/NilsAxelMornerinterview.pdf
A number of people here seem astonished at the notion that sea level rise is not confined to the modern era. Why should we be surprised that previous eras of warmth-such as the Roman or MWP-should cause temperatures and sea levels to rise, or that they should fall when water was locked back in during the little ice age?
The current rise is historically very limited in extent and should be seen in the context of the far more dramatic events that have happened before..
****
PS; Note to Scooper. The pictures were what were available from internet sources. I suggest you visit Harlech Castle in the rain then walk to the sea and you will realise just how far it is. The pictures are reasonably representative. 🙂
Final note re deposition. The Morfa sand dune systen undoubtedly has a effect on deposition and as sea levels dropped and open water became marsh, deposition would subsequently have taken place as the pattern of currents changed. I would also suggest you look across the vast sandy estuary of the afon glaslyn to Porthmadog for additional cause and effect, as a massive sea wall was built there in the 19th century to carry the railway that went to the slate mines,
http://en.wikipedia.org/wiki/Porthmadog
Up to this time the estuary stretched as far inland as Llanfrothen where there was some shipbuilding.
Tonyb
Ammonite,
Many thanks for the extensive article list, but once again, I already know the mainstream position on CO2 and climate sensitivity – no need to restate it for me.
Given that there is no way to construct a reproducible experiment in the lab to test for actual climate sensitivity, we are left with paleoclimatic educated guessing and computer simulation. All very interesting, but despite the volume of “peer reviewed” papers, the (amazingly consistent) conclusions are still speculative in nature. Forgive me if I am not willing to assign a high level of certainty to it as you apparently have.
The public presentation of all this with a high degree of certainty is simply dishonest.
Tom said:
“First, it should be obvious that the manipulation of the messages isn’t coming from scientists.”
I haven’t read all the comments but certainly support any who have said that this above comment is a load of tosh. WUWT is full of “climate craziness of the week” type posts where “scientists” have manipulated reality to suit their own agendas.
Agendas to ensure continued funding based on scaremongering.
And the MSM knows that a scary story sells and if a little extra spin increases the scare then all the better. Agreed Tom?
Tom Fuller says:- “First, it should be obvious that the manipulation of the messages isn’t coming from scientists.”
Tom, you really do need to read the Climategate emails. They clearly show that scientists both in the US and here in the UK are working with the MSM to push an alarmist message to further there own misguided ‘green agenda’. As can be seen from the Climategate white wash, the government in the UK is also involved.