
Guest post by Thomas Fuller and Tony Brown
When we separate what scientists have actually said from what messages are carefully prepared and communicated to us through the media, one thing jumps out to the most casual of readers.
Some marketing strategists reduced the information content of the messages given to the public and introduced popular symbols to indicate what they wanted us to believe was threatened by climate change.
For over 5 years we have been bombarded with images of polar bears, hurricanes, flooded cities, icebergs calving, drought-stricken deserts, and the like. Perhaps the most symbolic representation wasn’t even a picture, but a PowerPoint slide of paleoclimatic temperature reconstructions now famous as the Hockey Stick Chart.
Those symbols all have one thing in common. They were mistakenly used. As has been cataloged here and elsewhere, these ‘signature’ issues were either blown out of proportion or presented falsely.
Polar bears, like all large mammals that haven’t had the good fortune to be domesticated, have a shaky status on this planet–but that status does not appear to have very much at all to do with climbing temperatures. They survived higher temperatures in the past, and their population is rising–and would be rising even more quickly if we quit shooting them, that being the major cause of polar bear deaths.
There is no historical trend in either the frequency or intensity of hurricanes, as Roger Pielke Jr. has pointed out in academic publications. And yet global warming has been blamed for specific storms, such as Hurricane Katrina, in a manner that is frankly antithetical to the principles of science.
And so it is with icebergs calving (a completely normal and mechanical reaction to ice accumulation that happens whether temperatures are rising or falling), droughts (which were worse in the past) and all the other symbolic climate porn photography inflicted upon us.
Yesterday I wrote about sea level rise, and attempts to measure ice loss in Antarctica via satellite. And again, it is very clear that the results of scientific work are being hijacked in an attempt to push a scary message at us. The analysis of gravimeter measurements start with guesses and inferences, and the result is presented with a huge margin of error, and amounts to less than 1% of the annual ice loss Antarctica experiences every year.
Commenter TonyB went to the trouble of cataloging the difficulties inherent in sea level measurements. By rights it should be posted here as an article. I’ll paste it in at the bottom of this piece–and I will wager most readers will think it is more informative than my words above it.
But before I turn the stage over to TonyB, I want to make a couple of points:
First, it should be obvious that the manipulation of the messages isn’t coming from scientists. It is too professional, too slick and ultimately too wrong. This is a professional, coordinated media strategy using calendars with press schedules and release dates, a well-stocked photo library and a rapid response team that shoves new releases out the door in response to news events or skeptical messages that seem to be gaining traction.
Second, and really most important, all of the messages have very serious flaws in the narratives that accompany the pictures they ship out. And it is the exposure of these flaws that has crippled the climate change political movement, far more than criticism or political opposition.
If climate change or global warming is now a declining motivation for political and economic action, and it may well be, the reason is not Monckton or Morano. It is not even more measured criticism coming from McIntyre and Watts. Nor is it corrective science administered by both Pielkes.
It is their own butchery of the facts behind the images they decided we needed to see that hamstrung their movement. If they have been defeated in the first series of battles (in what I predict will be a 30-year war), they done it to themselves.
Here’s Tony–read on!
No problem. I was going to work this up into an article on sea levels one of these days although someone must have already posted an article here on this fragile part of a fragile science.
“We are being bamboozled by science which likes to have a nice graph to explain everything, unfortunately the real world is more complicated than that. Global sea levels are -like global temperatures-a nonsensical artifact dreamt up in a computer laboratory where satellite records are tacked on to manufactured and highly incomplete historic records from selected tide gauges.. Modern Sea level rises- where happening- are not being seen in context as another of those regular cycles that stretch back much further than the satellite records or tide gauges into the depths of recorded time.
This is the latest IPCC assessment which confirms sea level calculations from 1993 are by satellite.(page 5 onwards)
Link1
http://www.ipcc.ch/pdf/assessment-report/ar4/wg1/ar4-wg1-spm.pdf
The sea level calculations rely on an enormous number of variable factors including pressure, location, tides, warmth of oceans, structures, storms, wave heights, surges, stasis, location of the gauge/sensor, slope of the underlying strata etc. The accuracy of measurements is said to be 3cm (10 times the level of the alleged annual rise) but in reality is often vaguer than that because of the inherent difficulties of measuring. Observed real world sea levels generally simply do not show the rate of increase suggested by the IPCC (although this varies enormously from place to place for reasons cited above)
Link 2 The document below was written by many of our old friends including Phil Jones and Mike Hulme-page 19 gives the sea level data
http://ukclimateprojections.defra.gov.uk/images/stories/trends_pdfs/Trends_section1&2.pdf
The information for historic sea levels was ‘extended’ from a paper by one of the scientists at Proudman
Link3
http://www.pol.ac.uk/ntslf/products.php
Link 4 This is reconstruction of sea level data from 1700 of three extremely incomplete Northern Hemisphere records from which IPCC extrapolate their figures, take them to be a global figure and splice them on to the satellite records
Link 5 .
http://www.pol.ac.uk/psmsl/author_archive/jevrejeva_etal_1700/
These three are taken to represent global figures since 1700-much data missing and subsequently interpolated.
Amsterdam from 1700 (Van Veen 1945)
Liverpool since 1768 (Woodworth 1999)
Stockholm since 1774 (Ekman 1988)
It says there are differences even in the same ocean basin between tide gauges of up to plus or minus 6cm rendering their use for a global record to be irrelevant
Link 6
http://www.pol.ac.uk/psmsl/author_archive/jevrejeva_etal_1700/2008GL033611.pdf
pdf from 1700 link
6cm margin of error from tide gauges in same ocean basin
Both the following sites give a good description of the satellite process-which is being constantly refined but doesn’t get more extremely accurate as the inherent flaws in measuring capabilities can’t be fully resolved no matter how many satellite passes are made.
Link 7
http://www.tos.org/oceanography/issues/issue_archive/issue_pdfs/15_1/15_1_jacobs_et_al.pdf
Link 8
http://jchemed.chem.wisc.edu/Journal/Issues/1999/dec/abs1635.html
The following sites deals with problems of satellite accuracy and data;
Link 9
http://www.ocean-sci.net/5/193/2009/os-5-193-2009.html
Link 10
This with reliability
http://www.climateaudit.org/?p=859
Link 11
http://lightblueline.org/satellite-tracking-sea-levels-set-launch
The UK Environment Agency -where possible like to use physical tide gauges as well when developing flood defence schemes, which are both visually observed or can send data electronically. Best of all is gathering information from local people such as the Harbour master or those who work the fishing boats and who know what is really happening.
The following link leads to a graph produced by the Dutch Govt sea level organisation- and confirm sea levels are stable and are somewhat lower than during the MWP. (This won’t stop them reacting to the IPCC by raising sea defences)
Link 12
http://www.climateaudit.org/?p=61
Link 13
We have much observational evidence of historic sea levels (p162 on-including a map in the following link)
Ancient Greek explorer Pytheas traveled to Iceland and not only discovered the frozen seas lying one days journey beyond, but was the first to quantify the moons action as being responsible for tides, and took physical measurements of heights. Sea level heights are generally said to be lower today than back in the Roman warm period and Mwp.
Sea castles in the UK built in the 11th century are now above the sea level entrances which ships used to re-supply them.
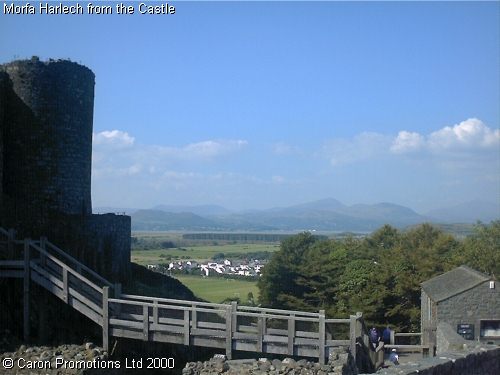
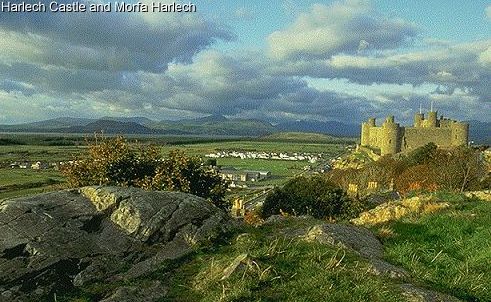
This links leads to a 1913 book on Harlech castle-one such building which is now high and dry-nothing to do with stasis or deposition, but that sea levels are lower now than when it was built 1000 years ago. Suggest readers select the b/w pdf
Link 14
http://www.archive.org/details/merionethshire00morr
Extract
“In 1409 an attack was made upon Harlech, led by Gilbert and John Talbot for
the King; the besiegers comprised one thousand well armed soldiers and a big siege train. The besieged were in the advantageous situation of being able to receive their necessary supplies from the sea, for the waves of
Cardigan Bay at that time washed the base of the rock upon which the castle stands. Greater vigilance on the part of the attacking force stopped this and the castle was surrendered in the spring of the year.
A remarkable feature of the castle is a covered staircase cut out of the rock, defended on the seaward side by a looped parapet, and closed above and below by small gatehouses. This was the water-gate of the fortress,
and opened upon a small quay below.”
Link 15 The following pictures show the current location of the sea.
http://westwales.co.uk/graphics/morfaharlech.jpg
Link 16
Sea in far distance from Harlech castle
http://westwales.co.uk/graphics/harlech.jpg
and this
Link 17
http://www.buildmodelcastles.com/html/castle_history.html
very good item about Harlech
Link 18
http://www.walesdirectory.co.uk/Castles/Harlech_Castle.htm
Sea levels AND temperatures were higher in the MWP and the Roman warm periods and presumably other extended warm periods (the period 1700 to 1740 is looking increasingly comparable to today).
The worlds leading sea level expert Professor Morner has called the IPCC figures ‘a lie.’ Google ‘The greatest lie ever told’
Morner says: “The mean eustatic rise in sea level for the period 1850-1930 was in the order of 1.0-1.1 mm/year,” but that “after 1930-40, this rise seems to have stopped (Pirazzoli et al., 1989; Morner, 1973,2000).” This stasis, in his words, “lasted, at least, up to the mid-60s.” Thereafter, “the record can be divided into three parts: (1) 1993-1996 with a clear trend of stability, (2) 1997-1998 with a high-amplitude rise and fall recording the ENSO event of these years and (3) 1998-2000 with an irregular record of no clear tendency.” Most important of all, in his words, “There is a total absence of any recent ‘acceleration in sea level rise’ as often claimed by IPCC and related groups.”
He concludes: “When we consider past records, recorded variability, causational processes involved and the last century’s data, our best estimate of possible future sea-level changes is +10 +/- 10cm in a century, or, maybe, even +5 +/- 15cm.” See also Morner (1995); INQUA (2000).”
I am inclined to agree with Professor Morner that sea level is not really doing very much generally (with exceptions either way in some places)
Link 19
http://www.publications.parliament.uk/pa/ld200506/ldselect/ldeconaf/12/12we18.htm
The above link dissects the data and states that a rise by 2100 of 5cm is possible…. plus or minus 15cm!
Morner stresses (as I do) that observational data contradicts the theoretical interpolated and massaged data that is used by the IPCC.
John Daly also had a good handle on all this.
Link 20
http://www.john-daly.com/deadisle/index.htm
The sea level is not rising at the rate suggested-it has stumbled in recent years according to many local gauges (what is global sea level supposed to mean with a million kilometres of coastline?)
To reach a 1 metre increase by 2100 means an average of nearly 11mm a year (only 90 years remaining). There is simply no evidence to show this is happening.
We must stop looking at just a few years of data as ‘proof’ of rising levels , and instead view things in a historic context, whilst retaining a great deal of scepticism at the notion you can create a highly accurate global figure in the first place, or that tacking dubious satellite data on to even more dubious tide gauge data is any way to create a worthwhile measurement .
I had intended to cover historic sea levels as a companion to my ‘arctic ice variation through the ages’ series.
Thomas Fuller http://www.redbubble.com/people/hfuller
Generally good stuff. However, in the case of Harlech Castle and the west coast of the UK in general, the land has risen in isostatic adjustment following the departure of the ice cap over Ireland and Cumbria (not to mention a smaller one on Snowdonia). As a rough picture, Great Britain (the island, not anything to do with politics) is tilting down towards the south east and rising in the north west. There are some rather splendid raised beaches in County Donegal up near Malin head.
A more apposite illustration is in the Blackwater estuary (just north of the Thames), where the land is currently sinking at about 5mm/year. The Romans evaporated salt from the sea water near Maldon by boiling off the water (they still do it today) and left a lot of burnt clay behind which they threw into the water. That clay layer is now some four feet above MSL. There are other Roman remains all up the east coast including harbour works and locks, all of which so far as I know are now well above current sea levels despite the isostatic ‘rise’ in sea level.
Tom Fuller , you’re probably right about media strategists but I suspect that it goes deeper than that . Certainly the media hired by the big environmental lobbies slicked up their apocalyptic ( and mostly unfounded ) warnings , but it wasn’t until the environmentalists managed to invent their own science that the real assault began . I’m not talking about the ecology classes that were becoming popular at the time I was in school (’70s) but what grew out of them . Most of the well known “climate” scientists either helped foment the radical wave of modern environmentalism or were their disciples . They have gone from being a group of obscure academics to leaders of a movement . They have published books , brought in huge grants to their departments and gained tenure . At this point in time , they’re the big cheese at their universities . Some have made personal fortunes , or stand to . Perhaps some have even gotten a dangerous whiff of political power and like it . Sadly , I think that they were well intentioned originally but became misguided and manipulated to the point that they view dissent – no matter how well founded – as threatening and possibly immoral . I don’t mean this as a defence – it’s reprenhensible . And I don’t include Romm . Poor Joe’s had a chip on his shoulder ever since Enron went down the tubes .
Remember one of the Climategate documents:
The Rules of the Game – Futerra.
Well where do the ‘labels’ come from….
New Rules;New Game
“22. Label people
If someone undertakes a climate-friendly behaviour (whether they intended to or not), you should say “thanks, you’re clearly someone who cares about the climate”. Next time you want something, say “if you care about the climate you should…”. They’ll be more likely to pay attention, because they’ve started wearing a mental badge that says ‘I care about the climate’.”
These guys, advice, United Nations Energy Programme, DEFRA, GreenPeace, BBC and the UK Government…… (lots of big business, Microsoft, HP, Shell) and Cru..
Last page of the New Rules;New Game
“The original Rules were developed as a guide
for communication which could
change attitudes towards climate
change. They formed the evidence
base that underpins the ongoing
UK Government campaign,
‘Tomorrow’s Climate,
Today’s Challenge’
http://www.climatechallenge.gov.uk.
That evidence base is still very
relevant, and the following Rules
from that document apply just as
much to behaviour as attitude:
• Everyone must use a clear and
consistent explanation of climate
change
• The communications must be
sustained over time
• Partnered delivery of messages
will be more effective
• Government policy and
communications must be
consistent
But, in many cases, the tactics
needed to change attitude
are different to those needed
to change behaviour.
http://www.futerra.co.uk/downloads/NewRules:NewGame.pdf
http://www.futerra.co.uk/downloads/RulesOfTheGame.pdf
How the BBC funds climate change ‘revolutionaries’
http://blogs.telegraph.co.uk/news/damianthompson/100018294/how-the-bbc-funds-climate-change-revolutionaries/
Where did ‘Carbon Footprint’ come from?
“Words that Sell” – Futerra… 2007
http://www.futerra.co.uk/downloads/Words-That-Sell.pdf
Focus grouped – lots of ‘climate’ ‘words’, in 2007…
From the link:
“CARBON FOOTPRINT
This term was generally liked and has clear imagery.
“What you leave behind”
“It’s not about blame, it’s about responsibility”
“It says it clearly”
However, few had ever heard the term, while one observed that “carbon – you
get that everywhere, don’t you?”
An associated term that was also liked was the idea of a ‘positive footprint’.
So much of the green footprint terminology deals with mitigating negative
impacts that it ignores the desire of many people to make a good impression.
“We all leave a trail behind us. We’d like the world to be a nice place when
they grow up”
“If we could all make our footprints a bit more positive, we could really do
something”
This association of footprint with positive impacts as well as negative ones is
a useful development in the sustainable development terminology.
—————————————
From the Intro:
“The use of common words connects members of a community into a network
with formidable collective powers. If sustainability is to become a persuasive
vision, it needs a persuasive language.
We hope this report is a first step in developing that language.”
@Adam Gallon says: September 7, 2010 at 11:23 am
“Been to Real Climate at all, or don’t you consider Drs Scmidt et al to be scientists?”
No, not unless your definition of “Scientist” includes phrenologists, homeopaths and old fashioned Snake Oil Salesmen.
From Futerra:
“Sell the Sizzle” – (YES, they are talking about manmade global warming – CAGW)
http://www.futerra.co.uk/downloads/Sellthesizzle.pdf
“Climate change sounds like hell,so where is heaven?
Climate change itself isn’t the sizzle, it’s the sausage. That’s where our second metaphor comes in. The most common message on climate change is that we’re all going to hell. That’s what climate change looks like when you get right down to it; rising seas, scorched earth, failing food supplies, billions of starving refugees tormented by wild weather.
But contrary to every expectation, hell doesn’t actually sizzle. Hell doesn’t sell. Although these Armageddon climate scenarios might be accurate and eye-catching, they haven’t changed attitudes or behaviours nearly enough. Threats of climate hell haven’t seemed to hold us back from running headlong towards it.”
—————-
Nice to be manipulated isn’t it… Uk government all departments seem to use these guy, and the BBC, and Greenpeace…. and, etc
An excellent post, although the Welsh sea-level examples are a bit dodgy as that coast is retreating from the sea. There is enough global evidence for the MWP and other warmings to put Mann’s mad hockey stick to rest forever.
I am convinced there are very powerful and incredibly well-funded individuals and groups pushing CAGW, but the possibility of the whole thing being a well-conceived plot is highly unlikely as the room for cock-ups is too great. The lack of ethics, sheer greed and cupidity of many politicians, journalists and some scientists works in tandem with the desperate desire of rabid arch-Greens for the control of humankind and those factors are, to me, the real and present danger to the developed world.
GeoFlynx – “The ability to predict what will happen is based on the ability to perceive what is happening. Creation of an alternate reality, in which all inputs contrary to a preset belief are either false or the result of some world wide conspiracy, may be comforting but it is hardly revealing.”
Most participants here make an effort to offer information or opinion related to the original post. You may or may not agree, but you are always free to offer your astoundingly brilliant rebuttal. A condescending tone and thinly veiled insults, however, are not persuasive.
Who has been telling us that 2010 would be the warmest year on record ? WHo is relaying this propaganda already since the begiinning of the year ? Are these people so stupid that they are thinking that their pr can fool the man in the street forever ?
What is reality visible to any man in the street ? That both in the southern and in the northern hemisphere of all agricultural crops harvesting was delayed and nearly all crops showed a lower than average yield . What is really the only cause for this ?
LOWER TEMPERATURES ! And the man in the street is noticing what is happening in front of his eyes , so what will be his reaction to the orchestrated stories ? Probably the same strong belief as there was in communism in the past ……..
Thomas Fuller, in at least one of your other guest posts, I have not been kind to your contributions. Yes, Anthony welcomes many different points of view here, but he usually asks contributors to back up what they write. I am a fellow non-scientist, regular reader of WUWT. I have read and taught in the humanities/social sciences, cultural studies (the non-marxist variety), and especially enjoy history and economics. I dislike the mushy thinking of so-called “liberals” (“using your and my tax dollars to help the poor afford electricity that comes from natural gas, nuclear and other cleaner solutions….” from “Global Energy Use in the 20th Century” 9/1) who make global statements using selected research to tout your favorite positions. Your ideology is not “liberal” IMHO but warmed-over, watered-down marxism.
In this latest essay you want to identify “some marketing strategists” who are the bully/evil ones most signicant in the AGW campaign (30-year war). Come on. “For over 5 years….” Give us some specific references; give us some specific marketing strategists who are the movers in this propaganda war. When exactly did they start? You don’t do your homework. And you get to write these mammoth platitudes (check Google for what Mammoths did to warm our climate). Then you have the gall to say “manipulating of the messages isn’t coming from the scientists”. Well, of course not (for the most part). They have been manipulating the research and peer-review for many more years than 5 years. The have been substituting their “adjusted temperatures” for the raw data for many more than 5 years. How long were Nature and Science touting the lies and stupidity of AGW? Many more years than five. Did these journals require peer review from a variety of scientific perspectives? Did they require the data and methods to be filed for research papers so that other “scientists” (real scientists) could verify the research.
“…The reason is not Moncton and Morano….not even more measured criticism coming from McIntyre and Watts, etc….” Get over yourself. These are the indispensible workers for truth and the scientific method.
This is what counts.
Many commenters are giving the details of some of the mammoth assertions you have made. (See Gail Coombs, e.g.,) If you had done similar homework, and if you had stated that the marketeers were moving the “war” along, I would have respect for you and your contrbutions. Use Tony Brown as your model.
A few years back I wrote a number of times to “RealClimate” pointing out that CSIRO, the Australian national government body for scientific research, stated that the errors involved in estimating sea level rise were greater than the yearly rise James Hansen and others were at that time projecting in a scientific paper which they said would have disastrous consequences.
Needless to say, none of my posts were published.
In addition to post-glacial rebound, tilt (?), and deposition, I would like to posit that the river has migrated to the north (under the influence of deposition?) and perhaps used to scour the bottom of the cliff upon which the castle sits. One can clearly see evidence that the estuary used to meet the sea farther south than it does now. With more snowmelt than it currently receives, the river would have run faster and straighter.
Were it not for the warmist’s sea-level rise, Harlech would be a castle in the sky. /s
We know sea levels were lower in the past. Many of the natural bays and harbors in North America were created by erosion during the last great ice age. So naturally since we are still coming out of that ice age, one would expect the sea levels to be rising slightly. And indeed, the data for the 19 and early 20th centuries confirm that. However, the data since then indicates the sea levels have stabilized. The forecast for the next 90 years is “guess”.
While there may be evidence of global warming, and perhaps some for AGW, rising sea levels does not seem to be part of that evidence.
Gail Combs says: September 7, 2010 at 11:54 am
“… This is a professional, coordinated media strategy using calendars with press schedules and release dates, a well-stocked photo library and a rapid response team that shoves new releases out the door in response to news events or skeptical messages that seem to be gaining traction.”
__________________________________________________
These excerpts should answer the question of whether or not Global Warming is a professional campaign and a lucrative one at that.
====================================================
Gail. Thanks – I had a read through the references you gave here. It is soul destroying stuff. These weasels have permeated everything with their evil ‘spin’. They operate in the shadows and under rocks. They need bright lights shone upon them so we can see to hunt them out.
Doug
More information on global sea level changes can be gleaned from Google Earth.
Find the Cape Town Castle in Cape Town, and see the difference between the current harbour in Cape Town and the Castle. The Castle was built by the VOIC (Vereeningde Oos Indiese Companjie (?) the Dutch company that settled the Cape of Good Hope in the 16th century. The construction of the Castle was started in the 17th century when the first wooden fort that the Dutch built started to rot. Ships used to anchor right next to the Castle. In the Golden Acre shopping centre remants of clay water pipes that were used to replenish the supply of ships at anchor is on display.
Lastly, am I the only one that have read about the adventures of the 19th century German treasure hunter Schliemann that discovered the ruins of Troy and the gold of Troy? He suspected a shift of the sea front and hit the jackpot miles away from the present day sea shore.
GeoFlynx says:
September 7, 2010 at 9:55 am
“…Championing the continued dumping of some 30 billion tons of fossil CO2 into the Earth’s atmosphere …”
Excuse me as I’m unimpressed. 30 billion tons may sound big and scary to you, but not to me. For your 30 billion tons of CO2 nature puts out about 720 billion tons so what are you going to do about that?
The 30 billion tons of “fossil” CO2, which you complain about would contain about a 28% “fossil” carbon content by mass. The balance being non “fossil” 02.
Funny how the 96 -97% of natural CO2 is innocent as the wind driven snow while so called man made CO2 is of the devil and enough to throw the whole world’s climate out of whack.
Philip, 10:13 am
Thanks for the heads-up to that Newark Star Ledger editorial. The article itself was quite entertaining (the warmists are getting even lazier in their presentations), but some of the comments are pretty classic. Here’s my favorite excerpt, a true gem. It was in response to claims about how it is scary so many “right-wing Americans” don’t buy the theory with examples of prior events:
“Sahara Desert too. Humans deforested that thousands of years ago simply by overgrazing.”
From – Sell the Sizzle – Futerra. Media PR communication.
http://www.futerra.co.uk/downloads/Sellthesizzle.pdf
CHOICE
Introduce hell
You’ve sold the sizzle so now
show the alternative. If you lead with a positive
vision, you don’t then have to pull your punches
on climate chaos.
The choice is now Make clear that change won’t
wait, and that the decision moment is now
———————————————–
Personal hell
Climate change doesn’t just affect
weather patterns and polar bears. Lay out the impacts
on hospitals, schools, and the local environment.
Hit lifestyles and aspirations. The more powerful
and compelling your vision, the more hard-hitting
you can make the threat of climate chaos.
——————-
Sounds funny, take a long look at their client list….. (BBC, UK government,etc
http://www.futerra.co.uk/clients/
“sell the Sizzle” – Futerra
Climate Change Deniers
Unfortunately, these guys are back (if they
ever went away). The edge of this group are
the conspiracy theorists who are sure that
climate science is an excuse for either (a) the
environmentalists to curtail consumption or
undermine our way of life, or (b) for the developed
world to hold back the developing world.
———————————–
http://www.futerra.co.uk/revolution/leading_thinking
Futerra and The UK Department for Environment published the Rules of the Game on 7 March 2005. The game is communicating climate change; the Rules will help us win it. The document was created as part of the UK Climate Change Communications Strategy.
About Harlech Castle. The UK is tilting slightly, with the south eastern side sinking and the north western side rising. Harlech is on the west coast.
[Tongue-in cheek] It’s probably because of the concentration of people and resources in the south east.
“The sea level calculations rely on an enormous number of variable factors including pressure, location, tides, warmth of oceans, structures, storms, wave heights, surges, stasis, location of the gauge/sensor, slope of the underlying strata etc.”
To that you can add “sustained offshore winds” in places such as the Gulf of Mexico.
A large ship broke it’s back off Lake Charles partly because of sustained offshore winds which had reduced local sea levels by 5 feet!
Justa Joe says:
September 7, 2010 at 1:35 pm
GeoFlynx says:
September 7, 2010 at 9:55 am
“…Championing the continued dumping of some 30 billion tons of fossil CO2 into the Earth’s atmosphere …”
Excuse me as I’m unimpressed. 30 billion tons may sound big and scary to you, but not to me. For your 30 billion tons of CO2 nature puts out about 720 billion tons so what are you going to do about that?
Nothing, nature takes care of that itself by absorbing 735 billion tons, so it’s net effect is to remove ~15 billion tons from the atmosphere!
From my own experience in Scotland, the Greens were just bumbling amateurs who played host to highly paid con men from the renewables industry who worked 24/7/365 to con the politicians about the dire consequences of “global warming”.
The real money was (paradoxically) coming from big corps like oil companies who were funding the renewable lobby organisations who were in turn taking third rate scientific “research” and sexing it up like a prostitute on viagra. Obviously there were also the NGOs who used global warming to frighten the public into giving the NGOs contributions, but there was no one quite like the renewables lobbyists and their zeal for making money through the billions being diverted to fund renewables.
Ken Hall says:
September 7, 2010 at 10:57 am
GeoFlynx, Nobody is claiming that sea-levels generally are not rising, just that in some localised areas that sea gauges have not recorded a rise, whilst others have and that there is no evidence whatsoever that sea-levels are going to rise in the next century by the extreme of 20 feet that alarmists have predicted, let alone the extremely extreme 20 meters Al gore gave as his worst case.
GeoFlynx – Al Gore did not predict a 20 meter rise in sea level in the next century – he invented the internet!
I always understood that Harlech has been cut off from the sea by the Morfa, the dune system, which is caused by longshore drift from another nearby formation along the coast ( a long beach I think). I assume that doesn’t necessarily mean that the sea level here is significantly lower than in medieval times. Just a point, for which I have no immediate references. Though there is the legend of Cantref Y Gwaelod, the lost land beyond the mouth of the Dyfi that the sea reclaimed when, despite warnings, the drunken lord of the area failed to maintain the levees and was drowned with his equally drunk followers .
simpleseekeraftertruth says:
September 7, 2010 at 12:03 pm
“Further to my post of 11:37. The tidal range at spring tides is around 5 metres (16ft). Sea level is complicated and those engaged in bathymetry chart using Mean Low Water Springs (MLWS) as base, 0.”
Round here the datum (Chart Datum) is usually the Lowest Astronomical Tide (LAT) which is significantly below Mean Low Water Springs (MLWS).
None of which detracts from your points but it is difficult to grasp how a change of a few inches is significant when the tidal range is up to 10 metres in the Channel Islands or 6 Metres at Dover and the normal changes of airpressure can account for another foot (plus or minus).