By Steve Goddard
Summer has come to a premature and frosty end at Santa’s workshop.
")
http://psc.apl.washington.edu/northpole/webphotos/noaa2.jpg
It has been the coldest summer on record north of 80N, and temperatures have dropped below freezing ahead of the average date.
")
The entire ice covered region is now below freezing.
")
http://www.esrl.noaa.gov/psd/map/images/fnl/sfctmp_01.fnl.gif
It also appears that the summer melt season will be the shortest on record. The maximum was reached very late in March, and it appears likely that we are headed for an early minimum.
")
Mark Serreze at NSIDC has stated :
As the climate warms, the summer melt season lengthens …”
He was also reported as saying :
Mark Serreze of the center forecast the ice decline this year (2010) would even break 2007’s record.
Another interesting fact is that we are almost certain to see a large increase in the amount of multi-year ice (MYI) next year. The reason being that almost all of the 1-2 year old ice (turquoise) in the NSIDC map below will become classified as MYI next spring.
")
We have seen a remarkably rapid recovery from the 2008 low volume.
PIOMAS continues to report record low volumes of ice, despite all evidence to the contrary. The image below shows in red how far off the mark their August 15 forecast was. Their modeling error will get much worse over the next two weeks – because they model much of the thick multi-year ice in the Beaufort Sea and Arctic Basin as only a few tens of centimetres thick.

With the cold temperatures, ice area loss has almost stopped.

http://arctic-roos.org/observations/satellite-data/sea-ice/observation_images/ssmi1_ice_area.png
However, ice extent continues to drop – because the Arctic Oscillation has turned negative and winds are compacting the ice towards the pole. This bodes well for continued growth of ice in 2011.
")
http://www.ijis.iarc.uaf.edu/seaice/extent/AMSRE_Sea_Ice_Extent.png
PIPS shows average ice thickness increasing, due to the compression of the ice.
")
There has not been a lot of ice loss during August. The modified NSIDC image below shows in red, areas that have lost ice since August 1. Note that the Greenland Sea appears to have lost ice. This is due to the fact that there has been very little transport out of the Arctic Basin through the Fram Strait, which again bodes well for ice gain in 2011.

The modified NSIDC image below shows ice gain since 2007.

NSIDC maps continue to show more gain (16%) than their graphs (10%.) I have not been able to get a satisfactory explanation from them about the cause of that discrepancy. DMI shows a 25% gain in 30% concentration ice over 2007.
My forecast (dashed line below) minimum of 5.5 million (JAXA) continues to look conservative. It all comes down to what the winds do over the next few weeks. If the winds keep compressing the ice, the minimum may go a little below 5.5. If the winds quiesce, the minimum may come in a little above 5.5 – which is looking like a pretty good number right now. Some people at NSIDC started out with a 5.5 forecast this year, but seem to have backed away from it since.

Academic theories about the Northwest Passage becoming a commercial shipping opportunity appear pretty clueless.
“The plans that you make can change completely,” he says. This uncertainty, delay, liability, increased insurance and other costs of using the Northwest Passage are likely to deter commercial shipping here. A ship with a reinforced hull could possibly make it intact through the passage. But if it got stuck, it would cost thousands of dollars for an icebreaker like the Amundsen to come to the rescue. So even if the Northwest Passage is less ice-choked than before, the route may not become a shipping short-cut in the near future, as some have predicted.
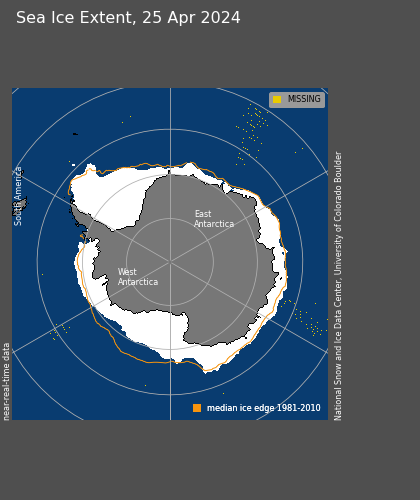
The South Pole will almost certainly set a record for most sea ice this season. It is almost there, and there are still several months of growth remaining.
")
http://www.iup.uni-bremen.de:8084/amsr/ice_ext_s.png

http://nsidc.org/data/seaice_index/images/daily_images/S_daily_extent.png
As seen below, the symmetry between the North and South Pole is impressive through the satellite record. They always seem to move opposite each other and produce an approximately constant amount of sea ice. It would be nice if the experts focused on solving this relationship rather than making up forced explanations like the “Ozone Hole” – which has just started forming for the year and will be gone before Christmas.

UIUC North/south anomalies overlaid on top of each other.
http://arctic.atmos.uiuc.edu/cryosphere/IMAGES/seaice.anomaly.arctic.png
http://arctic.atmos.uiuc.edu/cryosphere/IMAGES/seaice.anomaly.antarctic.png
(Note to posters and ice experts. Before you embarrass yourself making comments about how seasons are out phase at opposite poles, remember that this is normalised data and the period is in excess of 30 years.)
Conclusions:
The “long term trend” (30 years) in Arctic ice continues to be downwards, and would be even if the ice minimum was a record high this summer. But the three year trend shows strong growth of extent, thickness and age. Meanwhile, Antarctic ice is blowing away the record books. Yet the press continues to spread massive disinformation about the state of ice at both poles. Who could possibly be responsible for that?
Sponsored IT training links:
Get COG-112 materials along with 352-001 dumps to practice and pass 000-977 exam in timely and cost saving manners.
Temp north of 80N went a tad lower:
http://ocean.dmi.dk/arctic/plots/meanTarchive/meanT_2010.png
Its below freezing.
RACookPE1978 says:
August 15, 2010 at 10:25 pm
I have not worked with the DMI model data, but I have worked with other reanalysis data and in none of these data sets is there a trend towards cooler Arctic summer temperatures. You also do not see a negative trend in the AVHRR surface temperatures.
I am buying pop corn and awaiting how Mark Serreze’s “Death Spiral” will unfold.
Only, I am suspecting it will be a Spiral of Life, upwards, up, up, up! For many years.
And we, the tiny humans, can go back to concentrating on living our tiny lifes as good and constructive as possible.
The NOAA pole cam is showing one heck of a snow storm, its blowing snow around like crazy and with the melt ponds frozen or freezing over the snow is going to cover the melt ponds and this is going to affect the sea ice extent calculations and the next ‘cryosphere today’ picture of sea ice extent and concentration I think.
The question is of course just how many frozen melt ponds will be covered over by snow and how deep will that snow be, of course I assume that the the people who analyse the pictures count frozen over melt ponds as open ocean?
Walt Meier says:
August 15, 2010 at 5:43 pm
“… there is a serious issue in that seasonal forecasts are becoming more important and they are very difficult (especially in a changing climate).
…
However, as for the long-term forecast, things are clearer – we will lose the summer sea ice as temperatures warm. It’s a matter of if not when.”
walt
I notice you chose to refer to a “changing climate” in the earlier paragraph rather than the “warming climate” you appear to be assuming in the later paragraph.
But then, I also notice where you say “if not when” rather than the “when not if” that you most likely meant for public consumption. Perhaps this little slip is an indication of the sort of discussion going on behind the scenes lately in your shop? The sort of discussion that would lead you to use the phrase “changing climate”?
And are we to interpret the last paragraph as a forecast? And if so, by whom, since these suddenly seem to have become unexpected issues regarding your organization?
Julienne,
My take from this site is that summers must have been generally cold at the North Pole over the past decade.
http://www.arctic.noaa.gov/detect/ice-npole.shtml
Good news. The NSIDC graph is much more in line with their maps today.
http://nsidc.org/data/seaice_index/images/daily_images/N_timeseries.png
Julienne says:
August 16, 2010 at 7:41 am
“During the melt season, extent would be the more “correct” number to be looking at, even though in reality there is less ice present than measured by the total extent. This is because melt ponds “appear” as open water in the sea ice algorithms applied to passive microwave brightness temperatures. Thus, the true area will be underestimated during advanced melt, with errors of 30-40%. This is the reason why NSIDC reports on the ice extent and not the ice area.”
Julienne,
30-40% strikes me as a huge error. Can I assume you mean up to 30-40% of a particular cell being analyzed, and not of the overall Arctic sea ice area calculation?
Also, with this sort of underestimate (even in a cell) does that imply that many of the central Arctic regions that show reduced extent are actually solid ice sheets covered with significant melt ponds? Or do they tend to be areas of floating ice as I think some of us have been assuming (well, me anyway.)
Finally, regarding your comment on summer temperature trends, do you tend to discount the DMI temperature measurements then? Others are more accurate? If so, could you provide a link or two? Thanks.
Rod
David W says:
August 15, 2010 at 8:21 pm
As you say, one day isn’t that important. But typically JAXA puts up a revised number several hours after the original is posted, and with the revised number the daily drop was only 39688 km^2. 🙂
Incidentally, the average the last 12 days is 56133 km^2. This is a 833 less than 2005, >10000 less than 2007, >21000 less than 2008, ~6000 more than 2006, and ~2500 more than 2005.
If the remainder of the season is like 2002/2003/2006, we can expect to beat 2009 and maybe 2005 and end as high as 5.4e6 km^2. If it’s like 2004/2005/2009, we’ll end up short of 2009 in the 5-5.15e6 km^2 range. Finishing like 2007 puts us a bit below this, and finishing like 2008 is the only way to end up in the 2008 range.
If you believe Steve’s plots from PIPS 2.0, then barring wind-based compression, it’s quite possible for the ice extent to surpass 2009 and even 2005. If we see a lot of wind compression, then we’ll likely see something more like 5e6 km^2. We’d have to see a record drop from here on out to go lower than 2008…any hypotheses on what would cause that?
Note – all of this is using the JAXA data. I have optimism for the rest of the season reaching 2009 levels on this dataset since it already has reached 2009 on the DMI and NORSEX data.
-Scott
Breaking news:
http://fakescience.tumblr.com/post/963124050/research-in-antarctica
Rod Everson says:
August 16, 2010 at 9:19 am
Typically the accuracy of the total ice concentration is about +/-5% in winter and +/-15% in summer when melt ponds are present. Some additional weather related effects and land contamination will also occur, which together all affect the accuracy of the total ice extent and the total ice area.
A paper by Agnes and Howell (2003) found that when comparing the NASA team sea ice area (which is what NSIDC’s arctic sea ice news and analysis website uses) to Canadian Ice Charts, an error of 44% was found in summer, with differences reducing to less than 10% in winter.
Some of the reduced ice concentrations you see in the interior of the ice pack may indeed be a result of a melt pond over a solid sheet of ice. To check to see if that is the case, I typically take a look at the MODIS imagery to see if the reduced ice concentrations are a result of more open water or more melt ponds. For example in the Beaufort Sea at the moment, it is clear that the reduced ice concentrations reflect more open water within the ice pack.
There’s a paper by Andersen et al. (2007) that compares several different sea ice algorithms (many of which are used by the different institutions linked to on WUWT) that may of interest for many of you to read so that you can better understand the differences in ice extent being reported.
As for the DMI data, I am not sure if they are using the updated version of ECMWF in their temperatures or not. If they are not, I would not trust the trends as several papers have been written on accuracy problems with that data set, in particular with regard to the temperature record (a quick google search will help you find those papers, some of which were published in Nature a couple years ago). With any reanalysis data product there are going to be problems because of lack of observations to assimilate into the model, especially north of 80N. I never use surface temperatures from reanalysis because they have been shown to not be very accurate. Instead I use near surface air temperatures at 925 mbars.
stevengoddard says:
August 16, 2010 at 9:06 am
Julienne,
My take from this site is that summers must have been generally cold at the North Pole over the past decade.
http://www.arctic.noaa.gov/detect/ice-npole.shtml
———————————-
Steve, I’m not sure I follow. That link is to web cams at the North Pole starting in 2002. So first off there is not context to past decades, and the images on the page show melt pond evolution through summer, which when looking at July would certainly not lead me to believe temperatures were getting colder the last few years.
Just The Facts quoting Mecago:
Wait ten years and ask your question again. I suspect of course that the predictions of the ice cap recuperating in THICKNESS IN A FEW YEARS AS WELL AS EXTENT (Made on this very site) will have been long forgotten. The next step in proselytizing will be Natural Global Warming as the official Oil Company sponsored Truth.”
And responding:
Impressive gibberish. Thank you for providing us with another example of why skeptics are winning this debate…
XXXXXXXXXXXXXXXXXXXXXX
Congratulate yourself all you want because, while you’re mocking others for supposedly making iron clad predictions, you seem to have selective amnesia for yours.
Besides, the ten years are not over yet. When they are, go back to square one.
Julienne says:
August 16, 2010 at 7:51 am
That’s why we have a “look out the window” webcam. For model data analysts to compare numbers to reality.
Far too often, especially in these times, analysts do not pay attention to anything but computer-generated data.
This is also why we communicate ‘weather’ to each other.
It’s really difficult to find reports that match what is going on down on planet Earth, what with the
“It’s a matter of if not when” occupational bias that colors the presentation.
Viewed from afar, the climactic institutions are doing an exceedingly poor job of it.
Sorry, but that’s how it looks to us mere mortals.
Julienne,
I highlighted the interesting passage.
” Julienne says:
August 16, 2010 at 7:48 am
Alexej,
I think you don’t quite understand the sentence. The sentence is in reference to the forecast made by Lindsay and Zhang’s numerical model.”
It does not matter if I understand the sentence, just one of the words. So Lindsay and Zhang 3.96 is a forcast (because a computer is doing it?). Meier, Stroeve and Serreze 4.74 do the same thing, but it is not a forecast? So you use the word “forecast” differently than normal people (“to make a prediction”, according to Webster’s). Is Goddard 5.5 (based on almost anything aviable) a forecast? Is Buergin 5, based only on ice not having grown 3 years in a row before, a forecast?
And “skill” obviously has nothing to do with ability? And when Serreze twaddles about the future, what does he do in climatespeak?
Looks like everything turned bold ;^) Not much of a highlight.
Steve, according to passive microwave retrievals of melt onset, the average melt onset date for the central Arctic (note of course the north pole is not observed by the satellite) is day 174, or June 23rd. (and further note I am not including the Beaufort, Chukchi, E. Siberian, etc. in my definition of the central Arctic). In 2007 the mean melt onset date for the central Arctic was day 171, it was day 170 in 2008, day 177 in 2009 and day 173 in 2010. It was quite a bit earlier though in 2004-2006 with values of 166, 162 and 167, respectively.
Note also in your above highlighted text they talk about extensive melt pond coverage in 2003 and 2004, and the lack of information from 2005 or 2007. I wouldn’t make a bold statement that temperatures have been getting colder the past decade based on this limited set of melt pond pictures.
Steve,
One of the things that I distinctly remember when watching the 2008 ice recovery from 2007, was that the JAXA sea ice extent for 2007 was at its maximum essentially at March-1 (graph eyeball, not table data) and did not reach its all time low till the last week of September; and I commented at the time (late 2008) that the 2008 refreeze; or at least the sea ice minimum extent per JAXA started about two weeks earlier, or maybe it was ten days; but in any case the 2007 melt season at least as delineated by JAXA sea ice extent was pretty much the longest on record; and some part of the 2008 “recovery” was likely due to that two week earlier start to the refreeze.
Clearly 2010 is fixing to mess with our heads once again with its “anomalous” gyrations.
Legal disclaimer !
I hereby declare that I had no part in the bolding of the above, since I have no knowledge of how to accomplish that.
mecago says: August 16, 2010 at 10:41 am
“Congratulate yourself all you want because, while you’re mocking others for supposedly making iron clad predictions, you seem to have selective amnesia for yours.
Besides, the ten years are not over yet. When they are, go back to square one.”
More drivel. I have written a multitude of comments on this site, can you identify one where I;
1. Congratulate myself
2. Mock others for supposedly making iron clad predictions
3. Have selective amnesia for my own predictions
?
You are not worth arguing with, as you don’t make any sense…
Here is the mean melt onset date derived for the central Arctic region from 1979 through 2010 for those who are interested (values given in day of year):
year melt onset date
1979 180
1980 173
1981 174
1982 178
1983 180
1984 175
1985 170
1986 175
1987 174
1988 178
1989 174
1990 175
1991 176
1992 177
1993 167
1994 172
1995 171
1996 183
1997 173
1998 167
1999 168
2000 171
2001 276
2002 174
2003 172
2004 167
2005 162
2006 167
2007 171
2008 170
2009 177
2010 174
from this data, there is a small trend towards earlier melt onset in the central Arctic at 2.5 days per decade.
Steve,
Ahh, I see how it works here… so if I make a video that overlays ‘This is 10%’ superimposed on the arctic, then that makes me right. I’ll get right on it.
On second thought, I’ll just stick with the numbers that I calculated from the actual data used to generate your arctic maps. The numbers that unequivocally come out to 10% difference between 2010 and 2007, regardless of what the text overlay in your video claims.
oops, 2001 should be 176 of course..
Matt
How about you figure out what the maps and data don’t agree? I don’t generate either, I just report on them.