By Steve Goddard
Summer has come to a premature and frosty end at Santa’s workshop.
")
http://psc.apl.washington.edu/northpole/webphotos/noaa2.jpg
It has been the coldest summer on record north of 80N, and temperatures have dropped below freezing ahead of the average date.
")
The entire ice covered region is now below freezing.
")
http://www.esrl.noaa.gov/psd/map/images/fnl/sfctmp_01.fnl.gif
It also appears that the summer melt season will be the shortest on record. The maximum was reached very late in March, and it appears likely that we are headed for an early minimum.
")
Mark Serreze at NSIDC has stated :
As the climate warms, the summer melt season lengthens …”
He was also reported as saying :
Mark Serreze of the center forecast the ice decline this year (2010) would even break 2007’s record.
Another interesting fact is that we are almost certain to see a large increase in the amount of multi-year ice (MYI) next year. The reason being that almost all of the 1-2 year old ice (turquoise) in the NSIDC map below will become classified as MYI next spring.
")
We have seen a remarkably rapid recovery from the 2008 low volume.
PIOMAS continues to report record low volumes of ice, despite all evidence to the contrary. The image below shows in red how far off the mark their August 15 forecast was. Their modeling error will get much worse over the next two weeks – because they model much of the thick multi-year ice in the Beaufort Sea and Arctic Basin as only a few tens of centimetres thick.

With the cold temperatures, ice area loss has almost stopped.

http://arctic-roos.org/observations/satellite-data/sea-ice/observation_images/ssmi1_ice_area.png
However, ice extent continues to drop – because the Arctic Oscillation has turned negative and winds are compacting the ice towards the pole. This bodes well for continued growth of ice in 2011.
")
http://www.ijis.iarc.uaf.edu/seaice/extent/AMSRE_Sea_Ice_Extent.png
PIPS shows average ice thickness increasing, due to the compression of the ice.
")
There has not been a lot of ice loss during August. The modified NSIDC image below shows in red, areas that have lost ice since August 1. Note that the Greenland Sea appears to have lost ice. This is due to the fact that there has been very little transport out of the Arctic Basin through the Fram Strait, which again bodes well for ice gain in 2011.

The modified NSIDC image below shows ice gain since 2007.

NSIDC maps continue to show more gain (16%) than their graphs (10%.) I have not been able to get a satisfactory explanation from them about the cause of that discrepancy. DMI shows a 25% gain in 30% concentration ice over 2007.
My forecast (dashed line below) minimum of 5.5 million (JAXA) continues to look conservative. It all comes down to what the winds do over the next few weeks. If the winds keep compressing the ice, the minimum may go a little below 5.5. If the winds quiesce, the minimum may come in a little above 5.5 – which is looking like a pretty good number right now. Some people at NSIDC started out with a 5.5 forecast this year, but seem to have backed away from it since.

Academic theories about the Northwest Passage becoming a commercial shipping opportunity appear pretty clueless.
“The plans that you make can change completely,” he says. This uncertainty, delay, liability, increased insurance and other costs of using the Northwest Passage are likely to deter commercial shipping here. A ship with a reinforced hull could possibly make it intact through the passage. But if it got stuck, it would cost thousands of dollars for an icebreaker like the Amundsen to come to the rescue. So even if the Northwest Passage is less ice-choked than before, the route may not become a shipping short-cut in the near future, as some have predicted.
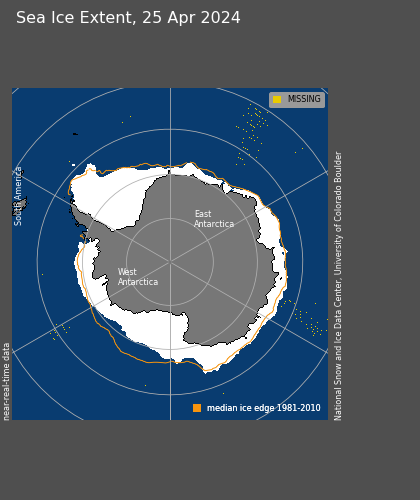
The South Pole will almost certainly set a record for most sea ice this season. It is almost there, and there are still several months of growth remaining.
")
http://www.iup.uni-bremen.de:8084/amsr/ice_ext_s.png

http://nsidc.org/data/seaice_index/images/daily_images/S_daily_extent.png
As seen below, the symmetry between the North and South Pole is impressive through the satellite record. They always seem to move opposite each other and produce an approximately constant amount of sea ice. It would be nice if the experts focused on solving this relationship rather than making up forced explanations like the “Ozone Hole” – which has just started forming for the year and will be gone before Christmas.

UIUC North/south anomalies overlaid on top of each other.
http://arctic.atmos.uiuc.edu/cryosphere/IMAGES/seaice.anomaly.arctic.png
http://arctic.atmos.uiuc.edu/cryosphere/IMAGES/seaice.anomaly.antarctic.png
(Note to posters and ice experts. Before you embarrass yourself making comments about how seasons are out phase at opposite poles, remember that this is normalised data and the period is in excess of 30 years.)
Conclusions:
The “long term trend” (30 years) in Arctic ice continues to be downwards, and would be even if the ice minimum was a record high this summer. But the three year trend shows strong growth of extent, thickness and age. Meanwhile, Antarctic ice is blowing away the record books. Yet the press continues to spread massive disinformation about the state of ice at both poles. Who could possibly be responsible for that?
Sponsored IT training links:
Get COG-112 materials along with 352-001 dumps to practice and pass 000-977 exam in timely and cost saving manners.
Anu
Did they teach you at MIT what the word “significant” means?
From the NSIDC FAQ page:
Wintertime Antarctic sea ice is increasing at a small rate and with substantial natural year-to-year variability in the time series. While Antarctic sea ice reached a near-record-high annual minimum in March 2008, this does not indicate a significant long-term trend. To borrow an analogy from sports, one high day, month, or even year of sea ice is no more significant than one early-season win would be in predicting whether the hometown team will win the Super Bowl ten seasons from now.
———————————
“a near-record-high annual minimum” in one month, in one year “does not indicate a significant long-term trend.”
NOT significant, NOT long-term, NOT trend
It doesn’t “indicate” ANYTHING, but it is yet another opportunity to mention the words “significant”, long-term, and “trend”.
J & W, doesn’t this unending use of suggestion and prevarication make you feel even a little uncomfortable.
Are we really to believe that indignant words will be directed at journalists for things written two years ago?
It’s embarrassing to witness the attempts at pacifying dissenters.
On the other hand, your contributions of analysis and perspective, including predictions, are great!
Walt Meier says:
August 15, 2010 at 5:43 pm
We do occasionally use “forecast” in an informal sense, though I can understand that some people may take it literally. I apologize if people take it the wrong way.
Better yet, stop doing it.
If you can’t make strong predictions, then don’t make any. If you do make strong predictions, don’t weasel out afterwards.
David W says:
August 15, 2010 at 9:24 pm
After the minimum extent is done for the year we can start taking bets on where we might head for a maximum extent particularly if the minimum is reached early.
Interesting. So just keep the Arctic threads coming year round?
Just The Facts says:
August 15, 2010 at 9:46 pm
[–SNIP–]
Everything seems factual and reasonable until the last sentence:
“Regardless, with a growing radiative forcing, an eventual transition to ice-free summers seems inevitable.”
Why was this sentence included? It seems highly speculative and no supporting evidence is provided.
XXXXXXXXXXXXXXXXXXXXXXXXXXXXXXXXXXXXXXXXXXXXX
Perhaps it seems inevitable because several decades of observations; discussed to death and proven up the Ying Yang while being duly denied by many; makes it obvious to the authors.
So while you’re claiming that no evidence has been provided, not only has it been ad naseum, but there’s no point in rehashing it in a single page of “Summary Report”.
Wait ten years and ask your question again. I suspect of course that the predictions of the ice cap recuperating in THICKNESS IN A FEW YEARS AS WELL AS EXTENT (Made on this very site) will have been long forgotten. The next step in proselytizing will be Natural Global Warming as the official Oil Company sponsored Truth.
Uh oh, JAXA just took a turn into 2008, headed for 2009. Is 2005 in its sites?
http://www.ijis.iarc.uaf.edu/seaice/extent/AMSRE_Sea_Ice_Extent_L.png
When all is said and done is Steven Goddard going to wearing the daddy pants?
Anu says:
August 15, 2010 at 10:06 pm
Quite the display of Wishful Thinking:
http://climateinsiders.files.wordpress.com/2010/08/myforecastverificationaugust15_2010.jpg
We’ll soon know if Santa brings you what you wished for.
stevengoddard says:
August 15, 2010 at 7:45 am
I don’t see any indication of significant melt occurring. It is compaction, not melt, we are seeing.
This is what sea ice melt looks like (8/15/10 in the Beaufort Sea):
http://rapidfire.sci.gsfc.nasa.gov/subsets/?subset=Arctic_r05c02.2010227.aqua.250m
Those swirly lines show when sea ice becomes sea water – when the melting sea ice “runs out of thickness”. Look closely over the next 5 weeks – after that, melt season is pretty much over.”
Took me a moment to get my bearings on the photo which conveniently cuts off just before the much higher ice concentrations off the Canadian Archipelago. Which incidentally if you check the current direction of ice drift is what the ice in the photo will be replaced with shortly.
I can go back several weeks and find in a simlar condition in the same area and guess what, that ice is still there today.
Another example of a very carefully framed photo covering a very specific area and not at all indicative of the overall picture. Nice one Anu. If you think a signifcant proportion of the ice in the Beaufort Sea side of the Arctic Basin is going to completely go in the next 4 weeks your completely deluded.
I can understand though Anu, after the early excitement in May and June you probably thought all your christmases had come at once. Then July came and its all been a bit depressing for you since.
” Walt Meier says:
August 15, 2010 at 5:43 pm
On the front page of the Outlook it explicitly says:
‘The intent of the SEARCH Sea Ice Outlook effort is not to issue predictions, but rather to summarize all available data and observations to provide the scientific community, stakeholders, and the public the best available information on the evolution of arctic sea ice.’
We do occasionally use “forecast” in an informal sense, though I can understand that some people may take it literally. I apologize if people take it the wrong way.”
The front page of the SEARCH Pan-Arctic Full Outlook states:
“…ice is very thin, leading Lindsay and Zhang to predict a new record low for September 2010 with an R2 value of 0.84, suggesting a high degree of skill in the forecast.”
Please, Dr. Meier, inform the author of these words (she has the initials J. S.) that “forecast” is a four letter word.
The DMI graph is especially impressive. However last week a few commented on a broken temperature sensor, on one of the automated stations out on the drifting ice. I assume that the Danes,
1.) Are aware of it
2.) Do not use that data
However I also know one shouldn’t assume. Lots of these arctic sites are run by understaffed and overworked crews, and I worry that the broken sensor might be automatically injecting its false and cold-biased data into a prearranged program.
I would be greatly reassured if someone could make absolutely sure this isn’t occurring. I’d be pretty embarrassed to use this DMI graph in a debate with an Alarmist, only to find out it isn’t accurate.
If it is accurate, it is truly remarkable. There’s nothing like it in any prior years.
Can any Danes out there reassure a worry-wart?
Steve,
Concerning the NSIDC data, as I pointed out before (http://wattsupwiththat.com/2010/08/05/analysis-of-nsidc-august-4-news/#comment-452214), there must be a bug in whatever method you’re using to count pixels from the NSIDC maps. When I count pixels from the binary data they use to generate their maps (which I’ve downloaded from their FTP), I get the same % difference as what you’ve calculated from their graph — 10%.
Here are the counts for Aug 14:
2007 — 8151 pixels
2010 — 9049 pixels
“Regardless, with a growing radiative forcing, an eventual transition to ice-free summers seems inevitable.”
What growing radiative forcing?
Oh, they must mean the GCM output rated at $Billions/.1C
Quite the business model, I must admit, for it’s got selling Super Bowl commercial time beat to a pulp.
“Regardless, with a growing radiative forcing, an eventual transition to ice-free summers seems inevitable.”
According to Spencer, there is no growing radiative forcing. Great minds do not think alike.
But if there were a growing radiative forcing, the conclusion would be correct.
Caleb says:
August 16, 2010 at 1:13 am
The Danes are not the only ones reporting plummeting temps @ur momisugly 80N.
…”Yet the press continues to spread massive disinformation about the state of ice at both poles. Who could possibly be responsible for that?”
_____________________
We seem to have a pandemic of viral origin that even the CDC has yet to properly issolate and name – let me try: “Stupidus Climagechangeium Argumenti”. This is getting to be worse than the pandemic of the early 1940’s – “Whosi Ist Oni Firsti”.
Two critical observations:
1. Government hacks need to speak only facts.
2. The father of AGW had to be a guy named Soros.
The numbers continue to go down. Extent is now lower than 5,000,000 sk and the latest loss was still above 40,000sk.
They have slowed from closer to 60,000sk a day last week. But mother nature will have to put the brakes on before the end of august to stay above 5.5.
Hopefully this video will make it clear to everybody. Green represent areas with 2010 ice which were not present in 2007.
[youtube=http://www.youtube.com/watch?v=KlhZKosj4bI]
DMI shows 25% more ice in 2010.
mecago says: August 15, 2010 at 11:21 pm
“Perhaps it seems inevitable because several decades of observations; discussed to death and proven up the Ying Yang while being duly denied by many; makes it obvious to the authors.
So while you’re claiming that no evidence has been provided, not only has it been ad naseum, but there’s no point in rehashing it in a single page of “Summary Report”.
Wait ten years and ask your question again. I suspect of course that the predictions of the ice cap recuperating in THICKNESS IN A FEW YEARS AS WELL AS EXTENT (Made on this very site) will have been long forgotten. The next step in proselytizing will be Natural Global Warming as the official Oil Company sponsored Truth.”
Impressive gibberish. Thank you for providing us with another example of why skeptics are winning this debate…
mecago says:
August 15, 2010 at 10:03 pm
Mecago – I’m afraid your anger is misplaced. I was merely pointing out one many examples of past hyperbolic media reports of the “death” of the arctic, featuring some of our favorite CAGW types like Mark “The Arctic is Screaming” Serreze. Even if we “read further” that the chance was “50/50”, don’t you think the new article was over-the-top (and incorrect, as it turned out…)? I think you need to direct your ire at the UK Telegraph, and let THEM know how you feel. I know you can do it!
“I’ve even seen fools, on this very site, insist that it had to be 2013 because WE were responsible for the Media’s representation of us.”
“We” – “us”? Mecago – Do you work for the government-funded global warming industry? Don’t worry, Mecago – there’s enough Climate Ca$h to go around…
Does anyone have an opinion in which is more accurate? Area or extent? As both have been tossed around on WUWT.
Snowlover123,
Similar to the difference between average and median, they both matter, and they should both be taken into account. They each have slightly different definitions.
rbateman says:
August 16, 2010 at 3:44 am
Caleb says:
August 16, 2010 at 1:13 am
The Danes are not the only ones reporting plummeting temps @ur momisugly 80N.
You also can see how is weather there here:
http://www.uni-koeln.de/math-nat-fak/geomet/meteo/winfos/synNNWWarctis.gif
Snowlover123
Area is more useful for measuring the amount of ice, albedo etc. Extent is more useful for telling you where you might bump into ice. Area measurements are more error prone.
Snowlover123 says:
August 16, 2010 at 6:27 am
Does anyone have an opinion in which is more accurate? Area or extent? As both have been tossed around on WUWT.
——————
During the melt season, extent would be the more “correct” number to be looking at, even though in reality there is less ice present than measured by the total extent. This is because melt ponds “appear” as open water in the sea ice algorithms applied to passive microwave brightness temperatures. Thus, the true area will be underestimated during advanced melt, with errors of 30-40%. This is the reason why NSIDC reports on the ice extent and not the ice area.
Alexej Buergin says:
August 16, 2010 at 12:32 am
” Walt Meier says:
August 15, 2010 at 5:43 pm
On the front page of the Outlook it explicitly says:
‘The intent of the SEARCH Sea Ice Outlook effort is not to issue predictions, but rather to summarize all available data and observations to provide the scientific community, stakeholders, and the public the best available information on the evolution of arctic sea ice.’
We do occasionally use “forecast” in an informal sense, though I can understand that some people may take it literally. I apologize if people take it the wrong way.”
The front page of the SEARCH Pan-Arctic Full Outlook states:
“…ice is very thin, leading Lindsay and Zhang to predict a new record low for September 2010 with an R2 value of 0.84, suggesting a high degree of skill in the forecast.”
Please, Dr. Meier, inform the author of these words (she has the initials J. S.) that “forecast” is a four letter word.
————————————
Alexej,
I think you don’t quite understand the sentence. The sentence is in reference to the forecast made by Lindsay and Zhang’s numerical model. The model shows an increase skill in forecasting the September minimum using G1.0 (area with less than 1.0m of ice) as a predictor for the minimum.