By Steve Goddard
Summer has come to a premature and frosty end at Santa’s workshop.
")
http://psc.apl.washington.edu/northpole/webphotos/noaa2.jpg
It has been the coldest summer on record north of 80N, and temperatures have dropped below freezing ahead of the average date.
")
The entire ice covered region is now below freezing.
")
http://www.esrl.noaa.gov/psd/map/images/fnl/sfctmp_01.fnl.gif
It also appears that the summer melt season will be the shortest on record. The maximum was reached very late in March, and it appears likely that we are headed for an early minimum.
")
Mark Serreze at NSIDC has stated :
As the climate warms, the summer melt season lengthens …”
He was also reported as saying :
Mark Serreze of the center forecast the ice decline this year (2010) would even break 2007’s record.
Another interesting fact is that we are almost certain to see a large increase in the amount of multi-year ice (MYI) next year. The reason being that almost all of the 1-2 year old ice (turquoise) in the NSIDC map below will become classified as MYI next spring.
")
We have seen a remarkably rapid recovery from the 2008 low volume.
PIOMAS continues to report record low volumes of ice, despite all evidence to the contrary. The image below shows in red how far off the mark their August 15 forecast was. Their modeling error will get much worse over the next two weeks – because they model much of the thick multi-year ice in the Beaufort Sea and Arctic Basin as only a few tens of centimetres thick.

With the cold temperatures, ice area loss has almost stopped.

http://arctic-roos.org/observations/satellite-data/sea-ice/observation_images/ssmi1_ice_area.png
However, ice extent continues to drop – because the Arctic Oscillation has turned negative and winds are compacting the ice towards the pole. This bodes well for continued growth of ice in 2011.
")
http://www.ijis.iarc.uaf.edu/seaice/extent/AMSRE_Sea_Ice_Extent.png
PIPS shows average ice thickness increasing, due to the compression of the ice.
")
There has not been a lot of ice loss during August. The modified NSIDC image below shows in red, areas that have lost ice since August 1. Note that the Greenland Sea appears to have lost ice. This is due to the fact that there has been very little transport out of the Arctic Basin through the Fram Strait, which again bodes well for ice gain in 2011.

The modified NSIDC image below shows ice gain since 2007.

NSIDC maps continue to show more gain (16%) than their graphs (10%.) I have not been able to get a satisfactory explanation from them about the cause of that discrepancy. DMI shows a 25% gain in 30% concentration ice over 2007.
My forecast (dashed line below) minimum of 5.5 million (JAXA) continues to look conservative. It all comes down to what the winds do over the next few weeks. If the winds keep compressing the ice, the minimum may go a little below 5.5. If the winds quiesce, the minimum may come in a little above 5.5 – which is looking like a pretty good number right now. Some people at NSIDC started out with a 5.5 forecast this year, but seem to have backed away from it since.

Academic theories about the Northwest Passage becoming a commercial shipping opportunity appear pretty clueless.
“The plans that you make can change completely,” he says. This uncertainty, delay, liability, increased insurance and other costs of using the Northwest Passage are likely to deter commercial shipping here. A ship with a reinforced hull could possibly make it intact through the passage. But if it got stuck, it would cost thousands of dollars for an icebreaker like the Amundsen to come to the rescue. So even if the Northwest Passage is less ice-choked than before, the route may not become a shipping short-cut in the near future, as some have predicted.
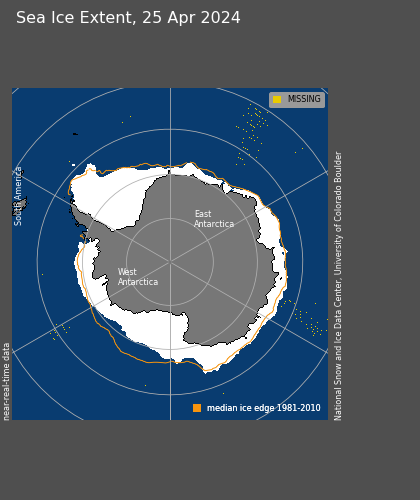
The South Pole will almost certainly set a record for most sea ice this season. It is almost there, and there are still several months of growth remaining.
")
http://www.iup.uni-bremen.de:8084/amsr/ice_ext_s.png

http://nsidc.org/data/seaice_index/images/daily_images/S_daily_extent.png
As seen below, the symmetry between the North and South Pole is impressive through the satellite record. They always seem to move opposite each other and produce an approximately constant amount of sea ice. It would be nice if the experts focused on solving this relationship rather than making up forced explanations like the “Ozone Hole” – which has just started forming for the year and will be gone before Christmas.

UIUC North/south anomalies overlaid on top of each other.
http://arctic.atmos.uiuc.edu/cryosphere/IMAGES/seaice.anomaly.arctic.png
http://arctic.atmos.uiuc.edu/cryosphere/IMAGES/seaice.anomaly.antarctic.png
(Note to posters and ice experts. Before you embarrass yourself making comments about how seasons are out phase at opposite poles, remember that this is normalised data and the period is in excess of 30 years.)
Conclusions:
The “long term trend” (30 years) in Arctic ice continues to be downwards, and would be even if the ice minimum was a record high this summer. But the three year trend shows strong growth of extent, thickness and age. Meanwhile, Antarctic ice is blowing away the record books. Yet the press continues to spread massive disinformation about the state of ice at both poles. Who could possibly be responsible for that?
Sponsored IT training links:
Get COG-112 materials along with 352-001 dumps to practice and pass 000-977 exam in timely and cost saving manners.
Out of interest, the first two weeks of August have had basically average extent reduction (very slightly over). So averages sometimes work. 😉
mecago says:
August 15, 2010 at 2:00 pm
“Frankly” speaking mecago, it’s too bad that the alarmist news headlines don’t state those probabilities “frankly” but instead produce the hype headlines that I noted above. As for Mark Serreze, I didn’t mean to imply that he made a prediction, since, as we all know now, he is NOT a forecaster, and any “forecasts” he does make are to be treated as his own opinions (you know, like “The Arctic is screaming”) and not official products of the NSIDC…
From: R. Gates on August 15, 2010 at 9:26 am
That’s good to know. Mainly because according to the real Sea Surface Temperature map
http://polar.ncep.noaa.gov/sst/ophi/color_sst_NPS_ophi0.png
as found from the main page (with many more such maps)
http://polar.ncep.noaa.gov/sst/ophi/
the water temps are quite chilly, with much of the Arctic basin at -1.5°C and below, and most of the rest at 0 to -1.5°C, thus the mostly freshwater sea ice appears to be in little danger of any dramatic additional melt.
Anyone know of an archive for these maps?
The PIPS Ice Displacement Forecast has shown for several days a tendency for movement roughly towards Greenland, more like the Nares Strait and Ellesmere Island. This is where the PIPS Ice Concentration Forecast shows the greatest Arctic sea ice concentrations, with predominantly 95-100% along the shore with a wide surrounding area being at least 85%, with a narrow strip alongside that being at least 80%. Thus, to me, looks like compaction is occurring there leading to high concentrations. The PIPS Ice Thickness Forecast shows a large chunk of thicker ice found in that area, 4.00-3.75 m thick, but it’s considerably smaller that the high-concentration region which otherwise has thicknesses comparable to about half the Arctic basin sea ice.
Anyone know of a map that clearly shows the individual “regions” like Baffin Bay and the Chukchi Sea etc? It’s time I should get around to memorizing them.
Still looking good for 5.7 +/- 0.1 million km^2 extent per IARC-JAXA (actually 5.6 +0.2/-0.0 10^6 km^2).
The Cat Index forecasts cooler weather approaching in central PA. Eight of the eleven were allowed (encouraged) to live outdoors during the yearly warm period. With food and fresh water supplied outdoors, few wished to come indoors even for brief visits and even when raining/sprinkling. Currently some are coming inside for longer visits, including long sleeps, portending cooler weather. Hopefully the tomatoes, which were put out late, will still get enough warmth and sunlight to finish up.
The Saturday to Sunday morning project (incl. afternoon nap) was replacing the old diaphragm pressure tank, which ended up being replacing everything between the plastic line coming in from the well and the copper pipe supplying everything, due to thick rust deposits in the steel portion of the piping (high iron concentrations in the water around here). PVC was selected, in 1″ (plumbing sizing), due to possible buildup/corrosion, me being borderline able to solder copper joints if absolutely necessary, and lack of space and a helper to wield the large wrenches on iron (the two-footers are a pain, the three- and four-footers are insane). A few threaded brass and steel bits were used. After extensive measuring, dry fitting, pipe cutting, avoiding of severe profanity, and inhalation of purple primer and PVC solvent cement fumes, the completed system was fired up after 5AM to 30-50 psi. After further thread tightening and determining a slow “weeper” at a PVC joint didn’t require immediate repair but rather a (temporary) small bucket, followed by purging of rust-contaminated water at the faucets, sleep commenced at 6AM.
Thus I have some catching up of site content to do. Responses to this comment may not be all that prompt. 😉
Steve, the average you quoted above is from our outlook based on May data and based on survival rates of different ice ages, not extent decline rates. You are correct that such approaches may not work very well any more because the character of the ice cover has changed so dramatically. Now that we’re in August, the decline gets more and more constrained – there’s only so much time left to lose ice and average is less likely to be far wrong. So Dave Gould’s assessment is reasonable.
As for Antarctic sea ice, “Just the Facts” is on the right track – look at the Antarctic Oscillation. In terms of out of phase behavior with the Arctic, Steve, your animation with the shifting axes, as nice as it is, is rather unconvincing. As I said before, if you look at the correlation numbers, the evidence just isn’t there
Finally, in regards to my comments on Mark’s “forecast”, I think it’s a fine line. We are always asked such questions and we can’t resist thinking about them. Scientifically, prognostications about the upcoming summer minimum are not particularly important (the long-term trend is), but if they’re a fun parlor game. Beyond this parlor game though, there is a serious issue in that seasonal forecasts are becoming more important and they are very difficult (especially in a changing climate).
Neither Mark or I or anyone else are “forecasters” in the strict sense of the work and on the front page of the Outlook it explicitly says:
“The intent of the SEARCH Sea Ice Outlook effort is not to issue predictions, but rather to summarize all available data and observations to provide the scientific community, stakeholders, and the public the best available information on the evolution of arctic sea ice.”
We do occasionally use “forecast” in an informal sense, though I can understand that some people may take it literally. I apologize if people take it the wrong way.
However, as for the long-term forecast, things are clearer – we will lose the summer sea ice as temperatures warm. It’s a matter of if not when. (And as Julienne states above, we have never said “2012” or “2013” as a plausible ice-free date.)
walt
stevengoddard says:
August 15, 2010 at 2:13 pm
Amino Acids in Meteorites
I have some proprietary video editing/effects software (which I used to be lead developer for.) It is not publicly available yet.
Actually I meant what you did with the graphs to make the video, the steps you took.
Julienne says:
August 15, 2010 at 1:41 pm
Frank K. says:
August 15, 2010 at 11:23 am
Frank, no one at NSIDC has ever predicted a seasonally ice-free Arctic by 2012. That prediction was made by a scientist at the Naval Postgraduate School.
—
Fair enough, Julienne, but the article I linked to states:
“The Centre has been predicting that the Arctic Ocean could be virtually ice-free by 2012 but that point may be reached within months rather than years.”
The Centre = NSIDC.
Was the Telegraph wrong? If so, I hope a request for a correction was submitted by the NSIDC…
Roger, are you joking? What dry technical article in any rag, internet or otherwise, has the author listed with such prominent font style and arrangement?
Here are a couple of possible scenarios for the next 2 weeks bearing in mind the 2008 rate of loss of 1.041 million sq km during the last 17 days of August was the highest on JAXA records whilst the lowest was 429,000 in 2006:
1) We match 2008’s rate of loss for the remainder of August taking the extent to 4.98 million sq km.
2) We match 2006’s rate of loss for the remainer of August taking the extent to 5.59 million sq km.
3) We lose 100,000 sq km than 2008 loss rate taking the extent down to 4.88 million sq km
4) We lose 100,000 sq km less than 2006 taking the extent down to 5.692 million sq km
Then compare those minimums at the end of August with:
2007 4.607
2008 5.029
2009 5.447
I’m putting my money on scenario 2. which would leave us about 100,000 sq km up on 2009 by the end of August.
We probably wont have a record low melt from here on in…but the JAXA record is short enough that it doesn’t take that much of an anomaly to get a “record”. 2008 saw a record melt from this point forward. But honestly, it was 7 years worth of data. Now its 9 years worth.
If this year flattens like 2006, then it certainly could challenge or surpass the “record” for least melt from here on out. The ice area plus 30% conecntration certainly suggests that we could see a pretty decent flattening of the line at any time now, however, I would probably think that we see something between 2009 and 2006 from here on out putting the min around last year or maybe just a hair above, but it shouldn’t be very shocking if its the “record” slow melt do to the pathetic sample size on the JAXA.
Roger Knights says:
August 15, 2010 at 4:18 pm
Anthony Watts says:
August 15, 2010 at 2:12 pm
Village idiot
Actually sea ice news is written by steve goddard
It’s easy to miss the fact that the author of a thread isn’t the person who posted it (you). Therefore, author’s names should be boldfaced and/or enlarged and/or centered.
——————
Roger, I know! That sneaky Anthony Watts authors the first 17 sea ice news posts, then this mysterious Steve Goddard slides in for number 18.
It should have been revealed in vivid red and underscored.
There again, Idiot got it straight with a little help, so it can’t be too tough. I wonder how he’ll do with number 19.
“By the way, the Arctic was ice-free for 248,000,000 of the past 250,000,000 years”
Not sure where this little factoid came from or whether it’s accurate, but if it’s even roughly true it gives us an interesting perspective on the nature of the Arctic, a totally marine environment.
It suggests that its default or “natural” state is to be ice free, and that makes sense to me. What is extraordinary is that so much ice does form, and then remains as ice, when the conditions for its formation and retention are so inimical.
The oceans are a massive heat sink of water (with high specific heat) between OC and 30C, with currents redistributing heat from warmer to colder places (the net result, according to basic thermodynamics). To freeze salt water, the air boundary layer – a puny heat-containing medium by comparison – must first depress the temperature of a column of water (not just the surface, because of density circulation effects) to -2C, and then remove the latent heat of fusion (80 cal/gm). All this while wave action is doing its best to prevent solidification from happening. Then, once ice has formed, it acts as an insulator, making it more difficult for the “coldness” to penetrate and further thicken the ice.
The fact that 15 million km2 of ice can form at all in these conditions is testament to the staggering hostility of the air/wind systems at high latitudes.
What is just as surprising is that in summer – with air temperatures above zero, sea temperatures above zero as well as warm(ish) currents flowing into the region, and with the sun potentially bearing on it for up to 24 hours per day around the summer solstice – not all of the ice melts, only about two thirds of it.
The wonder is not that some of the ice melts in summer, but that any remains at all, because all of the physical processes are stacked against it.
Even if the Arctic were to become ice free in the near future – which seems extremely unlikely, given current trends – it would not be anomalous – it is the existence of summer ice that is the anomaly. The trouble with warmists is that they are obsessed with the history of the last five minutes rather than taking the longer view, say, 250 million years.
For those who think the polar regions are fairly represented by a big red splotch (based on a single temperature station), I invite you to pick a spot up there, any spot, winter or summer, and stand there in your budgie-smugglers (Speedos) for 10 minutes. It’s not just icicles that snap off.
Günther Kirschbaum says:
August 15, 2010 at 4:56 pm
how do this year’s air temperatures compare to 2007, 2008 and 2009 around the same date? Not just the DMI modeled temperature above 80N, but the entire Arctic. That should give some perspective to your assertion that “the summer melt season will be the shortest on record”.
Günther,
You can look these numbers up yourself to find out. Then you could have the perspective you are looking for and not have to wait for someone else to do it.
It’s not hard to believe this year could have the shortest melt season.
And again, what are the other temperature data sources other than DMi for north of 80N?
R Gates
In the spring when Arctic air temps were above the line you and others were lecturing on how ice thickness was controlled by air temps. Now with Arctic air temp going through the floor, you dismiss it as irrelevant. WUWT?
And what in the name of the sweet Holy Mother is “diverged ice”?
You seem optimistic on your road to Calvary.
“Always look on the bright side of life”.
David W,
I would plump for somewhere in the middle: around 5.3 million by the end of August, with another 280,000 or so of extent loss for the remainder of the season.
David Gould says:
August 15, 2010 at 5:04 pm
Out of interest, the first two weeks of August have had basically average extent reduction (very slightly over). So averages sometimes work. 😉
I’m pretty sure I remember Steven Goddard saying the first 2 weeks of August would show a drop in extent and then it would slow down. (I may be remembering wrong)
At some point very soon JAXA 15% will have to head quickly toward showing what DMi 30% is showing, i.e., 2010 being higher than 2009 and having the possibility of crossing 2005. The only thing that can stop that is strong winds pushing ice backwards.
There’s only ~4 weeks left to minimum, probably less. 🙂
David Gould says:
August 15, 2010 at 4:45 pm
But your prediction relies on this season having a record low melt from now on in. You would have to admit that that is highly unlikely.
David we’ve had a record late date for the winter maximum and record melt during the Spring. Why would you think another record was “unlikely”? You know what they about things happening in threes.
More popcorn, please.
Frank K. says:
August 15, 2010 at 5:35 pm
……he is NOT a forecaster, and any “forecasts” he does make are to be treated as his own opinions (you know, like “The Arctic is screaming”) and not official products of the NSIDC…
Nice link. From it:
” “The Arctic is screaming,” said Mark Serreze, senior scientist at the government’s snow and ice data center in Boulder, Colo.”
Very non-alarmist. 😉
Walt Meier says:
August 15, 2010 at 5:43 pm
(especially in a changing climate)…… However, as for the long-term forecast, things are clearer – we will lose the summer sea ice as temperatures warm. It’s a matter of if not when.
But climate is cooling. Unless you believe computer animations and not data. Where is the missing heat?
Amino Acids in Meteorites,
If August stays on average, the extent drop will slow, as that is what happens at this time of year – on average. 😉
This is the list of averages I have made from the JAXA data for the rest of August:
57375.2
53687.6
50999.8
53375
57594
48124.8
38812.8
43374.8
43031.2
40687.6
41343.8
41531
32531.6
22843.6
35906.2
38125
19999.8
Note that they are only based on the last five years.
Richard M,
Of course it may happen. But it is unlikely. As you have pointed out, though, unlikely things have happened this season. 🙂
Richard M says:
August 15, 2010 at 6:46 pm
we’ve had a record late date for the winter maximum and record melt during the Spring
Also July had the lowest loss for any July on JAXA record. Temps are already below freezing above 80N. It’s actually easier to believe minimum will be reached earlier than usual that it is to believe it will be other than earlier than usual.
But it all comes down to the winds……. and I’ve already got more popcorn.
Well, not to beat a dead horse, but this is what Mark Serreze did say (or at least the BBC quoted him as saying) about that 2013 date.
“But Wieslaw is a smart guy and it would not surprise me if his projections came out.”
http://news.bbc.co.uk/2/hi/science/nature/7139797.stm
Yes, he expressed caution and noted that the forecast was probably too aggressive, but at the same time, the above quote seems to indicate to me that he himself thinks it’s “plausible”. It was also picked up as “evidence” by a number of climate activist sites, with no apparent clarification offered by Serreze or anyone else at NSIDC.
It’s not just a nitpick. People in the employ of governments who are charged with collecting and analyzing data for purposes of advising policy makers seem to all too often be loose cannons who are more intent on giving their personal opinon or pushing some agenda rather than in being sober analysts and scientists. They then find themselves having to say “that’s not what I meant” or “I was misunderstood” or “I was misquoted”.
These Arctic ice threads are so much fun….what will we do after minimum is reached??
Whilst you can say the DMI temps are only for the Arctic Basin, I would have to think this still has an impact on overall ice extent and area.
You have to remember that ice drifting out of the basin into warmer waters contributes to ice loss (as R Gates pointed out in an earlier post). Surely then, whats happening in the Basin itself governs the state of the ice drifting out inot warmer waters.
This is why I feel the very low DMI temps are relevant to whats likely to occur in the coming month.
Walt Meier says: August 15, 2010 at 5:43 pm
“As for Antarctic sea ice, “Just the Facts” is on the right track – look at the Antarctic Oscillation.”
Credit where credit is due, that’s actually based on an observation from Julienne a while back.
“In terms of out of phase behavior with the Arctic, Steve, your animation with the shifting axes, as nice as it is, is rather unconvincing. As I said before, if you look at the correlation numbers, the evidence just isn’t there.”
I think we should be careful before dismissing nascent indications of Global Sea Ice balancing mechanisms. We are not talking about a simple linear relationship easily isolated on a monthly basis, but rather complex interactions between the Global Atmospheric Oscillations occurring over significantly longer timescales. Here is some background on the relationships between the Global Atmospheric Oscillations;
http://webcache.googleusercontent.com/search?q=cache:SyNZdbGlSxAJ:scichina.com:8080/kxtbe/EN/article/downloadArticleFile.do%3FattachType%3DPDF%26id%3D418397+correlation+aao+decadal&cd=6&hl=en&ct=clnk&gl=us&client=firefox-a
and this article points out some of the differences between the Arctic and Antarctic Oscillations:
http://docs.google.com/viewer?a=v&q=cache:gRcNezOcO3oJ:www.scichina.com:8080/kxtbe/fileup/PDF/08ky1740.pdf+correlation+aao+and+AO&hl=en&gl=us&pid=bl&srcid=ADGEESgncEG2PmIfOCjT2KJlJah9_RoUFwVMnddP-TQ__CqZAetgZYiaBz9um9qTwsNKahvMhgnc5nYnz8S-wQDJUEHvmqOxFLVi5bRCbEc_XOYrBnV-5Tz_bLsP9SR-bXDdm_0p1XkM&sig=AHIEtbReOuylUK0He5qXPRx3CrZ46C_W4A
All of this aside, you didn’t address my question as to why NSIDC doesn’t offer a Global Sea Ice Extent chart. Note that as a skeptic, I try to put forth facts and let them speak for themselves. My issue with NSIDC is that sometimes it seems to be proselytizing, versus offering unbiased scientific reporting and analysis. Publishing a Global Sea Ice Extent chart prominently on the NSIDC website would be a significant step towards dispelling this perception.