By Steve Goddard
Summer has come to a premature and frosty end at Santa’s workshop.
")
http://psc.apl.washington.edu/northpole/webphotos/noaa2.jpg
It has been the coldest summer on record north of 80N, and temperatures have dropped below freezing ahead of the average date.
")
The entire ice covered region is now below freezing.
")
http://www.esrl.noaa.gov/psd/map/images/fnl/sfctmp_01.fnl.gif
It also appears that the summer melt season will be the shortest on record. The maximum was reached very late in March, and it appears likely that we are headed for an early minimum.
")
Mark Serreze at NSIDC has stated :
As the climate warms, the summer melt season lengthens …”
He was also reported as saying :
Mark Serreze of the center forecast the ice decline this year (2010) would even break 2007’s record.
Another interesting fact is that we are almost certain to see a large increase in the amount of multi-year ice (MYI) next year. The reason being that almost all of the 1-2 year old ice (turquoise) in the NSIDC map below will become classified as MYI next spring.
")
We have seen a remarkably rapid recovery from the 2008 low volume.
PIOMAS continues to report record low volumes of ice, despite all evidence to the contrary. The image below shows in red how far off the mark their August 15 forecast was. Their modeling error will get much worse over the next two weeks – because they model much of the thick multi-year ice in the Beaufort Sea and Arctic Basin as only a few tens of centimetres thick.

With the cold temperatures, ice area loss has almost stopped.

http://arctic-roos.org/observations/satellite-data/sea-ice/observation_images/ssmi1_ice_area.png
However, ice extent continues to drop – because the Arctic Oscillation has turned negative and winds are compacting the ice towards the pole. This bodes well for continued growth of ice in 2011.
")
http://www.ijis.iarc.uaf.edu/seaice/extent/AMSRE_Sea_Ice_Extent.png
PIPS shows average ice thickness increasing, due to the compression of the ice.
")
There has not been a lot of ice loss during August. The modified NSIDC image below shows in red, areas that have lost ice since August 1. Note that the Greenland Sea appears to have lost ice. This is due to the fact that there has been very little transport out of the Arctic Basin through the Fram Strait, which again bodes well for ice gain in 2011.

The modified NSIDC image below shows ice gain since 2007.

NSIDC maps continue to show more gain (16%) than their graphs (10%.) I have not been able to get a satisfactory explanation from them about the cause of that discrepancy. DMI shows a 25% gain in 30% concentration ice over 2007.
My forecast (dashed line below) minimum of 5.5 million (JAXA) continues to look conservative. It all comes down to what the winds do over the next few weeks. If the winds keep compressing the ice, the minimum may go a little below 5.5. If the winds quiesce, the minimum may come in a little above 5.5 – which is looking like a pretty good number right now. Some people at NSIDC started out with a 5.5 forecast this year, but seem to have backed away from it since.

Academic theories about the Northwest Passage becoming a commercial shipping opportunity appear pretty clueless.
“The plans that you make can change completely,” he says. This uncertainty, delay, liability, increased insurance and other costs of using the Northwest Passage are likely to deter commercial shipping here. A ship with a reinforced hull could possibly make it intact through the passage. But if it got stuck, it would cost thousands of dollars for an icebreaker like the Amundsen to come to the rescue. So even if the Northwest Passage is less ice-choked than before, the route may not become a shipping short-cut in the near future, as some have predicted.
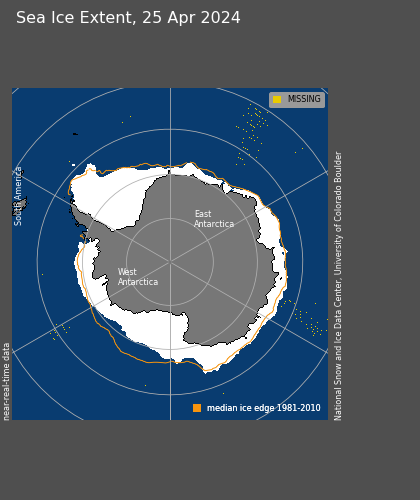
The South Pole will almost certainly set a record for most sea ice this season. It is almost there, and there are still several months of growth remaining.
")
http://www.iup.uni-bremen.de:8084/amsr/ice_ext_s.png

http://nsidc.org/data/seaice_index/images/daily_images/S_daily_extent.png
As seen below, the symmetry between the North and South Pole is impressive through the satellite record. They always seem to move opposite each other and produce an approximately constant amount of sea ice. It would be nice if the experts focused on solving this relationship rather than making up forced explanations like the “Ozone Hole” – which has just started forming for the year and will be gone before Christmas.

UIUC North/south anomalies overlaid on top of each other.
http://arctic.atmos.uiuc.edu/cryosphere/IMAGES/seaice.anomaly.arctic.png
http://arctic.atmos.uiuc.edu/cryosphere/IMAGES/seaice.anomaly.antarctic.png
(Note to posters and ice experts. Before you embarrass yourself making comments about how seasons are out phase at opposite poles, remember that this is normalised data and the period is in excess of 30 years.)
Conclusions:
The “long term trend” (30 years) in Arctic ice continues to be downwards, and would be even if the ice minimum was a record high this summer. But the three year trend shows strong growth of extent, thickness and age. Meanwhile, Antarctic ice is blowing away the record books. Yet the press continues to spread massive disinformation about the state of ice at both poles. Who could possibly be responsible for that?
Sponsored IT training links:
Get COG-112 materials along with 352-001 dumps to practice and pass 000-977 exam in timely and cost saving manners.
Walt
Why is there no Global Sea Ice Extent chart on NSIDC’s website?
Perhaps something like this;
http://arctic.atmos.uiuc.edu/cryosphere/IMAGES/global.daily.ice.area.withtrend.jpg
for Extent?
Frank K. says:
August 15, 2010 at 11:23 am
“There is supposed to be ice at the North Pole – not water,” said Mark Serreze of the US National Snow and Ice Data Centre (NSIDC) in Colorado.
XXXXXXXXXXXXXXXXXXXXXXXXXXXXXXXXXXXXXXXXXXXXX
Cherry picking your quotes? That’s not too “frank” of you Frank.
Please notice that it is stated as a 50/50 chance. You should haven ‘frank’ in admitting that qualification. Also their quote of Mark Serreze is suspiciously fragmented.
MECAGO
XXXXXXXXXXXXXXXXXXXXXXXXXXXXXXXXXXXXXXXXXXXXX
Ice at the North Pole may disappear completely within the next few months for the first time in 20,000 years.
Arctic sea ice is now retreating so quickly that scientists say there is now a 50-50 chance that it will have gone completely by September.
[– SNIP–]
“There is supposed to be ice at the North Pole – not water,” said Mark Serreze of the US National Snow and Ice Data Centre (NSIDC) in Colorado.
The Centre has been predicting that the Arctic Ocean could be virtually ice-free by 2012 but that point may be reached within months rather than years.
http://www.telegraph.co.uk/earth/earthnews/3345666/North-Pole-ice-may-disappear-by-September.html
Mr. Watts. Tony. (Can I call you that? Or should I just call you Master?)
Great post! (Standard intro.)
Oooww! Information overload!! Just shows you need absolutely no credentials to understand the true meaning of polar ice data!
Your NW passage bit. With the destination (Kugluktuk) no wonder they found a whole load of ice to crash through! Parry Channel looking pretty much ice free though. Check you geography and ice maps.
Can’t sort out a ALL the wheat from the chaff here, but i think your takehome message is: The Arctic ice is continuing to recover, multi-year ice is on the up (what no southward tranportation during winter?) Willing to put your head on the block here? Has the Great Cooling started? Yes, I know we have an El Nino and that that the global temp. figures from the ‘experts’ will show a dip – but is this the REAL THING? Not like the duds we have had in the past?
So. Is this it, or Watt?
I think Casper is on to something:
“Something must have happened in the atmosphere…”
Yup. Dead right there – chck out around pages 107-110:
http://www1.ncdc.noaa.gov/pub/data/cmb/bams-sotc/climate-assessment-2009-lo-rez.pdf
Maybe a little unsettling that there are record low temps. at the pole. More extreme weather?
Village idiot
Actually sea ice news is written by steve goddard
We recently had a moderate El Nino. It is not surprising if the rate of Arctic ice recovery pauses for a season. In any event the northern oceans retain warmth from the past long run of powerful late 20th Century El Ninos hence the still downward Arctic ice trend over the full 30 year period despite the recovery over the past two seasons.
The upcoming La Nina plus a slow cooling of the northern oceans as the late 20th Century effects gradually fade should produce the real turning point next year.
The quiet sun should keep the polar oscillation negative unless we get a large uptick in solar activity. Consequently, cold northern continents this coming winter should give the Arctic a slow start to next Spring’s melt season.
Much more significant will be the Arctic response to the upcoming La Nina
Amino Acids in Meteorites
I have some proprietary video editing/effects software (which I used to be lead developer for.) It is not publicly available yet.
You can get something similar here for free :
http://www.cinefx.org/
Jimbo says:
August 15, 2010 at 12:32 pm
Am I correct in stating that an Arctic sea ice extent recovery over the next 3 years would put the theory of positive feedback at the Arctic in serious trouble?
Then there’s this:
“The predicted substantial decrease in Arctic summer sea ice concentrations during the twenty-first century may favor cloud formation, which should diminish or even cancel the ice-albedo feedback by shielding the surface.”
XXXXXXXXXXXXXXXXXXXXXXXXXXXXXXXXXXXXXXXXXXXXXX
No, you’re not correct in making long term predictions based on (alleged) short term fluctuations. Remember that 10 years from now.
It’s also nice to see that you are focused on the reversal of a one dimensional factor such as albedo while ignoring the multi-dimensional consequences of altered weather systems and its effects on crops.
Hi Steven, its really nice with this complete ice-overview.
Hard to escape the facts this way.
Something bothers me: For weeks and weeks the compare utily at chryosphere is down.
And would it be interesting to see compares of Arcitc ice now-vs-previous-years? YES!
These days the compare utility has been parked under the “older products”
http://arctic.atmos.uiuc.edu/cryosphere/
– so its perhaps suddenly just an “old product” to compare between years?? And the money going to climate resaerch did not make t possible to continue this feature?
How long are Chryosphere going to keep the compare utility down? Until the summer minimum is well over?
K.R Frank
Pamela Gray-
Great point on wind driven change. That should be answerable, just not by me.
Figures. Seemed muddled. I wondered how you managed it with your day job 😉
Look at that Northwest Passage.
The Northern Sea Route looks about to be open any day now. The last remnant of ice attached to the Siberian shores is about to be pushed away northwards, if this weather forecast is accurate.
mecago says:
August 15, 2010 at 2:31 pm
“…altered weather systems and its effects on crops”
____
You must mean the projected bumper crops across the board this year. All of that snow was great for the crops this year, wasn’t it.
Gunther, what do you see in your links that says the passage will be clear? I’m seeing just the opposite. Clouds will prevent any further significant solar melting. The winds are forecasted to be not very strong and will diminish. Is your forecast mixed with hope?
An update on the Antarctic Oscillation (AAO), which appears to be a significant contributor to the current record high Antarctic Sea Ice Extent:
http://nsidc.org/data/seaice_index/images/s_plot_hires.png
In July 2010 the Antarctic Oscillation (AAO) had its 2nd largest positive anomaly in the historical record, following only May 1989:
http://www.cpc.noaa.gov/products/precip/CWlink/daily_ao_index/aao/monthly.aao.index.b79.current.ascii.table
Note that when viewing the top 15 largest positive anomalies in chronological order:
1979 June 1.70
1979 July 2.41
1985 July 1.91
1989 May 2.69
1989 June 1.99
1993 July 1.96
1994 August 1.91
1998 April 1.93
1999 May 1.64
1999 Oct 1.65
1999 Dec 1.78
2006 May 1.70
2007 Dec 1.93
2010 July 2.42
2010 June 2.07
2 occurred in 1979, 2 in 1989, 3 in 1999 and 2 thus far in 2010, indicating that there is a decadal aspect to the Antarctic Oscillation (AAO).
From a visual perspective:
Here is a animation of the Southern Polar Vortex and AAO over the last month;
http://www.cpc.noaa.gov/products/intraseasonal/z500_sh_anim.shtml
Here’s an animation of a global view;
http://www.cpc.noaa.gov/products/intraseasonal/z200anim.shtml
and here is an animation of the Northern Polar Vortex and Arctic Oscillation (AO) over the last month:
http://www.cpc.ncep.noaa.gov/products/intraseasonal/z500_nh_anim.shtml
Pamela, FWIW, there’s a big high forecasted over the Canadian Archipelago, which means less clouds and probably some even better satellite images of the area.
I agree with you that we won’t be able to see the Northern Sea Route opening up because of a low developing between the Kara and Laptev Seas. But there are people on the ground there who will tell us.
I am sure that the web cam at the north pole could be confusing visitors , the cams temperature has been averaging 10 degrees C for most of the Summer and gives the impression to the casual visitor that things are not too chilly at the north pole – so obviously the ice must be melting in the warmth – is this what people are supposed to think ?
Pamela is right.
Can we get a study of the amount of “ice” in the 15% ice number that is realy just ice drifting away from packs to be melted elsewhere. This would argue that the 30% number is the real number we should follow.
Welcome to the 2010 Arctic Time Portal.
Just trundle on up there and set sail in your catamaran through the NW Passage.
Hundreds of years from now, someone will stumble across the preserved remains of your trajedy in crystal-blue ice water.
Some may wonder what the hapless voyager was thinking….brave yet astonishingly stupid.
It’s easy to miss the fact that the author of a thread isn’t the person who posted it (you). Therefore, author’s names should be boldfaced and/or enlarged and/or centered.
I think that 5.5 is a very brave prediction at this point, with 4.5 equally brave. If we have an average reduction in ice extent from here, we get 5 million. Two standard deviations either way give us approximately 4.6 to 5.4 million.
David Gould
Using “average reductions” NSIDC came up with 3.58 for 2008
http://nsidc.org/images/arcticseaicenews/200805_Figure4.png
“Average reductions” don’t work.
Steve, that previous estimate from NSIDC was for a 40% ice concentration threshold since the ice age products use a 40% ice concentration threshold to track the ice. So unfortunately it doesn’t represent all the ice.
stevengoddard,
But your prediction relies on this season having a record low melt from now on in. You would have to admit that that is highly unlikely.
I also doubt that that is based on average extent loss. When it talks about an average estimate, it is, I assume, the average of a number of different estimates.
When I use JAXA data and take the average loss prior to 2008 and use that to predict 2008 final extent, I get the following:
Approximately 5.2 million +/-.4 million. Thus, I would have massively overestimated the minimum, as 2008 had a record loss from this point. So, you are correct that averages do not do a good job at predicting yearly variation, because records do happen. But records are not common. Averages and standard deviations do give us some good information.
Steven Goddard, how do this year’s air temperatures compare to 2007, 2008 and 2009 around the same date? Not just the DMI modeled temperature above 80N, but the entire Arctic. That should give some perspective to your assertion that “the summer melt season will be the shortest on record”.
On a second read of that graph, it does show what you say it does. On what date did they make that prediction? It says 200805. Does that mean May? May averages have very low correlation to final extent.